Washington, New York (NY) income map, earnings map, and wages data
The median household income in Washington, NY in 2022 was $89,207, which was 10.8% greater than the median annual income of $79,557 across the entire state of New York. Compared to the median income of $52,104 in 2000 this represents an increase of 41.6%. The per capita income in 2022 was $67,322, which means an increase of 51.6% compared to 2000 when it was $32,561.
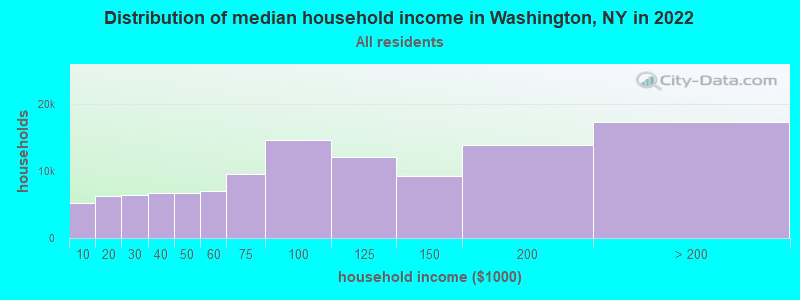
Income statistics for all residents
Median household income in Washington, NY in 2022:| Washington: | $89,208 |
| State: | $79,557 |
Change in median household income between 2000 and 2022:| Washington, New York: | +71.2% |
| State: | +83.3% |
Number of households with income < $10k:| Washington: | 4.5% (5,221) |
| State: | 6.8% (527,598) |
Number of households with income $10k - 20k:| Washington: | 5.4% (6,253) |
| State: | 7.4% (574,940) |
Number of households with income $20k - 30k:| Washington: | 5.5% (6,365) |
| State: | 6.7% (517,718) |
Number of households with income $30k - 40k:| Washington: | 5.9% (6,773) |
| New York: | 6.5% (506,674) |
Number of households with income $40k - 50k:| Washington: | 5.9% (6,761) |
| New York: | 6.1% (470,439) |
Number of households with income $50k - 60k:| Washington: | 6.0% (6,947) |
| State: | 5.8% (454,042) |
Number of households with income $60k - 75k:| Washington: | 8.4% (9,606) |
| New York: | 8.5% (657,508) |
Number of households with income $75k - 100k:| Washington: | 12.7% (14,619) |
| New York: | 11.6% (899,824) |
Number of households with income $100k - 125k:| Washington: | 10.5% (12,026) |
| State: | 9.3% (723,825) |
Number of households with income $125k - 150k:| Washington: | 8.0% (9,212) |
| State: | 7.1% (552,420) |
Number of households with income $150k - 200k:| Washington: | 12.0% (13,803) |
| New York: | 9.4% (727,051) |
Number of households with income > $200k:| Washington: | 15.0% (17,276) |
| New York: | 15.0% (1,162,269) |
Aggregate household income in Washington in 2022: $1,036,776,289
Median family income in Washington in 2022:| Washington: | $125,891 |
| State: | $99,066 |
Median non-family income in Washington in 2022:| Washington: | $52,512 |
| State: | $50,181 |
Change in median non-family income between 2000 and 2022:| Washington, New York: | +77.3% |
| State: | +85.4% |
Median per capita income in Washington in 2022:| Washington: | $67,323 |
| State: | $47,421 |
Change in median per capita income between 2000 and 2022:| Washington, New York: | +106.8% |
| State: | +102.7% |
Income statistics for White residents
Median household income in Washington, NY in 2022:| Washington: | $93,467 |
| State: | $89,408 |
Change in median household income between 2000 and 2022:| Washington, New York: | +79.2% |
| State: | +85.5% |
Number of households with income < $10k:| Washington: | 3.4% (2,826) |
| State: | 4.8% (225,550) |
Number of households with income $10k - 20k:| Washington: | 3.8% (3,214) |
| State: | 6.1% (289,425) |
Number of households with income $20k - 30k:| Washington: | 4.5% (3,743) |
| New York: | 5.9% (280,254) |
Number of households with income $30k - 40k:| Washington: | 6.1% (5,172) |
| State: | 6.1% (288,263) |
Number of households with income $40k - 50k:| Washington: | 5.6% (4,708) |
| New York: | 5.9% (278,079) |
Number of households with income $50k - 60k:| Washington: | 5.4% (4,515) |
| State: | 5.7% (267,554) |
Number of households with income $60k - 75k:| Washington: | 8.5% (7,184) |
| New York: | 8.4% (398,344) |
Number of households with income $75k - 100k:| Washington: | 13.6% (11,425) |
| State: | 11.8% (554,841) |
Number of households with income $100k - 125k:| Washington: | 10.9% (9,139) |
| State: | 10.0% (469,794) |
Number of households with income $125k - 150k:| Washington: | 9.3% (7,839) |
| State: | 7.6% (360,467) |
Number of households with income $150k - 200k:| Washington: | 12.4% (10,401) |
| New York: | 10.1% (477,078) |
Number of households with income > $200k:| Washington: | 16.6% (13,944) |
| State: | 17.6% (829,233) |
Aggregate household income in Washington in 2022: $818,731,642
Median family income in Washington in 2022:| Washington: | $132,618 |
| New York: | $115,170 |
Number of families with income < $10k:| Washington: | 0.8% (12) |
| State: | 2.5% (68,851) |
Number of families with income $10k - 20k:| Washington: | 0.8% (13) |
| State: | 3.0% (83,127) |
Number of families with income $20k - 30k:| Washington: | 1.9% (29) |
| State: | 3.5% (97,578) |
Number of families with income $30k - 40k:| Washington: | 2.4% (36) |
| State: | 4.1% (114,108) |
Number of families with income $40k - 50k:| Washington: | 2.4% (36) |
| State: | 4.7% (130,902) |
Number of families with income $50k - 60k:| Washington: | 2.7% (41) |
| State: | 4.9% (135,118) |
Number of families with income $60k - 75k:| Washington: | 4.1% (62) |
| State: | 7.8% (216,254) |
Number of families with income $75k - 100k:| Washington: | 9.1% (136) |
| New York: | 12.4% (342,382) |
Number of families with income $100k - 125k:| Washington: | 8.8% (132) |
| New York: | 11.4% (314,917) |
Number of families with income $125k - 150k:| Washington: | 10.3% (155) |
| State: | 9.4% (260,489) |
Number of families with income $150k - 200k:| Washington: | 10.3% (154) |
| New York: | 13.2% (365,586) |
Number of families with income > $200k:| Washington: | 46.4% (694) |
| State: | 23.2% (642,319) |
Median non-family income in Washington in 2022:| Washington: | $56,785 |
| State: | $54,783 |
Change in median non-family income between 2000 and 2022:| Washington, New York: | +87.5% |
| New York: | +87.9% |
Median per capita income in Washington in 2022:| Washington: | $73,817 |
| State: | $57,640 |
Change in median per capita income between 2000 and 2022:| Washington, New York: | +119.7% |
| New York: | +111.6% |
Income statistics for Black or African American residents
Median household income in Washington, NY in 2022:| Washington: | $117,182 |
| New York: | $57,898 |
Change in median household income between 2000 and 2022:| Washington, New York: | +43.8% |
| New York: | +84.6% |
Number of households with income < $10k:| Washington: | 14.2% (3,437) |
| State: | 12.0% (128,500) |
Number of households with income $10k - 20k:| Washington: | 14.0% (3,405) |
| New York: | 10.0% (107,541) |
Number of households with income $20k - 30k:| Washington: | 8.2% (1,991) |
| State: | 8.4% (90,192) |
Number of households with income $30k - 40k:| Washington: | 7.4% (1,790) |
| State: | 7.4% (79,579) |
Number of households with income $40k - 50k:| Washington: | 5.7% (1,388) |
| New York: | 6.8% (72,491) |
Number of households with income $50k - 60k:| Washington: | 9.9% (2,402) |
| New York: | 6.7% (71,309) |
Number of households with income $60k - 75k:| Washington: | 12.7% (3,070) |
| State: | 8.9% (95,050) |
Number of households with income $75k - 100k:| Washington: | 7.3% (1,779) |
| State: | 11.5% (123,569) |
Number of households with income $100k - 125k:| Washington: | 8.4% (2,047) |
| New York: | 8.1% (86,632) |
Number of households with income $125k - 150k:| Washington: | 1.3% (323) |
| State: | 6.0% (64,788) |
Number of households with income $150k - 200k:| Washington: | 6.4% (1,562) |
| State: | 7.2% (76,644) |
Number of households with income > $200k:| Washington: | 4.4% (1,056) |
| State: | 7.0% (75,062) |
Aggregate household income in Washington in 2022: $4,062,499
Median family income in Washington in 2022:| Washington: | $117,532 |
| State: | $72,528 |
Number of families with income $20k - 30k:| Washington: | 4.0% (1) |
| State: | 7.0% (44,139) |
Number of families with income $30k - 40k:| Washington: | 9.0% (3) |
| New York: | 6.9% (43,353) |
Number of families with income $75k - 100k:| Washington: | 48.3% (15) |
| New York: | 12.6% (78,986) |
Number of families with income $100k - 125k:| Washington: | 38.7% (12) |
| New York: | 9.8% (61,670) |
Median non-family income in Washington in 2022:| Washington: | $31,706 |
| State: | $37,265 |
Change in median non-family income between 2000 and 2022:| Washington, New York: | +19.4% |
| New York: | +81.7% |
Median per capita income in Washington in 2022:| Washington: | $23,828 |
| State: | $31,947 |
Change in median per capita income between 2000 and 2022:| Washington, New York: | +82.9% |
| State: | +106.1% |
Income statistics for Asian residents
Median household income in Washington, NY in 2022:| Washington: | $170,709 |
| New York: | $89,947 |
Change in median household income between 2000 and 2022:| Washington, New York: | +99.9% |
| State: | +98.1% |
Number of households with income < $10k:| Washington: | 6.9% (40,002) |
| State: | 6.9% (42,537) |
Number of households with income $10k - 20k:| Washington: | 7.3% (42,088) |
| New York: | 7.3% (44,745) |
Number of households with income $20k - 30k:| Washington: | 6.2% (36,039) |
| New York: | 6.2% (38,249) |
Number of households with income $30k - 40k:| Washington: | 5.5% (31,970) |
| State: | 5.5% (33,993) |
Number of households with income $40k - 50k:| Washington: | 4.9% (28,060) |
| New York: | 4.8% (29,795) |
Number of households with income $50k - 60k:| Washington: | 5.2% (30,012) |
| New York: | 5.2% (32,100) |
Number of households with income $60k - 75k:| Washington: | 7.3% (41,934) |
| State: | 7.3% (44,615) |
Number of households with income $75k - 100k:| Washington: | 10.9% (62,702) |
| State: | 10.8% (66,687) |
Number of households with income $100k - 125k:| Washington: | 8.2% (47,110) |
| State: | 8.2% (50,233) |
Number of households with income $125k - 150k:| Washington: | 7.2% (41,627) |
| State: | 7.2% (44,299) |
Number of households with income $150k - 200k:| Washington: | 10.4% (59,890) |
| New York: | 10.4% (63,837) |
Number of households with income > $200k:| Washington: | 20.1% (116,225) |
| New York: | 20.1% (123,891) |
Aggregate household income in Washington in 2022: $1,943,256
Median family income in Washington in 2022:| Washington: | $171,697 |
| State: | $98,136 |
Median non-family income in Washington in 2022:| Washington: | $122,222 |
| State: | $63,573 |
Change in median non-family income between 2000 and 2022:| Washington, New York: | +61.9% |
| New York: | +101.1% |
Median per capita income in Washington in 2022:| Washington: | $52,989 |
| State: | $46,726 |
Change in median per capita income between 2000 and 2022:| Washington, New York: | +92.8% |
| State: | +126.6% |
Income statistics for Hispanic or Latino residents
Median household income in Washington, NY in 2022:| Washington: | $33,204 |
| State: | $60,468 |
Change in median household income between 2000 and 2022:| Washington, New York: | +26.5% |
| New York: | +98.3% |
Number of households with income < $10k:| Washington: | 6.7% (473) |
| New York: | 9.9% (127,185) |
Number of households with income $10k - 20k:| Washington: | 6.3% (443) |
| New York: | 10.7% (136,699) |
Number of households with income $20k - 30k:| Washington: | 12.1% (858) |
| New York: | 8.1% (102,991) |
Number of households with income $30k - 40k:| Washington: | 4.9% (348) |
| State: | 7.8% (100,149) |
Number of households with income $40k - 50k:| Washington: | 10.4% (739) |
| New York: | 6.9% (87,760) |
Number of households with income $50k - 60k:| Washington: | 10.2% (721) |
| State: | 6.3% (80,968) |
Number of households with income $60k - 75k:| Washington: | 3.7% (259) |
| New York: | 8.7% (110,631) |
Number of households with income $75k - 100k:| Washington: | 7.2% (510) |
| New York: | 11.2% (142,787) |
Number of households with income $100k - 125k:| Washington: | 12.8% (907) |
| New York: | 8.2% (104,850) |
Number of households with income $125k - 150k:| Washington: | 3.4% (243) |
| State: | 6.3% (80,274) |
Number of households with income $150k - 200k:| Washington: | 10.8% (764) |
| New York: | 7.4% (95,117) |
Number of households with income > $200k:| Washington: | 11.5% (816) |
| State: | 8.6% (109,514) |
Aggregate household income in Washington in 2022: $7,121,059
Median family income in Washington in 2022:| Washington: | $108,680 |
| State: | $68,770 |
Number of families with income < $10k:| Washington: | 2.9% (6) |
| State: | 6.9% (58,565) |
Number of families with income $10k - 20k:| Washington: | 0.5% (1) |
| State: | 7.0% (59,058) |
Number of families with income $20k - 30k:| Washington: | 10.7% (21) |
| State: | 8.0% (68,048) |
Number of families with income $30k - 40k:| Washington: | 2.9% (6) |
| State: | 8.4% (70,668) |
Number of families with income $40k - 50k:| Washington: | 4.5% (9) |
| New York: | 7.4% (62,941) |
Number of families with income $50k - 60k:| Washington: | 5.9% (12) |
| State: | 6.6% (55,592) |
Number of families with income $60k - 75k:| Washington: | 2.5% (5) |
| New York: | 9.3% (78,564) |
Number of families with income $75k - 100k:| Washington: | 5.8% (12) |
| New York: | 12.6% (106,685) |
Number of families with income $100k - 125k:| Washington: | 16.0% (32) |
| New York: | 9.4% (79,139) |
Number of families with income $125k - 150k:| Washington: | 5.0% (10) |
| New York: | 6.9% (58,255) |
Number of families with income $150k - 200k:| Washington: | 10.0% (20) |
| New York: | 8.3% (69,877) |
Number of families with income > $200k:| Washington: | 33.2% (66) |
| New York: | 9.3% (78,555) |
Median non-family income in Washington in 2022:| Washington: | $30,832 |
| State: | $34,000 |
Change in median non-family income between 2000 and 2022:| Washington, New York: | +59.1% |
| New York: | +93.9% |
Median per capita income in Washington in 2022:| Washington: | $23,767 |
| State: | $29,761 |
Change in median per capita income between 2000 and 2022:| Washington, New York: | +136.2% |
| State: | +132.7% |
Income statistics for American Indian and Alaska Native residents
Number of households with income < $10k:| Washington: | 8.6% (5,255) |
| New York: | 8.6% (3,559) |
Number of households with income $10k - 20k:| Washington: | 6.0% (3,638) |
| New York: | 5.9% (2,455) |
Number of households with income $20k - 30k:| Washington: | 8.2% (4,998) |
| State: | 8.2% (3,393) |
Number of households with income $30k - 40k:| Washington: | 11.9% (7,263) |
| New York: | 11.9% (4,918) |
Number of households with income $40k - 50k:| Washington: | 6.4% (3,928) |
| New York: | 6.5% (2,682) |
Number of households with income $50k - 60k:| Washington: | 6.0% (3,691) |
| State: | 6.1% (2,516) |
Number of households with income $60k - 75k:| Washington: | 9.9% (6,060) |
| State: | 10.0% (4,125) |
Number of households with income $75k - 100k:| Washington: | 13.4% (8,156) |
| State: | 13.3% (5,517) |
Number of households with income $100k - 125k:| Washington: | 8.4% (5,103) |
| State: | 8.4% (3,463) |
Number of households with income $125k - 150k:| Washington: | 7.0% (4,275) |
| State: | 7.0% (2,887) |
Number of households with income $150k - 200k:| Washington: | 10.0% (6,087) |
| State: | 9.9% (4,106) |
Number of households with income > $200k:| Washington: | 4.2% (2,578) |
| State: | 4.2% (1,744) |
Median per capita income in Washington in 2022:| Washington: | $55,014 |
| State: | $25,837 |
Change in median per capita income between 2000 and 2022:| Washington, New York: | +44.8% |
| New York: | +99.6% |
Income statistics for Multirace residents
Median household income in Washington, NY in 2022:| Washington: | $33,967 |
| State: | $73,557 |
Change in median household income between 2000 and 2022:| Washington, New York: | +87.4% |
| State: | +123.9% |
Number of households with income < $10k:| Washington: | 8.4% (318) |
| New York: | 8.9% (57,924) |
Number of households with income $10k - 20k:| Washington: | 8.8% (330) |
| State: | 8.7% (56,590) |
Number of households with income $20k - 30k:| Washington: | 10.9% (410) |
| State: | 7.1% (46,287) |
Number of households with income $30k - 40k:| Washington: | 4.6% (173) |
| State: | 6.9% (45,132) |
Number of households with income $40k - 50k:| Washington: | 5.3% (200) |
| New York: | 5.8% (37,946) |
Number of households with income $50k - 60k:| Washington: | 8.3% (312) |
| State: | 5.6% (36,410) |
Number of households with income $60k - 75k:| Washington: | 5.7% (215) |
| State: | 7.8% (50,819) |
Number of households with income $75k - 100k:| Washington: | 7.6% (286) |
| State: | 11.7% (76,024) |
Number of households with income $100k - 125k:| Washington: | 5.8% (217) |
| State: | 9.3% (60,635) |
Number of households with income $125k - 150k:| Washington: | 6.3% (236) |
| New York: | 6.2% (40,533) |
Number of households with income $150k - 200k:| Washington: | 15.4% (579) |
| State: | 8.6% (56,409) |
Number of households with income > $200k:| Washington: | 13.1% (495) |
| State: | 13.4% (87,442) |
Aggregate household income in Washington in 2022: $3,952,736
Median family income in Washington in 2022:| Washington: | $55,251 |
| State: | $85,788 |
Number of families with income $10k - 20k:| Washington: | 100.0% (15) |
| State: | 5.6% (22,512) |
Median non-family income in Washington in 2022:| Washington: | $33,868 |
| New York: | $46,403 |
Change in median non-family income between 2000 and 2022:| Washington, New York: | +125.8% |
| New York: | +113.6% |
Median per capita income in Washington in 2022:| Washington: | $26,042 |
| State: | $36,931 |
Income statistics for other residents
Number of households with income < $10k:| Washington: | 12.0% (3) |
| State: | 10.3% (69,252) |
Number of households with income $10k - 20k:| Washington: | 12.0% (3) |
| State: | 11.0% (73,890) |
Number of households with income $20k - 30k:| Washington: | 8.0% (2) |
| New York: | 8.8% (59,096) |
Number of households with income $30k - 40k:| Washington: | 8.0% (2) |
| State: | 8.1% (54,418) |
Number of households with income $40k - 50k:| Washington: | 8.0% (2) |
| State: | 7.3% (49,042) |
Number of households with income $50k - 60k:| Washington: | 4.0% (1) |
| New York: | 6.5% (43,945) |
Number of households with income $60k - 75k:| Washington: | 8.0% (2) |
| State: | 9.5% (64,087) |
Number of households with income $75k - 100k:| Washington: | 12.0% (3) |
| State: | 10.9% (73,094) |
Number of households with income $100k - 125k:| Washington: | 8.0% (2) |
| New York: | 7.9% (53,055) |
Number of households with income $125k - 150k:| Washington: | 4.0% (1) |
| New York: | 5.9% (39,446) |
Number of households with income $150k - 200k:| Washington: | 8.0% (2) |
| State: | 7.2% (48,653) |
Number of households with income > $200k:| Washington: | 8.0% (2) |
| State: | 6.6% (44,703) |
Aggregate household income in Washington in 2022: $1,293,245
Median non-family income in Washington in 2022:| Washington: | $54,828 |
| State: | $26,983 |
Change in median non-family income between 2000 and 2022:| Washington, New York: | +108.9% |
| State: | +66.4% |
Median per capita income in Washington in 2022:| Washington: | $20,091 |
| New York: | $26,975 |