The median household income in West Richland, WA in 2022 was $120,561, which was 24.3% greater than the median annual income of $91,306 across the entire state of Washington. Compared to the median income of $57,750 in 2000 this represents an increase of 52.1%. The per capita income in 2022 was $41,398, which means an increase of 45.7% compared to 2000 when it was $22,499.
Whole page based on the data from 2000 / 2022 when the population of West Richland, Washington was 8,385 / 16,964
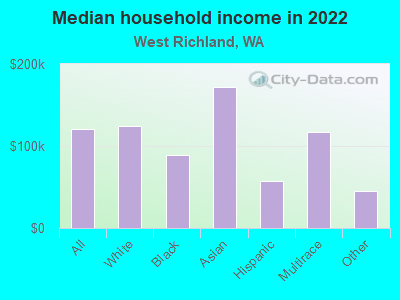
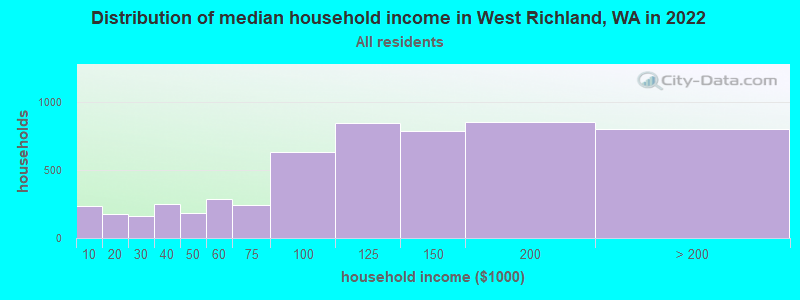
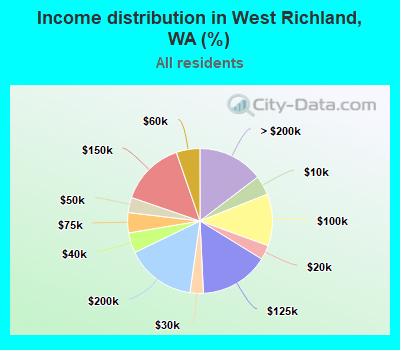
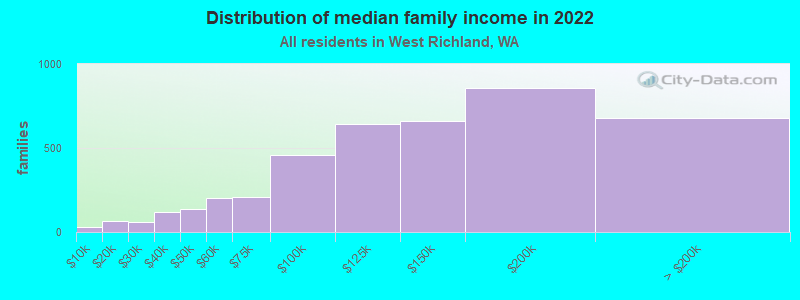
Income statistics for all residents
Median household income in West Richland, WA in 2022:
West Richland:
$120,561
Washington:
$91,306
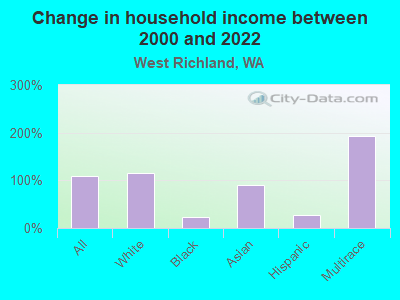
Change in median household income between 2000 and 2022:
West Richland, Washington:
+108.8%
State:
+99.5%
Number of households with income < $10k:
West Richland:
4.3% (236)
Washington:
4.5% (139,331)
Number of households with income $10k - 20k:
West Richland:
3.2% (177)
Washington:
5.0% (154,508)
Number of households with income $20k - 30k:
West Richland:
3.0% (163)
State:
5.4% (166,555)
Number of households with income $30k - 40k:
West Richland:
4.5% (247)
State:
5.5% (170,324)
Number of households with income $40k - 50k:
West Richland:
3.4% (185)
State:
6.0% (183,941)
Number of households with income $50k - 60k:
West Richland:
5.3% (288)
State:
6.1% (187,395)
Number of households with income $60k - 75k:
West Richland:
4.5% (246)
State:
8.7% (266,771)
Number of households with income $75k - 100k:
West Richland:
11.6% (632)
Washington:
13.1% (404,672)
Number of households with income $100k - 125k:
West Richland:
15.4% (843)
Washington:
11.0% (337,911)
Number of households with income $125k - 150k:
West Richland:
14.5% (789)
State:
8.0% (244,934)
Number of households with income $150k - 200k:
West Richland:
15.6% (852)
Washington:
10.5% (323,812)
Number of households with income > $200k:
West Richland:
14.7% (800)
Washington:
16.2% (499,799)
Aggregate household income in West Richland in 2022: $692,950,286
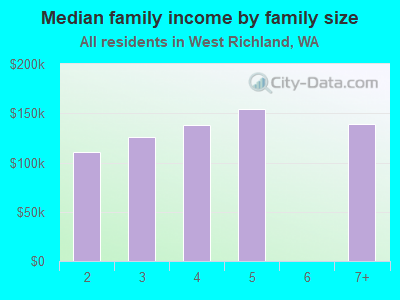
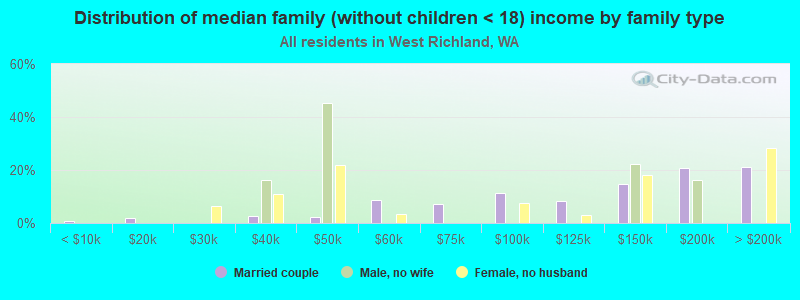
Median family income in West Richland in 2022:
West Richland:
$132,953
State:
$109,192
Number of families with income < $10k:
West Richland:
0.8% (32)
State:
2.9% (55,953)
Number of families with income $10k - 20k:
West Richland:
1.7% (68)
State:
2.6% (50,138)
Number of families with income $20k - 30k:
West Richland:
1.4% (59)
State:
3.2% (61,974)
Number of families with income $30k - 40k:
West Richland:
2.9% (118)
State:
4.1% (80,240)
Number of families with income $40k - 50k:
West Richland:
3.3% (136)
Washington:
4.9% (94,310)
Number of families with income $50k - 60k:
West Richland:
4.9% (201)
State:
5.3% (101,674)
Number of families with income $60k - 75k:
West Richland:
5.1% (209)
State:
8.2% (158,348)
Number of families with income $75k - 100k:
West Richland:
11.1% (456)
State:
13.8% (267,812)
Number of families with income $100k - 125k:
West Richland:
15.7% (644)
State:
12.4% (240,213)
Number of families with income $125k - 150k:
West Richland:
16.0% (659)
Washington:
9.3% (180,011)
Number of families with income $150k - 200k:
West Richland:
20.8% (855)
State:
13.0% (250,874)
Number of families with income > $200k:
West Richland:
16.4% (676)
State:
20.4% (393,898)
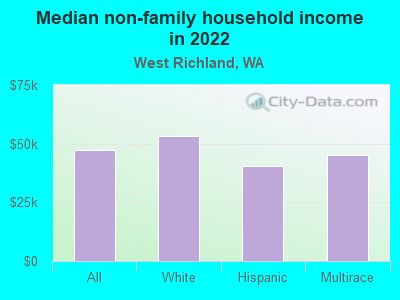
Median non-family income in West Richland in 2022:
West Richland:
$47,302
State:
$57,299
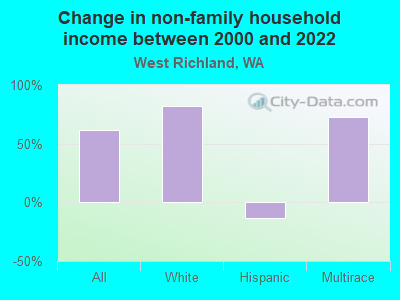
Change in median non-family income between 2000 and 2022:
West Richland, Washington:
+61.9%
State:
+94.9%
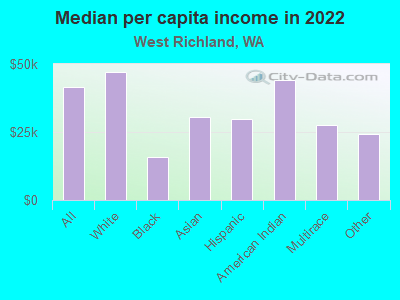
Median per capita income in West Richland in 2022:
West Richland:
$41,398
Washington:
$50,764
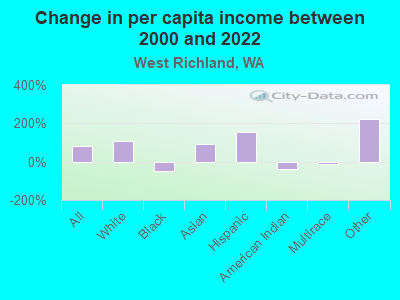
Change in median per capita income between 2000 and 2022:
West Richland, Washington:
+84.0%
State:
+121.0%
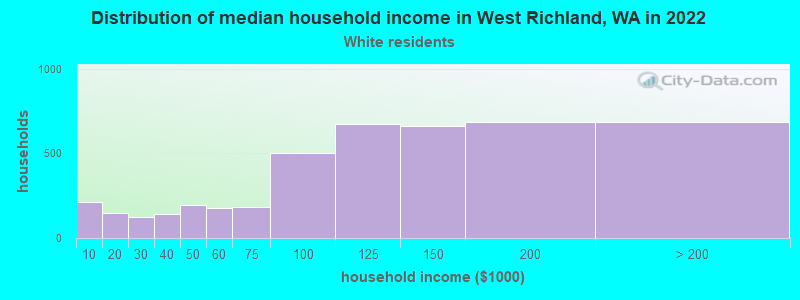
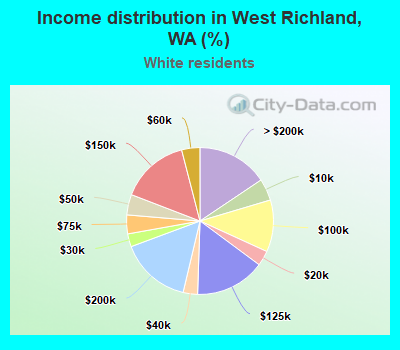
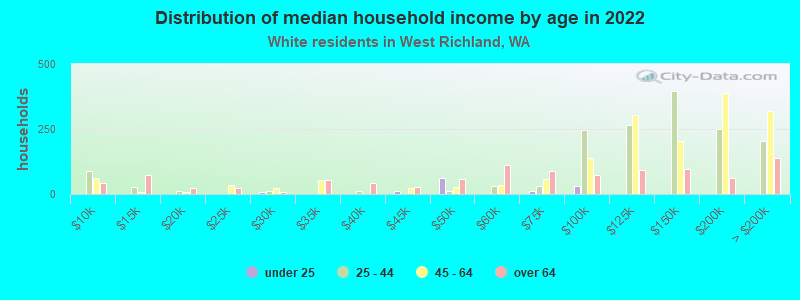
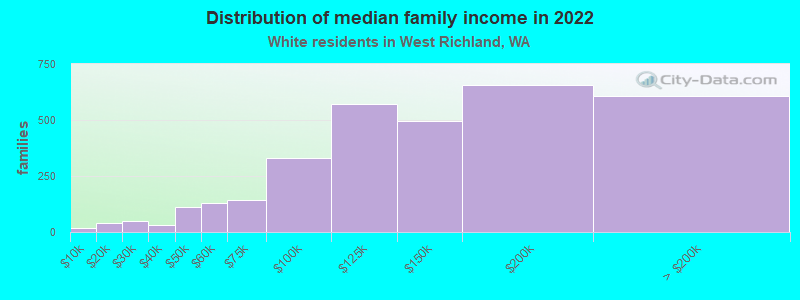
Income statistics for White residents
Median household income in West Richland, WA in 2022:
West Richland:
$124,620
Washington:
$91,916
Change in median household income between 2000 and 2022:
West Richland, Washington:
+116.5%
State:
+95.4%
Number of households with income < $10k:
West Richland:
4.8% (211)
State:
4.3% (95,850)
Number of households with income $10k - 20k:
West Richland:
3.3% (146)
State:
4.8% (106,421)
Number of households with income $20k - 30k:
West Richland:
2.8% (125)
State:
5.5% (122,860)
Number of households with income $30k - 40k:
West Richland:
3.2% (139)
State:
5.4% (119,627)
Number of households with income $40k - 50k:
West Richland:
4.5% (198)
State:
5.9% (132,276)
Number of households with income $50k - 60k:
West Richland:
4.0% (176)
State:
6.1% (136,212)
Number of households with income $60k - 75k:
West Richland:
4.1% (182)
State:
8.8% (196,086)
Number of households with income $75k - 100k:
West Richland:
11.4% (501)
Washington:
13.4% (299,192)
Number of households with income $100k - 125k:
West Richland:
15.4% (675)
State:
11.3% (252,209)
Number of households with income $125k - 150k:
West Richland:
15.1% (664)
State:
7.9% (175,962)
Number of households with income $150k - 200k:
West Richland:
15.6% (686)
State:
10.7% (239,156)
Number of households with income > $200k:
West Richland:
15.6% (684)
State:
16.1% (359,917)
Aggregate household income in West Richland in 2022: $565,569,715
Median family income in West Richland in 2022:
West Richland:
$134,866
State:
$112,511
Number of families with income < $10k:
West Richland:
0.6% (18)
State:
2.4% (33,676)
Number of families with income $10k - 20k:
West Richland:
1.3% (42)
State:
2.0% (28,228)
Number of families with income $20k - 30k:
West Richland:
1.6% (51)
State:
2.9% (39,288)
Number of families with income $30k - 40k:
West Richland:
1.0% (32)
Washington:
3.6% (50,190)
Number of families with income $40k - 50k:
West Richland:
3.5% (113)
State:
4.6% (63,009)
Number of families with income $50k - 60k:
West Richland:
4.1% (130)
State:
5.0% (69,270)
Number of families with income $60k - 75k:
West Richland:
4.5% (144)
Washington:
8.2% (112,369)
Number of families with income $75k - 100k:
West Richland:
10.4% (331)
Washington:
14.1% (194,214)
Number of families with income $100k - 125k:
West Richland:
17.9% (571)
State:
13.2% (182,184)
Number of families with income $125k - 150k:
West Richland:
15.5% (494)
State:
9.5% (130,928)
Number of families with income $150k - 200k:
West Richland:
20.5% (655)
State:
13.7% (188,621)
Number of families with income > $200k:
West Richland:
19.0% (607)
Washington:
20.8% (285,982)
Median non-family income in West Richland in 2022:
West Richland:
$53,383
State:
$56,103
Change in median non-family income between 2000 and 2022:
West Richland, Washington:
+81.7%
Washington:
+87.7%
Median per capita income in West Richland in 2022:
West Richland:
$47,073
State:
$55,212
Change in median per capita income between 2000 and 2022:
West Richland, Washington:
+107.4%
Washington:
+123.8%
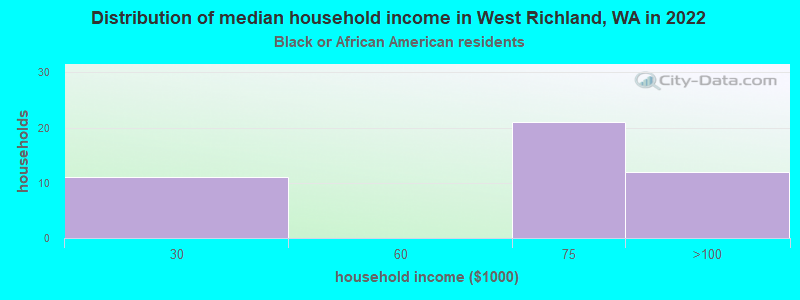
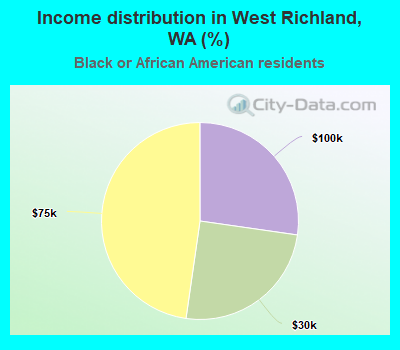
Income statistics for Black or African American residents
Median household income in West Richland, WA in 2022:
West Richland:
$89,105
State:
$68,202
Change in median household income between 2000 and 2022:
West Richland, Washington:
+23.4%
State:
+89.9%
Number of households with income < $10k:
West Richland:
0.0% (0)
State:
7.2% (8,014)
Number of households with income $10k - 20k:
West Richland:
0.0% (0)
Washington:
8.0% (8,904)
Number of households with income $20k - 30k:
West Richland:
25.0% (11)
State:
7.4% (8,207)
Number of households with income $30k - 40k:
West Richland:
0.0% (0)
State:
5.6% (6,220)
Number of households with income $40k - 50k:
West Richland:
0.0% (0)
Washington:
9.5% (10,585)
Number of households with income $50k - 60k:
West Richland:
0.0% (0)
State:
7.3% (8,078)
Number of households with income $60k - 75k:
West Richland:
47.7% (21)
State:
8.7% (9,704)
Number of households with income $75k - 100k:
West Richland:
27.3% (12)
State:
12.9% (14,315)
Number of households with income $100k - 125k:
West Richland:
0.0% (0)
State:
7.7% (8,592)
Number of households with income $125k - 150k:
West Richland:
0.0% (0)
Washington:
8.9% (9,840)
Number of households with income $150k - 200k:
West Richland:
0.0% (0)
State:
7.6% (8,434)
Number of households with income > $200k:
West Richland:
0.0% (0)
State:
9.1% (10,075)
Aggregate household income in West Richland in 2022: $3,899,727
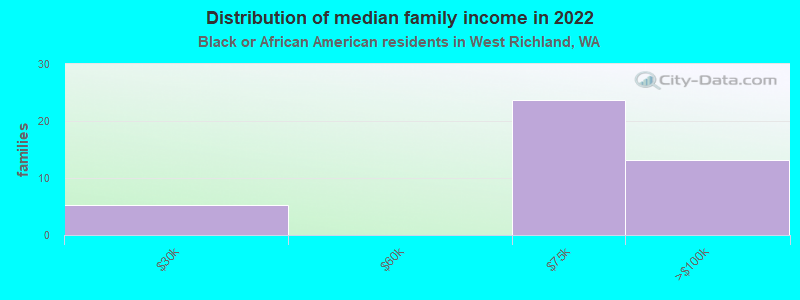
Median family income in West Richland in 2022:
West Richland:
$73,556
Washington:
$82,165
Number of families with income $20k - 30k:
West Richland:
12.6% (5)
State:
4.7% (3,151)
Number of families with income $60k - 75k:
West Richland:
56.1% (24)
State:
9.3% (6,231)
Number of families with income $75k - 100k:
West Richland:
31.3% (13)
Washington:
14.8% (9,876)
Median per capita income in West Richland in 2022:
West Richland:
$15,992
State:
$38,209
Change in median per capita income between 2000 and 2022:: -47.9%
West Richland, Washington:
-47.9%
Washington:
+115.3%
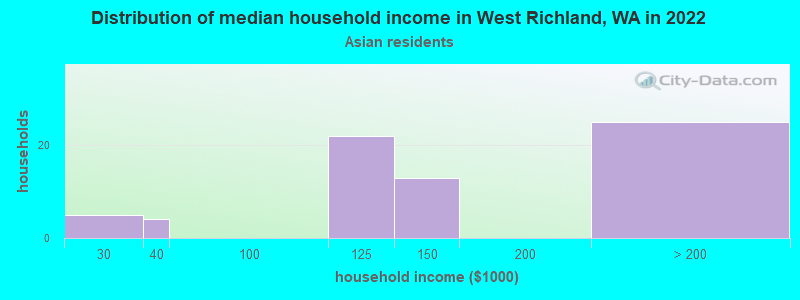
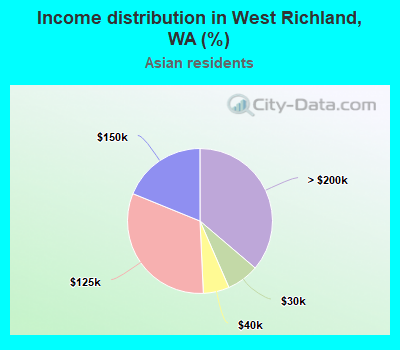
Income statistics for Asian residents
Median household income in West Richland, WA in 2022:
West Richland:
$172,548
Washington:
$125,692
Change in median household income between 2000 and 2022:
West Richland, Washington:
+91.0%
Washington:
+164.5%
Number of households with income < $10k:
West Richland:
0.0% (0)
Washington:
4.9% (14,099)
Number of households with income $10k - 20k:
West Richland:
0.0% (0)
State:
3.5% (9,873)
Number of households with income $20k - 30k:
West Richland:
7.2% (5)
Washington:
2.9% (8,352)
Number of households with income $30k - 40k:
West Richland:
5.8% (4)
Washington:
4.0% (11,415)
Number of households with income $40k - 50k:
West Richland:
0.0% (0)
State:
4.0% (11,421)
Number of households with income $50k - 60k:
West Richland:
0.0% (0)
State:
4.2% (12,100)
Number of households with income $60k - 75k:
West Richland:
0.0% (0)
State:
6.3% (17,903)
Number of households with income $75k - 100k:
West Richland:
0.0% (0)
State:
10.4% (29,663)
Number of households with income $100k - 125k:
West Richland:
31.9% (22)
Washington:
9.4% (26,839)
Number of households with income $125k - 150k:
West Richland:
18.8% (13)
State:
8.5% (24,200)
Number of households with income $150k - 200k:
West Richland:
0.0% (0)
State:
12.6% (35,976)
Number of households with income > $200k:
West Richland:
36.2% (25)
State:
29.2% (83,109)
Aggregate household income in West Richland in 2022: $7,732,386
Median per capita income in West Richland in 2022:
West Richland:
$30,582
State:
$67,666
Change in median per capita income between 2000 and 2022:
West Richland, Washington:
+90.1%
State:
+236.0%
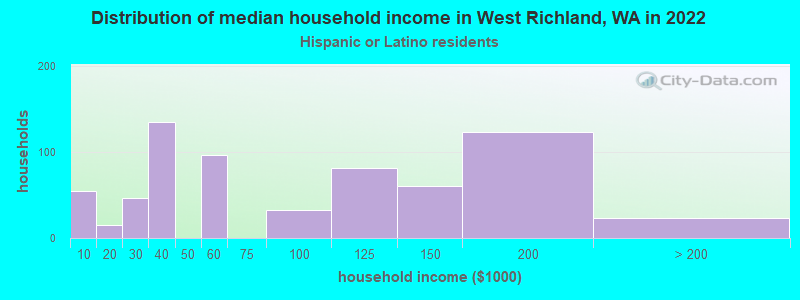
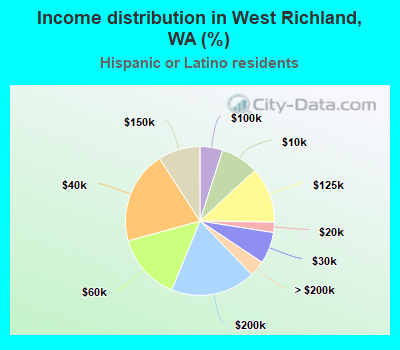
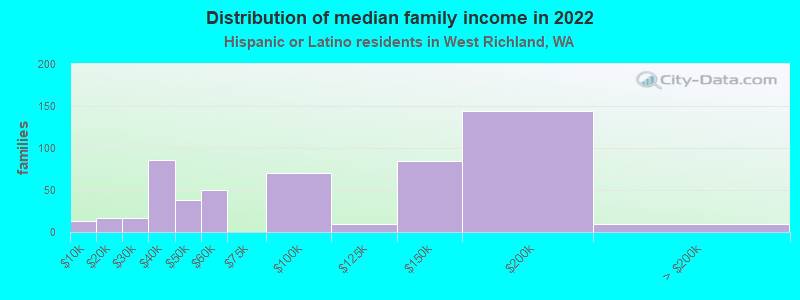
Income statistics for Hispanic or Latino residents
Median household income in West Richland, WA in 2022:
West Richland:
$57,896
State:
$74,770
Change in median household income between 2000 and 2022:
West Richland, Washington:
+27.6%
Washington:
+128.3%
Number of households with income < $10k:
West Richland:
8.2% (55)
Washington:
4.9% (14,456)
Number of households with income $10k - 20k:
West Richland:
2.2% (15)
Washington:
5.3% (15,449)
Number of households with income $20k - 30k:
West Richland:
6.9% (46)
State:
6.8% (20,016)
Number of households with income $30k - 40k:
West Richland:
20.2% (135)
State:
7.7% (22,548)
Number of households with income $40k - 50k:
West Richland:
0.0% (0)
State:
7.3% (21,450)
Number of households with income $50k - 60k:
West Richland:
14.5% (97)
Washington:
7.7% (22,744)
Number of households with income $60k - 75k:
West Richland:
0.0% (0)
Washington:
10.5% (30,737)
Number of households with income $75k - 100k:
West Richland:
4.9% (33)
State:
14.9% (43,843)
Number of households with income $100k - 125k:
West Richland:
12.1% (81)
State:
11.1% (32,554)
Number of households with income $125k - 150k:
West Richland:
9.1% (61)
State:
7.4% (21,624)
Number of households with income $150k - 200k:
West Richland:
18.4% (123)
State:
7.3% (21,360)
Number of households with income > $200k:
West Richland:
3.4% (23)
State:
9.2% (27,055)
Aggregate household income in West Richland in 2022: $60,004,835
Median family income in West Richland in 2022:
West Richland:
$62,063
Washington:
$76,866
Number of families with income < $10k:
West Richland:
2.3% (13)
Washington:
4.4% (9,443)
Number of families with income $10k - 20k:
West Richland:
3.1% (17)
State:
3.5% (7,524)
Number of families with income $20k - 30k:
West Richland:
3.1% (17)
Washington:
5.6% (12,052)
Number of families with income $30k - 40k:
West Richland:
16.1% (86)
State:
8.3% (17,803)
Number of families with income $40k - 50k:
West Richland:
7.1% (38)
State:
7.7% (16,361)
Number of families with income $50k - 60k:
West Richland:
9.3% (50)
State:
7.9% (16,852)
Number of families with income $75k - 100k:
West Richland:
13.0% (70)
Washington:
14.4% (30,698)
Number of families with income $100k - 125k:
West Richland:
1.6% (9)
State:
11.4% (24,331)
Number of families with income $125k - 150k:
West Richland:
15.9% (85)
Washington:
7.5% (16,099)
Number of families with income $150k - 200k:
West Richland:
26.7% (144)
Washington:
8.2% (17,551)
Number of families with income > $200k:
West Richland:
1.9% (10)
Washington:
9.7% (20,653)
Median non-family income in West Richland in 2022:
West Richland:
$40,378
State:
$54,173
Change in median non-family income between 2000 and 2022:: -13.4%
West Richland, Washington:
-13.4%
State:
+105.8%
Median per capita income in West Richland in 2022:
West Richland:
$29,598
State:
$28,252
Income statistics for American Indian and Alaska Native residents
Aggregate household income in West Richland in 2022: $10,606,507
Median per capita income in West Richland in 2022:
West Richland:
$44,090
State:
$27,053
Change in median per capita income between 2000 and 2022:: -37.0%
West Richland, Washington:
-37.0%
State:
+98.6%
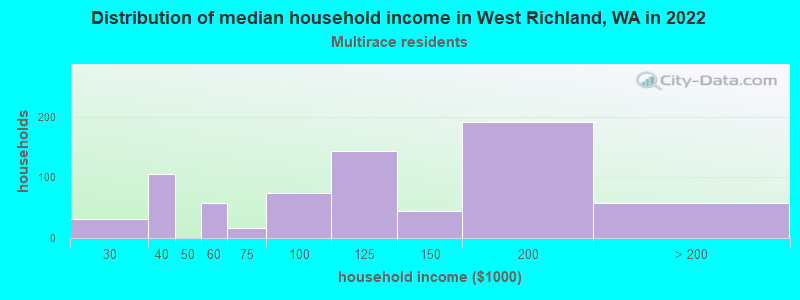
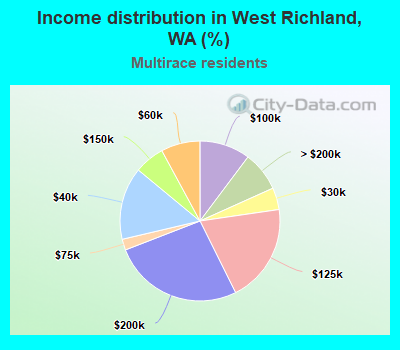
Income statistics for Multirace residents
Median household income in West Richland, WA in 2022:
West Richland:
$116,640
State:
$84,303
Number of households with income < $10k:
West Richland:
0.0% (0)
State:
4.3% (12,040)
Number of households with income $10k - 20k:
West Richland:
0.0% (0)
State:
6.6% (18,437)
Number of households with income $20k - 30k:
West Richland:
4.4% (32)
Washington:
5.2% (14,559)
Number of households with income $30k - 40k:
West Richland:
14.7% (106)
Washington:
6.7% (18,491)
Number of households with income $40k - 50k:
West Richland:
0.0% (0)
Washington:
6.3% (17,459)
Number of households with income $50k - 60k:
West Richland:
7.9% (57)
State:
6.9% (19,086)
Number of households with income $60k - 75k:
West Richland:
2.2% (16)
State:
9.1% (25,310)
Number of households with income $75k - 100k:
West Richland:
10.2% (74)
State:
13.5% (37,493)
Number of households with income $100k - 125k:
West Richland:
19.9% (144)
State:
10.7% (29,626)
Number of households with income $125k - 150k:
West Richland:
6.1% (44)
Washington:
8.6% (23,899)
Number of households with income $150k - 200k:
West Richland:
26.5% (191)
State:
10.2% (28,214)
Number of households with income > $200k:
West Richland:
8.0% (58)
State:
11.9% (32,947)
Aggregate household income in West Richland in 2022: $105,062,392
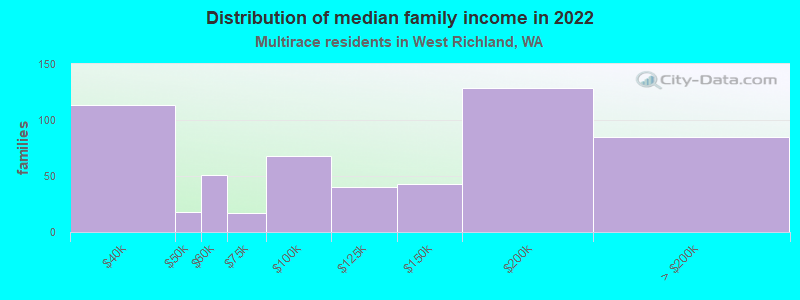
Median family income in West Richland in 2022:
West Richland:
$128,718
Washington:
$95,629
Number of families with income $30k - 40k:
West Richland:
20.1% (113)
State:
5.8% (10,186)
Number of families with income $40k - 50k:
West Richland:
3.2% (18)
State:
5.9% (10,412)
Number of families with income $50k - 60k:
West Richland:
9.1% (51)
Washington:
5.6% (9,922)
Number of families with income $60k - 75k:
West Richland:
3.0% (17)
Washington:
9.7% (17,113)
Number of families with income $75k - 100k:
West Richland:
12.1% (68)
State:
13.6% (23,984)
Number of families with income $100k - 125k:
West Richland:
7.1% (40)
Washington:
10.4% (18,288)
Number of families with income $125k - 150k:
West Richland:
7.6% (43)
State:
10.5% (18,481)
Number of families with income $150k - 200k:
West Richland:
22.9% (129)
Washington:
11.9% (20,852)
Number of families with income > $200k:
West Richland:
15.0% (85)
Washington:
14.4% (25,289)
Median non-family income in West Richland in 2022:
West Richland:
$45,241
Washington:
$56,573
Change in median non-family income between 2000 and 2022:
West Richland, Washington:
+72.3%
State:
+115.0%
Median per capita income in West Richland in 2022:
West Richland:
$27,569
State:
$32,496
Change in median per capita income between 2000 and 2022:: -11.1%
West Richland, Washington:
-11.1%
State:
+156.8%
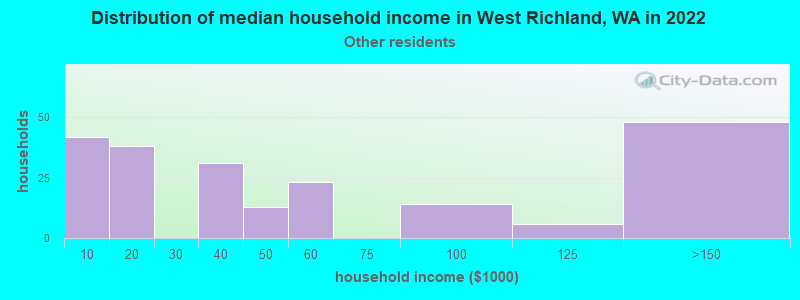
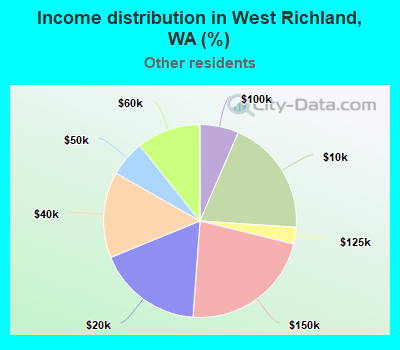
Income statistics for other residents
Median household income in West Richland, WA in 2022:
West Richland:
$44,620
Washington:
$69,545
Number of households with income < $10k:
West Richland:
19.5% (42)
State:
5.3% (6,540)
Number of households with income $10k - 20k:
West Richland:
17.7% (38)
Washington:
6.0% (7,385)
Number of households with income $20k - 30k:
West Richland:
0.0% (0)
State:
7.5% (9,289)
Number of households with income $30k - 40k:
West Richland:
14.4% (31)
Washington:
8.9% (11,015)
Number of households with income $40k - 50k:
West Richland:
6.0% (13)
Washington:
7.6% (9,399)
Number of households with income $50k - 60k:
West Richland:
10.7% (23)
State:
7.2% (8,867)
Number of households with income $60k - 75k:
West Richland:
0.0% (0)
State:
10.5% (13,032)
Number of households with income $75k - 100k:
West Richland:
6.5% (14)
Washington:
14.6% (18,007)
Number of households with income $100k - 125k:
West Richland:
2.8% (6)
Washington:
12.2% (15,128)
Number of households with income $125k - 150k:
West Richland:
22.3% (48)
Washington:
5.6% (6,950)
Number of households with income $150k - 200k:
West Richland:
0.0% (0)
State:
7.1% (8,749)
Number of households with income > $200k:
West Richland:
0.0% (0)
State:
7.5% (9,208)
Aggregate household income in West Richland in 2022: $15,695,494
Median per capita income in West Richland in 2022:
West Richland:
$24,336
State:
$27,542
Discuss West Richland, Washington (WA) on our hugely popular Washington forum.