The median household income in Westworth Village, TX in 2022 was $66,826, which was 8.2% less than the median annual income of $72,284 across the entire state of Texas. Compared to the median income of $40,493 in 2000 this represents an increase of 39.4%. The per capita income in 2022 was $33,873, which means an increase of 42.4% compared to 2000 when it was $19,495.
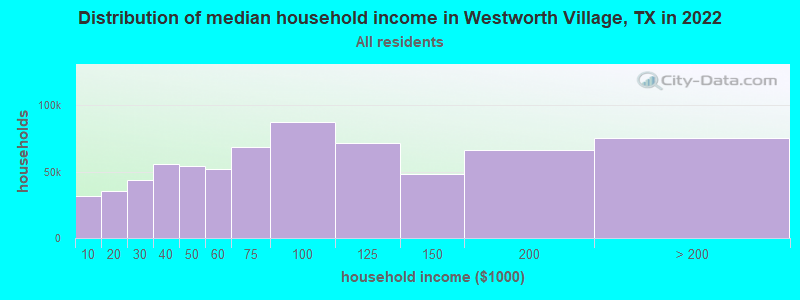
Income statistics for all residents
Median household income in Westworth Village, TX in 2022:
Westworth Village:
$66,826
State:
$72,284
Change in median household income between 2000 and 2022:
Westworth Village, Texas:
+65.0%
State:
+81.0%
Number of households with income < $10k:
Westworth Village:
4.6% (31,873)
State:
5.5% (611,011)
Number of households with income $10k - 20k:
Westworth Village:
5.1% (35,288)
State:
6.7% (743,157)
Number of households with income $20k - 30k:
Westworth Village:
6.3% (43,407)
Texas:
7.2% (803,381)
Number of households with income $30k - 40k:
Westworth Village:
8.1% (55,872)
Texas:
7.8% (866,080)
Number of households with income $40k - 50k:
Westworth Village:
7.8% (54,074)
State:
7.3% (810,440)
Number of households with income $50k - 60k:
Westworth Village:
7.5% (51,814)
State:
7.2% (799,783)
Number of households with income $60k - 75k:
Westworth Village:
10.0% (68,771)
Texas:
9.9% (1,095,384)
Number of households with income $75k - 100k:
Westworth Village:
12.7% (87,523)
State:
12.8% (1,419,057)
Number of households with income $100k - 125k:
Westworth Village:
10.4% (71,469)
State:
9.5% (1,054,577)
Number of households with income $125k - 150k:
Westworth Village:
7.0% (48,125)
State:
6.7% (741,518)
Number of households with income $150k - 200k:
Westworth Village:
9.7% (66,644)
State:
8.7% (961,776)
Number of households with income > $200k:
Westworth Village:
10.9% (75,308)
State:
10.7% (1,181,544)
Aggregate household income in Westworth Village in 2022: $1,584,980,174
Median family income in Westworth Village in 2022:
Westworth Village:
$83,503
State:
$86,267
Median non-family income in Westworth Village in 2022:
Westworth Village:
$40,304
State:
$45,999
Change in median non-family income between 2000 and 2022:
Westworth Village, Texas:
+53.5%
State:
+79.5%
Median per capita income in Westworth Village in 2022:
Westworth Village:
$33,873
Texas:
$38,123
Change in median per capita income between 2000 and 2022:
Westworth Village, Texas:
+73.8%
State:
+94.3%
Income statistics for White residents
Median household income in Westworth Village, TX in 2022:
Westworth Village:
$70,516
State:
$82,032
Change in median household income between 2000 and 2022:
Westworth Village, Texas:
+75.6%
State:
+91.0%
Number of households with income < $10k:
Westworth Village:
4.0% (13,521)
Texas:
4.7% (273,716)
Number of households with income $10k - 20k:
Westworth Village:
4.3% (14,624)
State:
5.5% (322,702)
Number of households with income $20k - 30k:
Westworth Village:
5.5% (18,665)
State:
6.2% (363,947)
Number of households with income $30k - 40k:
Westworth Village:
7.0% (23,548)
Texas:
6.8% (399,275)
Number of households with income $40k - 50k:
Westworth Village:
6.6% (22,281)
State:
6.5% (383,417)
Number of households with income $50k - 60k:
Westworth Village:
6.5% (21,921)
State:
6.6% (388,535)
Number of households with income $60k - 75k:
Westworth Village:
9.2% (31,205)
State:
9.7% (566,295)
Number of households with income $75k - 100k:
Westworth Village:
12.5% (42,343)
Texas:
13.0% (760,276)
Number of households with income $100k - 125k:
Westworth Village:
11.6% (39,250)
Texas:
10.2% (597,596)
Number of households with income $125k - 150k:
Westworth Village:
8.2% (27,663)
Texas:
7.4% (436,830)
Number of households with income $150k - 200k:
Westworth Village:
10.4% (35,051)
State:
9.9% (583,067)
Number of households with income > $200k:
Westworth Village:
14.3% (48,232)
Texas:
13.5% (792,647)
Aggregate household income in Westworth Village in 2022: $883,439,328
Median family income in Westworth Village in 2022:
Westworth Village:
$87,349
Texas:
$101,788
Number of families with income < $10k:
Westworth Village:
2.5% (9)
State:
2.8% (108,142)
Number of families with income $10k - 20k:
Westworth Village:
2.5% (9)
State:
2.9% (113,421)
Number of families with income $20k - 30k:
Westworth Village:
8.3% (29)
State:
4.1% (157,688)
Number of families with income $30k - 40k:
Westworth Village:
8.4% (30)
State:
5.2% (198,847)
Number of families with income $40k - 50k:
Westworth Village:
8.1% (29)
State:
5.6% (216,490)
Number of families with income $50k - 60k:
Westworth Village:
9.3% (33)
State:
5.7% (220,689)
Number of families with income $60k - 75k:
Westworth Village:
12.0% (42)
State:
9.0% (346,106)
Number of families with income $75k - 100k:
Westworth Village:
9.0% (32)
State:
13.7% (527,363)
Number of families with income $100k - 125k:
Westworth Village:
5.1% (18)
Texas:
11.6% (448,411)
Number of families with income $125k - 150k:
Westworth Village:
3.8% (13)
Texas:
9.2% (355,798)
Number of families with income $150k - 200k:
Westworth Village:
8.2% (29)
State:
12.5% (480,185)
Number of families with income > $200k:
Westworth Village:
22.8% (80)
Texas:
17.6% (677,490)
Median non-family income in Westworth Village in 2022:
Westworth Village:
$43,837
State:
$50,587
Change in median non-family income between 2000 and 2022:
Westworth Village, Texas:
+66.6%
State:
+87.7%
Median per capita income in Westworth Village in 2022:
Westworth Village:
$41,331
Texas:
$47,740
Change in median per capita income between 2000 and 2022:
Westworth Village, Texas:
+94.6%
Texas:
+114.3%
Income statistics for Black or African American residents
Median household income in Westworth Village, TX in 2022:
Westworth Village:
$88,948
State:
$55,759
Change in median household income between 2000 and 2022:
Westworth Village, Texas:
+83.4%
Texas:
+90.3%
Number of households with income < $10k:
Westworth Village:
7.1% (15,352)
State:
8.9% (126,378)
Number of households with income $10k - 20k:
Westworth Village:
8.3% (17,867)
State:
9.9% (140,369)
Number of households with income $20k - 30k:
Westworth Village:
7.0% (15,048)
State:
8.5% (120,639)
Number of households with income $30k - 40k:
Westworth Village:
10.9% (23,432)
Texas:
9.7% (137,517)
Number of households with income $40k - 50k:
Westworth Village:
9.4% (20,146)
State:
8.0% (112,973)
Number of households with income $50k - 60k:
Westworth Village:
8.3% (17,896)
Texas:
8.3% (117,156)
Number of households with income $60k - 75k:
Westworth Village:
10.1% (21,791)
Texas:
10.4% (147,462)
Number of households with income $75k - 100k:
Westworth Village:
13.0% (27,887)
State:
11.5% (162,718)
Number of households with income $100k - 125k:
Westworth Village:
6.8% (14,712)
State:
8.2% (115,829)
Number of households with income $125k - 150k:
Westworth Village:
4.9% (10,479)
State:
4.9% (69,556)
Number of households with income $150k - 200k:
Westworth Village:
9.4% (20,277)
State:
6.4% (90,701)
Number of households with income > $200k:
Westworth Village:
4.8% (10,438)
State:
5.5% (77,988)
Aggregate household income in Westworth Village in 2022: $7,874,070
Median family income in Westworth Village in 2022:
Westworth Village:
$95,203
Texas:
$69,134
Number of families with income < $10k:
Westworth Village:
4.1% (2)
State:
6.8% (55,625)
Number of families with income $20k - 30k:
Westworth Village:
8.7% (4)
Texas:
7.1% (57,877)
Number of families with income $30k - 40k:
Westworth Village:
8.5% (4)
State:
8.5% (68,776)
Number of families with income $40k - 50k:
Westworth Village:
22.1% (11)
Texas:
7.1% (57,907)
Number of families with income $50k - 60k:
Westworth Village:
14.2% (7)
Texas:
7.3% (59,511)
Number of families with income $60k - 75k:
Westworth Village:
29.9% (14)
State:
10.1% (81,994)
Number of families with income $75k - 100k:
Westworth Village:
12.6% (6)
State:
12.7% (103,723)
Median per capita income in Westworth Village in 2022:
Westworth Village:
$25,970
Texas:
$30,490
Change in median per capita income between 2000 and 2022:
Westworth Village, Texas:
+89.6%
State:
+113.9%
Income statistics for Asian residents
Median household income in Westworth Village, TX in 2022:
Westworth Village:
$42,491
State:
$107,673
Change in median household income between 2000 and 2022:
Westworth Village, Texas:
+104.8%
State:
+115.1%
Number of households with income < $10k:
Westworth Village:
5.2% (925)
State:
5.2% (29,885)
Number of households with income $10k - 20k:
Westworth Village:
7.1% (1,273)
State:
4.7% (27,044)
Number of households with income $20k - 30k:
Westworth Village:
5.6% (1,010)
State:
4.1% (23,363)
Number of households with income $30k - 40k:
Westworth Village:
4.7% (844)
Texas:
4.1% (23,309)
Number of households with income $40k - 50k:
Westworth Village:
5.1% (912)
Texas:
5.2% (29,826)
Number of households with income $50k - 60k:
Westworth Village:
5.0% (895)
State:
4.7% (26,512)
Number of households with income $60k - 75k:
Westworth Village:
6.6% (1,176)
State:
6.5% (36,905)
Number of households with income $75k - 100k:
Westworth Village:
11.0% (1,975)
State:
11.3% (64,350)
Number of households with income $100k - 125k:
Westworth Village:
15.5% (2,783)
Texas:
11.4% (64,714)
Number of households with income $125k - 150k:
Westworth Village:
7.4% (1,332)
State:
9.3% (52,719)
Number of households with income $150k - 200k:
Westworth Village:
11.0% (1,983)
Texas:
12.5% (70,953)
Number of households with income > $200k:
Westworth Village:
15.8% (2,838)
State:
21.1% (120,260)
Aggregate household income in Westworth Village in 2022: $677,300
Median non-family income in Westworth Village in 2022:
Westworth Village:
$30,672
State:
$64,320
Change in median non-family income between 2000 and 2022:
Westworth Village, Texas:
+47.8%
Texas:
+131.1%
Median per capita income in Westworth Village in 2022:
Westworth Village:
$33,583
State:
$48,626
Change in median per capita income between 2000 and 2022:
Westworth Village, Texas:
+112.0%
State:
+132.0%
Income statistics for Hispanic or Latino residents
Median household income in Westworth Village, TX in 2022:
Westworth Village:
$82,643
Texas:
$60,504
Change in median household income between 2000 and 2022:
Westworth Village, Texas:
+81.6%
State:
+102.5%
Number of households with income < $10k:
Westworth Village:
3.7% (8,661)
Texas:
5.8% (213,953)
Number of households with income $10k - 20k:
Westworth Village:
4.2% (9,949)
Texas:
8.0% (297,456)
Number of households with income $20k - 30k:
Westworth Village:
8.1% (18,992)
State:
9.2% (340,166)
Number of households with income $30k - 40k:
Westworth Village:
9.7% (22,794)
Texas:
9.5% (354,336)
Number of households with income $40k - 50k:
Westworth Village:
10.4% (24,604)
State:
8.8% (327,013)
Number of households with income $50k - 60k:
Westworth Village:
9.5% (22,401)
Texas:
8.3% (308,818)
Number of households with income $60k - 75k:
Westworth Village:
11.5% (27,023)
State:
10.9% (405,109)
Number of households with income $75k - 100k:
Westworth Village:
13.9% (32,763)
Texas:
13.8% (511,639)
Number of households with income $100k - 125k:
Westworth Village:
10.2% (24,112)
State:
8.6% (319,728)
Number of households with income $125k - 150k:
Westworth Village:
6.1% (14,412)
State:
5.7% (210,932)
Number of households with income $150k - 200k:
Westworth Village:
7.3% (17,182)
Texas:
6.4% (236,055)
Number of households with income > $200k:
Westworth Village:
5.4% (12,680)
Texas:
5.1% (189,259)
Aggregate household income in Westworth Village in 2022: $47,409,119
Median family income in Westworth Village in 2022:
Westworth Village:
$94,042
Texas:
$65,080
Number of families with income < $10k:
Westworth Village:
3.3% (7)
Texas:
5.3% (147,493)
Number of families with income $10k - 20k:
Westworth Village:
4.7% (10)
State:
6.3% (174,531)
Number of families with income $20k - 30k:
Westworth Village:
12.4% (26)
Texas:
8.6% (238,528)
Number of families with income $30k - 40k:
Westworth Village:
13.9% (30)
State:
9.1% (251,999)
Number of families with income $40k - 50k:
Westworth Village:
13.0% (28)
State:
8.6% (240,188)
Number of families with income $50k - 60k:
Westworth Village:
13.2% (28)
State:
8.0% (223,566)
Number of families with income $60k - 75k:
Westworth Village:
16.0% (34)
State:
10.9% (302,688)
Number of families with income $75k - 100k:
Westworth Village:
9.1% (20)
Texas:
14.3% (398,554)
Number of families with income $100k - 125k:
Westworth Village:
3.1% (7)
State:
9.5% (264,007)
Number of families with income $125k - 150k:
Westworth Village:
1.5% (3)
State:
6.2% (171,274)
Number of families with income $150k - 200k:
Westworth Village:
4.4% (10)
Texas:
7.3% (202,259)
Number of families with income > $200k:
Westworth Village:
5.5% (12)
State:
5.9% (165,129)
Median non-family income in Westworth Village in 2022:
Westworth Village:
$46,637
State:
$39,934
Change in median non-family income between 2000 and 2022:
Westworth Village, Texas:
+50.4%
State:
+109.1%
Median per capita income in Westworth Village in 2022:
Westworth Village:
$34,293
Texas:
$24,862
Change in median per capita income between 2000 and 2022:
Westworth Village, Texas:
+112.5%
State:
+130.8%
Income statistics for American Indian and Alaska Native residents
Median household income in Westworth Village, TX in 2022:
Westworth Village:
$129,749
Texas:
$65,765
Change in median household income between 2000 and 2022:
Westworth Village, Texas:
+120.8%
State:
+88.3%
Number of households with income < $10k:
Westworth Village:
4.1% (2,863)
State:
4.1% (3,398)
Number of households with income $10k - 20k:
Westworth Village:
8.3% (5,854)
State:
8.3% (6,949)
Number of households with income $20k - 30k:
Westworth Village:
9.3% (6,523)
State:
9.3% (7,742)
Number of households with income $30k - 40k:
Westworth Village:
9.1% (6,419)
State:
9.1% (7,627)
Number of households with income $40k - 50k:
Westworth Village:
7.1% (4,994)
State:
7.1% (5,922)
Number of households with income $50k - 60k:
Westworth Village:
8.1% (5,698)
State:
8.1% (6,761)
Number of households with income $60k - 75k:
Westworth Village:
12.7% (8,917)
Texas:
12.7% (10,588)
Number of households with income $75k - 100k:
Westworth Village:
13.0% (9,188)
State:
13.0% (10,903)
Number of households with income $100k - 125k:
Westworth Village:
9.9% (6,957)
Texas:
9.9% (8,256)
Number of households with income $125k - 150k:
Westworth Village:
5.2% (3,667)
Texas:
5.2% (4,355)
Number of households with income $150k - 200k:
Westworth Village:
6.7% (4,733)
State:
6.7% (5,623)
Number of households with income > $200k:
Westworth Village:
6.6% (4,646)
Texas:
6.6% (5,522)
Aggregate household income in Westworth Village in 2022: $1,478,746
Median family income in Westworth Village in 2022:
Westworth Village:
$116,739
State:
$72,369
Median non-family income in Westworth Village in 2022:
Westworth Village:
$125,755
State:
$40,351
Change in median non-family income between 2000 and 2022:
Westworth Village, Texas:
+99.2%
State:
+71.9%
Median per capita income in Westworth Village in 2022:
Westworth Village:
$40,646
State:
$28,166
Change in median per capita income between 2000 and 2022:
Westworth Village, Texas:
+108.2%
State:
+77.2%
Income statistics for Multirace residents
Median household income in Westworth Village, TX in 2022:
Westworth Village:
$38,736
Texas:
$62,748
Change in median household income between 2000 and 2022:
Westworth Village, Texas:
+75.4%
State:
+92.3%
Number of households with income < $10k:
Westworth Village:
3.2% (2,360)
Texas:
5.5% (122,324)
Number of households with income $10k - 20k:
Westworth Village:
3.9% (2,857)
Texas:
8.2% (182,232)
Number of households with income $20k - 30k:
Westworth Village:
7.1% (5,190)
State:
8.5% (189,456)
Number of households with income $30k - 40k:
Westworth Village:
10.0% (7,317)
State:
8.9% (197,499)
Number of households with income $40k - 50k:
Westworth Village:
8.8% (6,428)
Texas:
8.7% (191,735)
Number of households with income $50k - 60k:
Westworth Village:
10.4% (7,655)
Texas:
8.0% (177,535)
Number of households with income $60k - 75k:
Westworth Village:
12.6% (9,278)
State:
10.5% (232,479)
Number of households with income $75k - 100k:
Westworth Village:
12.6% (9,267)
State:
13.1% (290,448)
Number of households with income $100k - 125k:
Westworth Village:
8.9% (6,560)
State:
8.6% (191,595)
Number of households with income $125k - 150k:
Westworth Village:
6.0% (4,371)
State:
6.0% (133,361)
Number of households with income $150k - 200k:
Westworth Village:
8.9% (6,526)
State:
7.2% (159,195)
Number of households with income > $200k:
Westworth Village:
7.7% (5,639)
Texas:
6.7% (148,064)
Aggregate household income in Westworth Village in 2022: $8,187,921
Median family income in Westworth Village in 2022:
Westworth Village:
$55,822
State:
$69,780
Number of families with income < $10k:
Westworth Village:
23.9% (9)
Texas:
4.4% (70,825)
Number of families with income $10k - 20k:
Westworth Village:
17.0% (6)
State:
5.9% (95,279)
Number of families with income $40k - 50k:
Westworth Village:
59.1% (22)
State:
8.4% (135,809)
Median non-family income in Westworth Village in 2022:
Westworth Village:
$36,674
State:
$40,634
Change in median non-family income between 2000 and 2022:
Westworth Village, Texas:
+66.1%
Texas:
+77.2%
Median per capita income in Westworth Village in 2022:
Westworth Village:
$13,911
Texas:
$26,785
Change in median per capita income between 2000 and 2022:
Westworth Village, Texas:
+97.2%
State:
+110.9%
Income statistics for other residents
Number of households with income < $10k:
Westworth Village:
5.7% (3)
Texas:
5.9% (54,162)
Number of households with income $10k - 20k:
Westworth Village:
3.8% (2)
Texas:
6.8% (62,891)
Number of households with income $20k - 30k:
Westworth Village:
9.4% (5)
Texas:
10.6% (97,294)
Number of households with income $30k - 40k:
Westworth Village:
9.4% (5)
State:
10.8% (99,670)
Number of households with income $40k - 50k:
Westworth Village:
15.1% (8)
Texas:
9.3% (85,548)
Number of households with income $50k - 60k:
Westworth Village:
9.4% (5)
State:
9.0% (82,757)
Number of households with income $60k - 75k:
Westworth Village:
11.3% (6)
State:
10.9% (100,326)
Number of households with income $75k - 100k:
Westworth Village:
15.1% (8)
State:
14.0% (128,767)
Number of households with income $100k - 125k:
Westworth Village:
7.5% (4)
State:
8.2% (75,218)
Number of households with income $125k - 150k:
Westworth Village:
3.8% (2)
State:
4.8% (44,223)
Number of households with income $150k - 200k:
Westworth Village:
5.7% (3)
State:
5.6% (51,376)
Number of households with income > $200k:
Westworth Village:
3.8% (2)
State:
4.0% (36,393)
Aggregate household income in Westworth Village in 2022: $3,990,443
Median family income in Westworth Village in 2022:
Westworth Village:
$89,195
State:
$60,064
Number of families with income < $10k:
Westworth Village:
4.3% (2)
State:
6.8% (47,502)
Number of families with income $20k - 30k:
Westworth Village:
3.7% (1)
State:
9.9% (68,761)
Number of families with income $30k - 40k:
Westworth Village:
6.3% (2)
State:
9.7% (67,685)
Number of families with income $40k - 50k:
Westworth Village:
20.8% (8)
State:
9.0% (62,441)
Number of families with income $50k - 60k:
Westworth Village:
13.7% (5)
State:
8.5% (59,321)
Number of families with income $60k - 75k:
Westworth Village:
35.9% (14)
Texas:
11.2% (77,588)
Number of families with income $75k - 100k:
Westworth Village:
15.4% (6)
State:
14.5% (101,032)
Median non-family income in Westworth Village in 2022:
Westworth Village:
$51,195
State:
$38,690
Change in median non-family income between 2000 and 2022:
Westworth Village, Texas:
+41.2%
State:
+90.2%
Median per capita income in Westworth Village in 2022:
Westworth Village:
$28,901
State:
$23,899
Change in median per capita income between 2000 and 2022:
Westworth Village, Texas:
+122.2%
State:
+135.2%
Discuss Westworth Village, Texas (TX) on our hugely popular Texas forum.