The median household income in Wonder Lake, IL in 2022 was $78,877, which was 2.8% greater than the median annual income of $76,708 across the entire state of Illinois. Compared to the median income of $51,698 in 2000 this represents an increase of 34.5%. The per capita income in 2022 was $36,849, which means an increase of 42.1% compared to 2000 when it was $21,352.
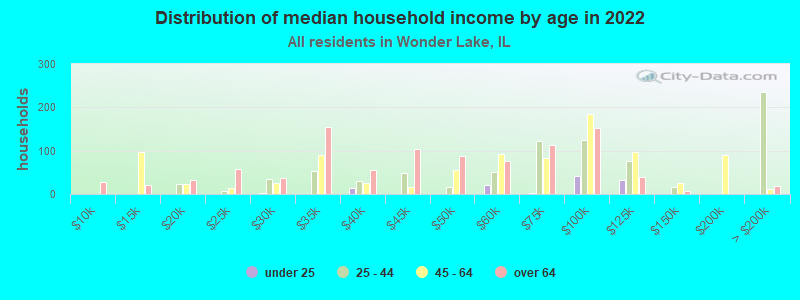
Income statistics for all residents
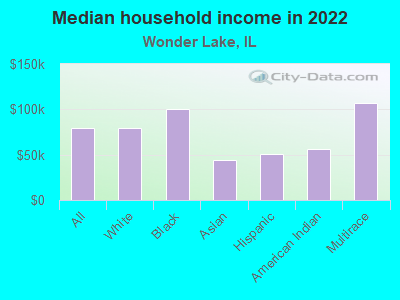
Median household income in Wonder Lake, IL in 2022:
Wonder Lake:
$78,877
Illinois:
$76,708
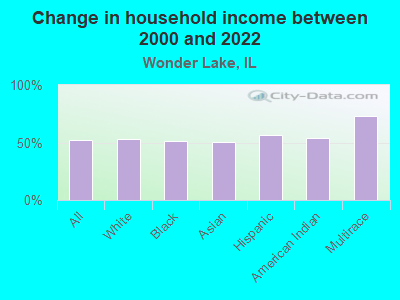
Change in median household income between 2000 and 2022:
Wonder Lake, Illinois:
+52.6%
Illinois:
+64.6%
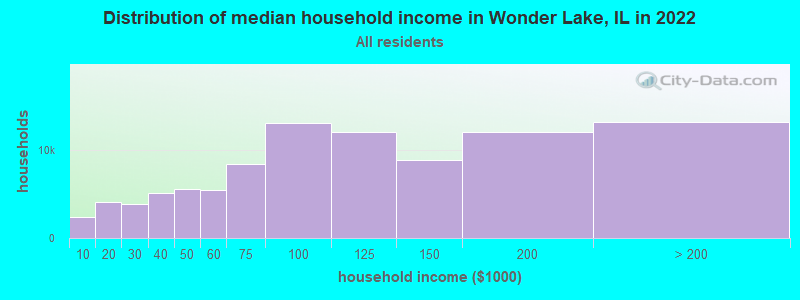
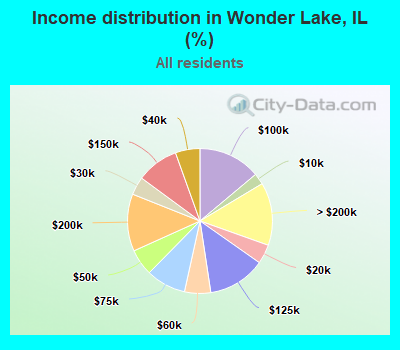
Number of households with income < $10k:
Wonder Lake:
2.5% (2,354)
Illinois:
5.9% (296,090)
Number of households with income $10k - 20k:
Wonder Lake:
4.3% (4,071)
State:
6.6% (333,259)
Number of households with income $20k - 30k:
Wonder Lake:
4.1% (3,829)
Illinois:
6.8% (342,921)
Number of households with income $30k - 40k:
Wonder Lake:
5.5% (5,171)
State:
7.0% (355,254)
Number of households with income $40k - 50k:
Wonder Lake:
5.9% (5,566)
Illinois:
6.7% (340,678)
Number of households with income $50k - 60k:
Wonder Lake:
5.8% (5,510)
State:
6.7% (339,405)
Number of households with income $60k - 75k:
Wonder Lake:
8.9% (8,395)
Illinois:
9.2% (465,709)
Number of households with income $75k - 100k:
Wonder Lake:
13.9% (13,125)
State:
12.9% (651,353)
Number of households with income $100k - 125k:
Wonder Lake:
12.9% (12,132)
Illinois:
10.3% (522,359)
Number of households with income $125k - 150k:
Wonder Lake:
9.4% (8,886)
State:
7.3% (367,136)
Number of households with income $150k - 200k:
Wonder Lake:
12.8% (12,062)
State:
9.0% (455,249)
Number of households with income > $200k:
Wonder Lake:
14.0% (13,232)
Illinois:
11.6% (586,947)
Aggregate household income in Wonder Lake in 2022: $1,047,162,215
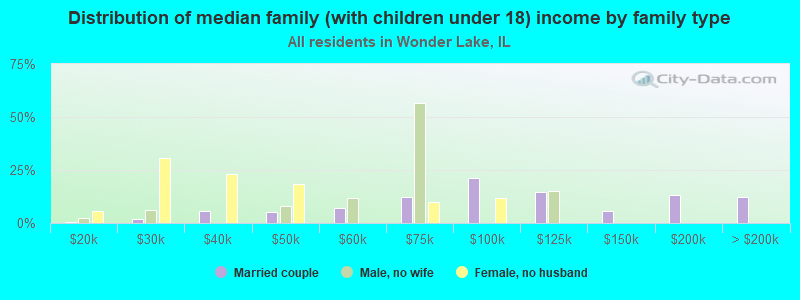
Median family income in Wonder Lake in 2022:
Wonder Lake:
$93,019
Illinois:
$96,948
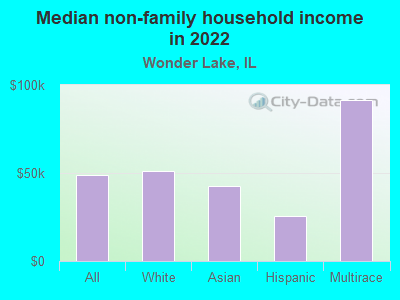
Median non-family income in Wonder Lake in 2022:
Wonder Lake:
$49,063
Illinois:
$46,533
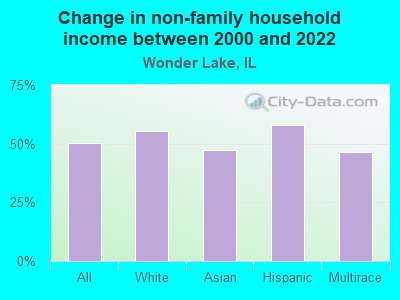
Change in median non-family income between 2000 and 2022:
Wonder Lake, Illinois:
+50.2%
State:
+64.0%
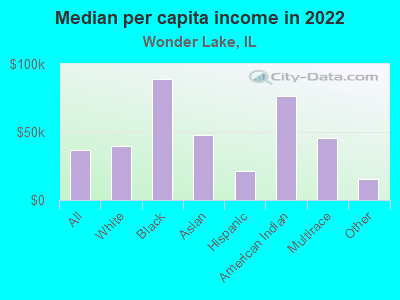
Median per capita income in Wonder Lake in 2022:
Wonder Lake:
$36,850
State:
$43,317
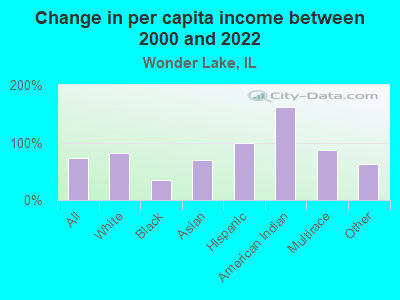
Change in median per capita income between 2000 and 2022:
Wonder Lake, Illinois:
+72.6%
Illinois:
+87.5%
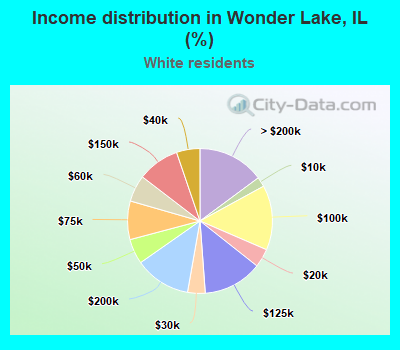
Income statistics for White residents
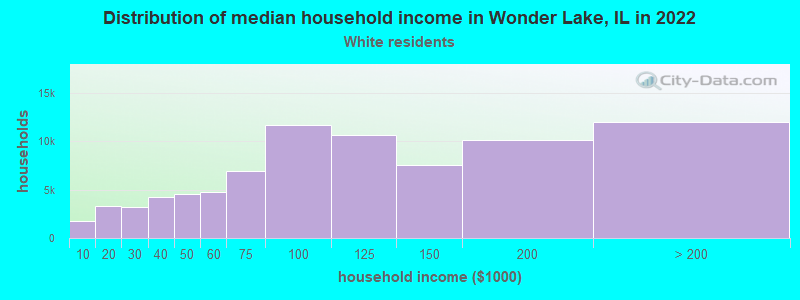
Median household income in Wonder Lake, IL in 2022:
Wonder Lake:
$79,524
State:
$83,346
Change in median household income between 2000 and 2022:
Wonder Lake, Illinois:
+53.1%
State:
+67.5%
Number of households with income < $10k:
Wonder Lake:
2.2% (1,752)
State:
4.5% (149,895)
Number of households with income $10k - 20k:
Wonder Lake:
4.2% (3,352)
State:
5.5% (184,529)
Number of households with income $20k - 30k:
Wonder Lake:
3.9% (3,174)
State:
6.1% (205,767)
Number of households with income $30k - 40k:
Wonder Lake:
5.2% (4,218)
Illinois:
6.7% (225,572)
Number of households with income $40k - 50k:
Wonder Lake:
5.6% (4,507)
State:
6.5% (216,965)
Number of households with income $50k - 60k:
Wonder Lake:
6.0% (4,802)
State:
6.6% (222,841)
Number of households with income $60k - 75k:
Wonder Lake:
8.6% (6,922)
State:
9.3% (312,758)
Number of households with income $75k - 100k:
Wonder Lake:
14.5% (11,651)
State:
12.9% (433,180)
Number of households with income $100k - 125k:
Wonder Lake:
13.2% (10,626)
State:
10.7% (360,753)
Number of households with income $125k - 150k:
Wonder Lake:
9.4% (7,539)
State:
7.9% (266,532)
Number of households with income $150k - 200k:
Wonder Lake:
12.5% (10,079)
State:
10.0% (337,357)
Number of households with income > $200k:
Wonder Lake:
14.9% (11,980)
State:
13.3% (446,069)
Aggregate household income in Wonder Lake in 2022: $882,172,595
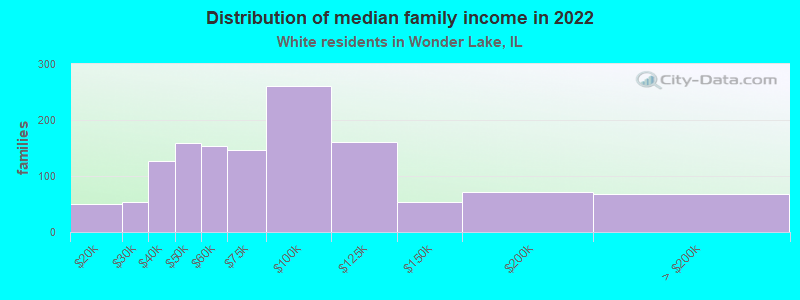
Median family income in Wonder Lake in 2022:
Wonder Lake:
$93,864
State:
$107,938
Number of families with income $10k - 20k:
Wonder Lake:
3.8% (50)
State:
2.5% (50,574)
Number of families with income $20k - 30k:
Wonder Lake:
4.1% (54)
State:
3.5% (70,927)
Number of families with income $30k - 40k:
Wonder Lake:
9.7% (127)
Illinois:
4.4% (90,563)
Number of families with income $40k - 50k:
Wonder Lake:
12.2% (159)
State:
5.0% (102,597)
Number of families with income $50k - 60k:
Wonder Lake:
11.8% (153)
Illinois:
5.8% (119,129)
Number of families with income $60k - 75k:
Wonder Lake:
11.2% (146)
State:
8.8% (179,665)
Number of families with income $75k - 100k:
Wonder Lake:
20.0% (260)
State:
13.5% (276,887)
Number of families with income $100k - 125k:
Wonder Lake:
12.4% (161)
State:
12.5% (256,099)
Number of families with income $125k - 150k:
Wonder Lake:
4.1% (53)
State:
9.8% (199,855)
Number of families with income $150k - 200k:
Wonder Lake:
5.5% (71)
State:
13.4% (274,569)
Number of families with income > $200k:
Wonder Lake:
5.1% (67)
State:
18.6% (381,354)
Median non-family income in Wonder Lake in 2022:
Wonder Lake:
$51,363
State:
$50,934
Change in median non-family income between 2000 and 2022:
Wonder Lake, Illinois:
+55.4%
State:
+70.7%
Median per capita income in Wonder Lake in 2022:
Wonder Lake:
$39,493
State:
$50,738
Change in median per capita income between 2000 and 2022:
Wonder Lake, Illinois:
+82.3%
State:
+95.5%
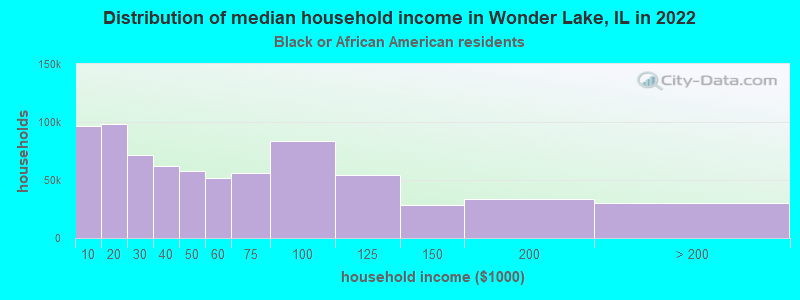
Income statistics for Black or African American residents
Median household income in Wonder Lake, IL in 2022:
Wonder Lake:
$100,483
State:
$45,019
Change in median household income between 2000 and 2022:
Wonder Lake, Illinois:
+51.7%
State:
+42.0%
Number of households with income < $10k:
Wonder Lake:
13.3% (96,381)
State:
13.3% (92,224)
Number of households with income $10k - 20k:
Wonder Lake:
13.5% (97,971)
Illinois:
13.5% (93,732)
Number of households with income $20k - 30k:
Wonder Lake:
9.9% (71,538)
State:
9.9% (68,453)
Number of households with income $30k - 40k:
Wonder Lake:
8.5% (61,726)
Illinois:
8.5% (59,072)
Number of households with income $40k - 50k:
Wonder Lake:
8.0% (57,529)
State:
7.9% (55,033)
Number of households with income $50k - 60k:
Wonder Lake:
7.2% (51,797)
State:
7.2% (49,556)
Number of households with income $60k - 75k:
Wonder Lake:
7.8% (56,142)
Illinois:
7.8% (53,726)
Number of households with income $75k - 100k:
Wonder Lake:
11.6% (84,037)
State:
11.6% (80,439)
Number of households with income $100k - 125k:
Wonder Lake:
7.5% (54,608)
State:
7.5% (52,244)
Number of households with income $125k - 150k:
Wonder Lake:
3.9% (28,284)
State:
3.9% (27,058)
Number of households with income $150k - 200k:
Wonder Lake:
4.6% (33,524)
State:
4.6% (32,057)
Number of households with income > $200k:
Wonder Lake:
4.1% (30,023)
State:
4.1% (28,731)
Aggregate household income in Wonder Lake in 2022: $382,465
Median family income in Wonder Lake in 2022:
Wonder Lake:
$120,323
Illinois:
$60,661
Median per capita income in Wonder Lake in 2022:
Wonder Lake:
$88,956
Illinois:
$28,045
Change in median per capita income between 2000 and 2022:
Wonder Lake, Illinois:
+34.8%
State:
+90.2%
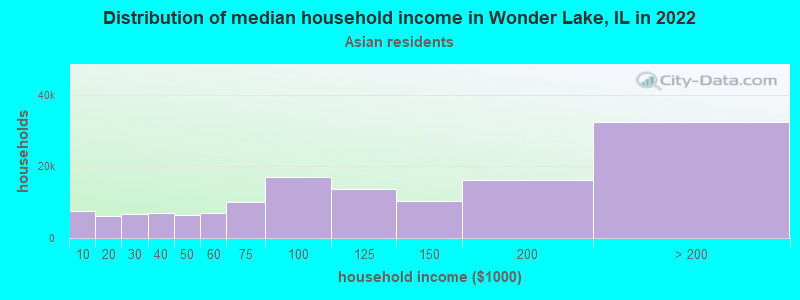
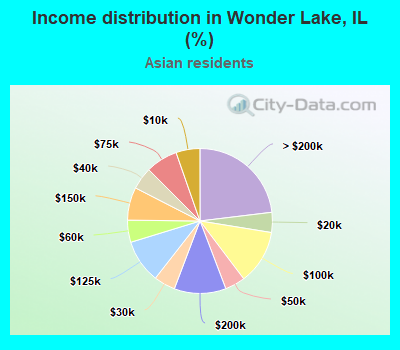
Income statistics for Asian residents
Median household income in Wonder Lake, IL in 2022:
Wonder Lake:
$44,148
Illinois:
$104,287
Change in median household income between 2000 and 2022:
Wonder Lake, Illinois:
+50.6%
Illinois:
+81.9%
Number of households with income < $10k:
Wonder Lake:
5.3% (7,493)
State:
5.3% (14,653)
Number of households with income $10k - 20k:
Wonder Lake:
4.5% (6,281)
State:
4.5% (12,283)
Number of households with income $20k - 30k:
Wonder Lake:
4.8% (6,717)
Illinois:
4.8% (13,135)
Number of households with income $30k - 40k:
Wonder Lake:
5.0% (6,983)
State:
5.0% (13,655)
Number of households with income $40k - 50k:
Wonder Lake:
4.5% (6,319)
State:
4.5% (12,357)
Number of households with income $50k - 60k:
Wonder Lake:
4.9% (6,938)
State:
4.9% (13,568)
Number of households with income $60k - 75k:
Wonder Lake:
7.1% (10,026)
State:
7.1% (19,606)
Number of households with income $75k - 100k:
Wonder Lake:
12.1% (17,053)
State:
12.1% (33,349)
Number of households with income $100k - 125k:
Wonder Lake:
9.7% (13,638)
Illinois:
9.7% (26,669)
Number of households with income $125k - 150k:
Wonder Lake:
7.3% (10,315)
State:
7.3% (20,172)
Number of households with income $150k - 200k:
Wonder Lake:
11.5% (16,216)
State:
11.5% (31,711)
Number of households with income > $200k:
Wonder Lake:
23.1% (32,426)
State:
23.1% (63,411)
Aggregate household income in Wonder Lake in 2022: $4,700,050
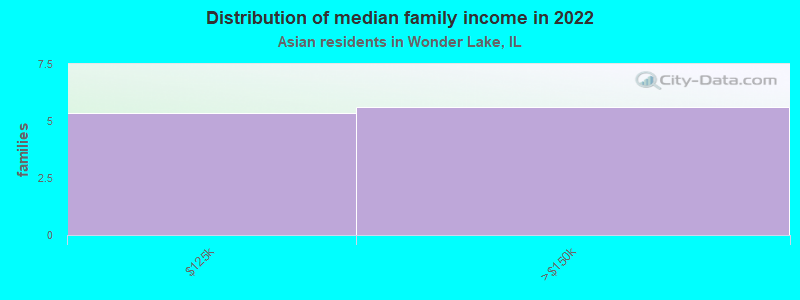
Median family income in Wonder Lake in 2022:
Wonder Lake:
$197,857
State:
$124,630
Median non-family income in Wonder Lake in 2022:
Wonder Lake:
$42,356
State:
$57,292
Change in median non-family income between 2000 and 2022:
Wonder Lake, Illinois:
+47.3%
State:
+78.3%
Median per capita income in Wonder Lake in 2022:
Wonder Lake:
$48,066
State:
$52,977
Change in median per capita income between 2000 and 2022:
Wonder Lake, Illinois:
+68.9%
State:
+119.5%
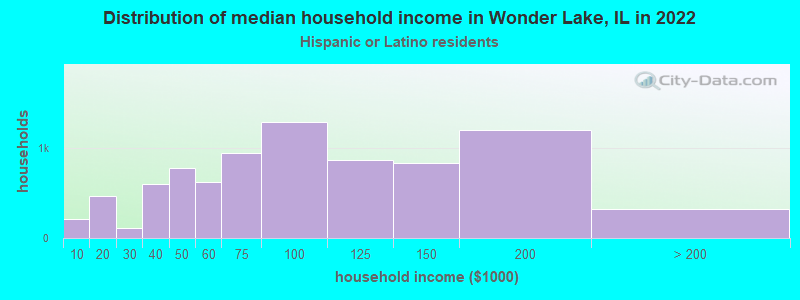
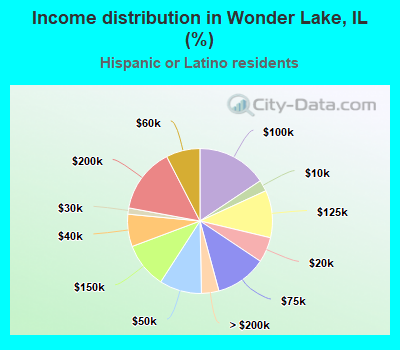
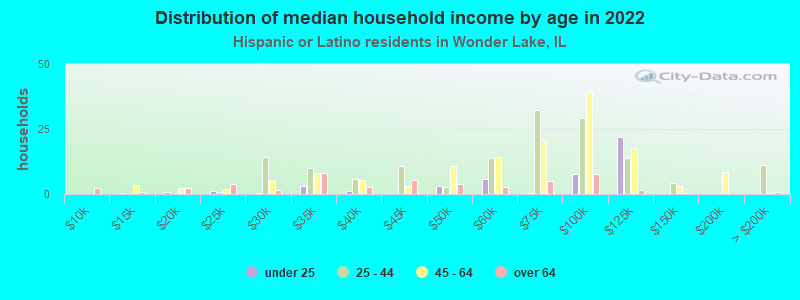
Income statistics for Hispanic or Latino residents
Median household income in Wonder Lake, IL in 2022:
Wonder Lake:
$50,732
State:
$72,139
Change in median household income between 2000 and 2022:
Wonder Lake, Illinois:
+56.9%
State:
+75.7%
Number of households with income < $10k:
Wonder Lake:
2.5% (207)
Illinois:
4.9% (33,145)
Number of households with income $10k - 20k:
Wonder Lake:
5.6% (467)
State:
5.4% (36,345)
Number of households with income $20k - 30k:
Wonder Lake:
1.4% (114)
Illinois:
7.5% (50,677)
Number of households with income $30k - 40k:
Wonder Lake:
7.2% (598)
State:
7.7% (52,008)
Number of households with income $40k - 50k:
Wonder Lake:
9.5% (782)
State:
8.1% (54,702)
Number of households with income $50k - 60k:
Wonder Lake:
7.6% (628)
State:
7.5% (51,062)
Number of households with income $60k - 75k:
Wonder Lake:
11.4% (946)
State:
11.3% (76,576)
Number of households with income $75k - 100k:
Wonder Lake:
15.6% (1,295)
Illinois:
15.5% (105,152)
Number of households with income $100k - 125k:
Wonder Lake:
10.6% (875)
State:
11.5% (77,760)
Number of households with income $125k - 150k:
Wonder Lake:
10.2% (841)
State:
7.3% (49,310)
Number of households with income $150k - 200k:
Wonder Lake:
14.5% (1,201)
State:
7.6% (51,233)
Number of households with income > $200k:
Wonder Lake:
3.9% (321)
Illinois:
5.9% (40,028)
Aggregate household income in Wonder Lake in 2022: $16,661,165
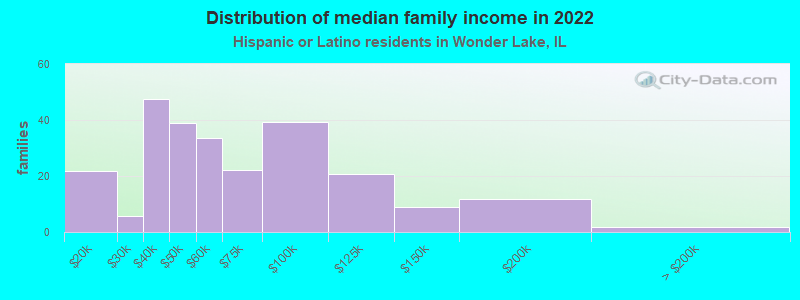
Median family income in Wonder Lake in 2022:
Wonder Lake:
$68,984
State:
$76,467
Number of families with income $10k - 20k:
Wonder Lake:
8.7% (22)
Illinois:
3.8% (19,314)
Number of families with income $20k - 30k:
Wonder Lake:
2.3% (6)
State:
6.8% (34,467)
Number of families with income $30k - 40k:
Wonder Lake:
18.8% (47)
State:
7.5% (37,976)
Number of families with income $40k - 50k:
Wonder Lake:
15.5% (39)
State:
7.7% (38,858)
Number of families with income $50k - 60k:
Wonder Lake:
13.3% (34)
State:
7.6% (38,606)
Number of families with income $60k - 75k:
Wonder Lake:
8.7% (22)
State:
11.5% (58,164)
Number of families with income $75k - 100k:
Wonder Lake:
15.6% (39)
Illinois:
16.0% (81,055)
Number of families with income $100k - 125k:
Wonder Lake:
8.2% (21)
State:
12.1% (61,491)
Number of families with income $125k - 150k:
Wonder Lake:
3.5% (9)
Illinois:
8.0% (40,271)
Number of families with income $150k - 200k:
Wonder Lake:
4.6% (12)
State:
8.6% (43,536)
Number of families with income > $200k:
Wonder Lake:
0.8% (2)
State:
6.6% (33,240)
Median non-family income in Wonder Lake in 2022:
Wonder Lake:
$25,693
State:
$45,965
Change in median non-family income between 2000 and 2022:
Wonder Lake, Illinois:
+58.1%
Illinois:
+75.9%
Median per capita income in Wonder Lake in 2022:
Wonder Lake:
$21,372
State:
$26,551
Change in median per capita income between 2000 and 2022:
Wonder Lake, Illinois:
+99.3%
State:
+111.0%
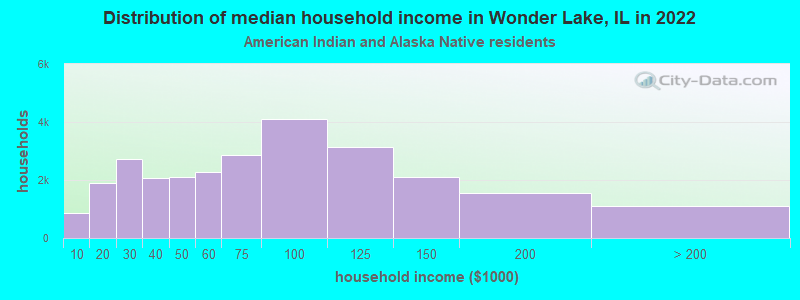
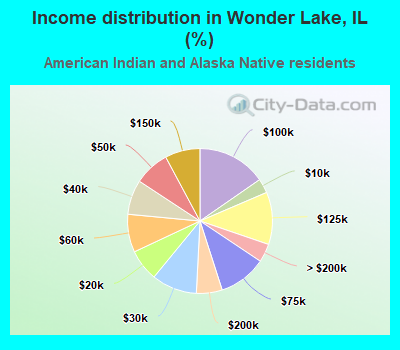
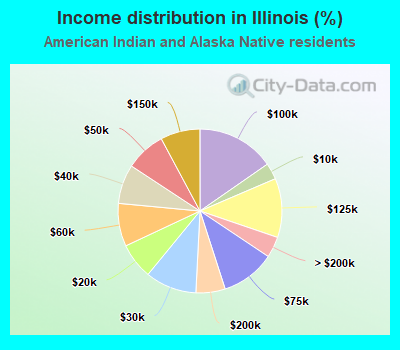
Income statistics for American Indian and Alaska Native residents
Median household income in Wonder Lake, IL in 2022:
Wonder Lake:
$55,714
Illinois:
$66,282
Change in median household income between 2000 and 2022:
Wonder Lake, Illinois:
+53.7%
State:
+68.5%
Number of households with income < $10k:
Wonder Lake:
3.2% (862)
State:
3.2% (935)
Number of households with income $10k - 20k:
Wonder Lake:
7.1% (1,892)
State:
7.1% (2,053)
Number of households with income $20k - 30k:
Wonder Lake:
10.1% (2,709)
State:
10.1% (2,939)
Number of households with income $30k - 40k:
Wonder Lake:
7.7% (2,070)
State:
7.7% (2,246)
Number of households with income $40k - 50k:
Wonder Lake:
7.9% (2,120)
State:
7.9% (2,300)
Number of households with income $50k - 60k:
Wonder Lake:
8.5% (2,267)
Illinois:
8.5% (2,460)
Number of households with income $60k - 75k:
Wonder Lake:
10.7% (2,853)
Illinois:
10.7% (3,095)
Number of households with income $75k - 100k:
Wonder Lake:
15.3% (4,103)
State:
15.3% (4,451)
Number of households with income $100k - 125k:
Wonder Lake:
11.7% (3,121)
State:
11.7% (3,386)
Number of households with income $125k - 150k:
Wonder Lake:
7.8% (2,091)
Illinois:
7.8% (2,269)
Number of households with income $150k - 200k:
Wonder Lake:
5.8% (1,542)
State:
5.8% (1,673)
Number of households with income > $200k:
Wonder Lake:
4.1% (1,104)
Illinois:
4.1% (1,198)
Aggregate household income in Wonder Lake in 2022: $234,839
Median family income in Wonder Lake in 2022:
Wonder Lake:
$76,747
State:
$73,202
Median per capita income in Wonder Lake in 2022:
Wonder Lake:
$76,571
Illinois:
$26,979
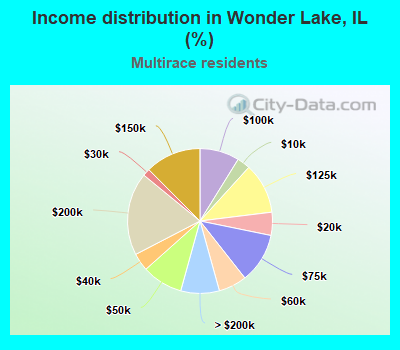
Income statistics for Multirace residents
Median household income in Wonder Lake, IL in 2022:
Wonder Lake:
$107,322
State:
$71,185
Change in median household income between 2000 and 2022:
Wonder Lake, Illinois:
+73.5%
State:
+81.4%
Number of households with income < $10k:
Wonder Lake:
2.9% (263)
Illinois:
5.3% (21,595)
Number of households with income $10k - 20k:
Wonder Lake:
5.2% (463)
State:
6.5% (26,720)
Number of households with income $20k - 30k:
Wonder Lake:
1.6% (146)
Illinois:
8.0% (32,573)
Number of households with income $30k - 40k:
Wonder Lake:
4.0% (355)
State:
8.4% (34,383)
Number of households with income $40k - 50k:
Wonder Lake:
9.1% (818)
State:
7.4% (30,234)
Number of households with income $50k - 60k:
Wonder Lake:
6.3% (565)
Illinois:
6.9% (28,432)
Number of households with income $60k - 75k:
Wonder Lake:
11.2% (1,001)
State:
10.2% (41,780)
Number of households with income $75k - 100k:
Wonder Lake:
8.8% (792)
State:
13.0% (53,426)
Number of households with income $100k - 125k:
Wonder Lake:
11.3% (1,013)
State:
10.5% (43,126)
Number of households with income $125k - 150k:
Wonder Lake:
12.5% (1,118)
State:
7.6% (31,153)
Number of households with income $150k - 200k:
Wonder Lake:
18.5% (1,661)
Illinois:
7.6% (30,946)
Number of households with income > $200k:
Wonder Lake:
8.6% (773)
Illinois:
8.6% (35,208)
Aggregate household income in Wonder Lake in 2022: $54,012,067
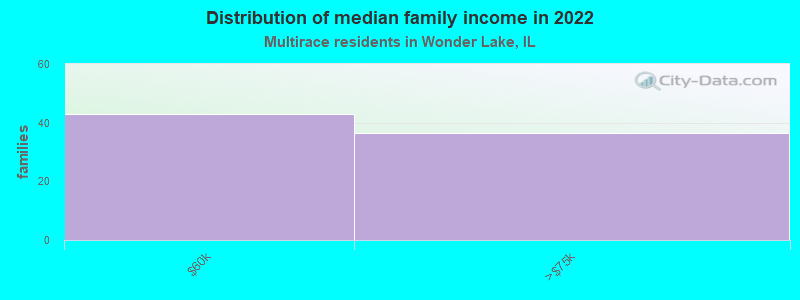
Median family income in Wonder Lake in 2022:
Wonder Lake:
$102,150
Illinois:
$84,400
Number of families with income $50k - 60k:
Wonder Lake:
54.0% (43)
State:
6.9% (19,177)
Number of families with income $60k - 75k:
Wonder Lake:
46.0% (37)
Illinois:
9.3% (25,936)
Median non-family income in Wonder Lake in 2022:
Wonder Lake:
$91,252
Illinois:
$43,615
Change in median non-family income between 2000 and 2022:
Wonder Lake, Illinois:
+46.3%
State:
+77.3%
Median per capita income in Wonder Lake in 2022:
Wonder Lake:
$45,243
Illinois:
$29,285
Change in median per capita income between 2000 and 2022:
Wonder Lake, Illinois:
+87.0%
Illinois:
+112.9%
Income statistics for other residents
Number of households with income < $10k:
Wonder Lake:
6.4% (13)
State:
5.7% (16,383)
Number of households with income $10k - 20k:
Wonder Lake:
3.9% (8)
State:
4.8% (13,886)
Number of households with income $20k - 30k:
Wonder Lake:
6.9% (14)
State:
7.0% (20,054)
Number of households with income $30k - 40k:
Wonder Lake:
7.4% (15)
State:
7.0% (20,038)
Number of households with income $40k - 50k:
Wonder Lake:
7.4% (15)
State:
8.3% (23,759)
Number of households with income $50k - 60k:
Wonder Lake:
8.3% (17)
Illinois:
7.8% (22,410)
Number of households with income $60k - 75k:
Wonder Lake:
11.3% (23)
Illinois:
12.0% (34,448)
Number of households with income $75k - 100k:
Wonder Lake:
16.2% (33)
State:
16.2% (46,508)
Number of households with income $100k - 125k:
Wonder Lake:
11.8% (24)
State:
12.5% (35,952)
Number of households with income $125k - 150k:
Wonder Lake:
8.8% (18)
State:
6.9% (19,732)
Number of households with income $150k - 200k:
Wonder Lake:
7.4% (15)
State:
7.5% (21,422)
Number of households with income > $200k:
Wonder Lake:
4.4% (9)
State:
4.3% (12,194)
Aggregate household income in Wonder Lake in 2022: $4,442,812
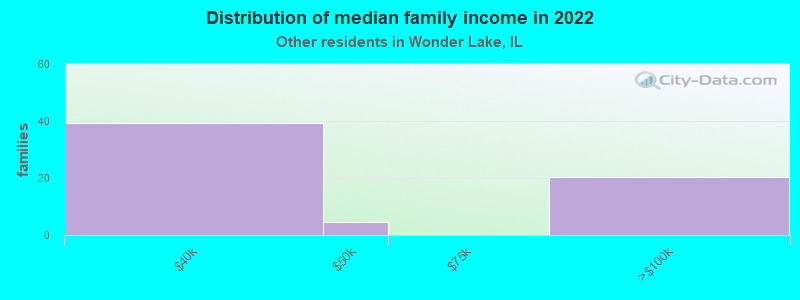
Median family income in Wonder Lake in 2022:
Wonder Lake:
$45,325
State:
$74,069
Number of families with income $30k - 40k:
Wonder Lake:
61.3% (39)
State:
7.6% (17,087)
Number of families with income $40k - 50k:
Wonder Lake:
7.2% (5)
State:
8.1% (18,155)
Number of families with income $75k - 100k:
Wonder Lake:
31.5% (20)
State:
17.2% (38,560)
Median per capita income in Wonder Lake in 2022:
Wonder Lake:
$15,247
State:
$25,392
Change in median per capita income between 2000 and 2022:
Wonder Lake, Illinois:
+63.3%
State:
+117.4%
Discuss Wonder Lake, Illinois (IL) on our hugely popular Illinois forum.