The median household income in Woodland, WA in 2022 was $80,141, which was 13.9% less than the median annual income of $91,306 across the entire state of Washington. Compared to the median income of $40,742 in 2000 this represents an increase of 49.2%. The per capita income in 2022 was $31,050, which means an increase of 49.8% compared to 2000 when it was $15,596.
Whole page based on the data from 2000 / 2022 when the population of Woodland, Washington was 3,780 / 6,541
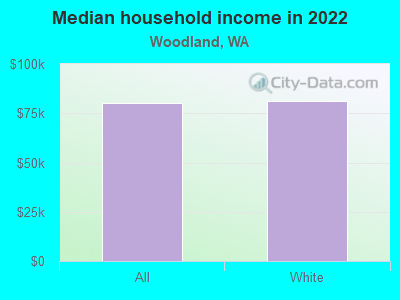
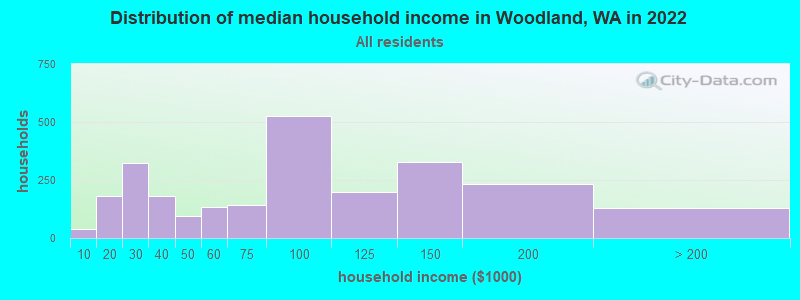
Income statistics for all residents
Median household income in Woodland, WA in 2022:
Woodland:
$80,141
Washington:
$91,306
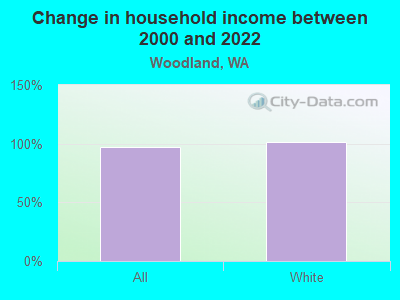
Change in median household income between 2000 and 2022:
Woodland, Washington:
+96.7%
Washington:
+99.5%
Number of households with income < $10k:
Woodland:
1.6% (39)
State:
4.5% (139,331)
Number of households with income $10k - 20k:
Woodland:
7.3% (182)
State:
5.0% (154,508)
Number of households with income $20k - 30k:
Woodland:
12.9% (324)
State:
5.4% (166,555)
Number of households with income $30k - 40k:
Woodland:
7.2% (180)
State:
5.5% (170,324)
Number of households with income $40k - 50k:
Woodland:
3.8% (94)
Washington:
6.0% (183,941)
Number of households with income $50k - 60k:
Woodland:
5.3% (133)
State:
6.1% (187,395)
Number of households with income $60k - 75k:
Woodland:
5.7% (142)
State:
8.7% (266,771)
Number of households with income $75k - 100k:
Woodland:
21.0% (525)
Washington:
13.1% (404,672)
Number of households with income $100k - 125k:
Woodland:
8.0% (200)
State:
11.0% (337,911)
Number of households with income $125k - 150k:
Woodland:
13.0% (326)
State:
8.0% (244,934)
Number of households with income $150k - 200k:
Woodland:
9.2% (231)
State:
10.5% (323,812)
Number of households with income > $200k:
Woodland:
5.1% (128)
State:
16.2% (499,799)
Aggregate household income in Woodland in 2022: $208,732,333
Median family income in Woodland in 2022:
Woodland:
$77,137
Washington:
$109,192
Number of families with income < $10k:
Woodland:
0.9% (17)
State:
2.9% (55,953)
Number of families with income $10k - 20k:
Woodland:
8.5% (154)
State:
2.6% (50,138)
Number of families with income $20k - 30k:
Woodland:
2.2% (40)
State:
3.2% (61,974)
Number of families with income $30k - 40k:
Woodland:
9.8% (178)
Washington:
4.1% (80,240)
Number of families with income $40k - 50k:
Woodland:
6.7% (120)
State:
4.9% (94,310)
Number of families with income $50k - 60k:
Woodland:
14.3% (259)
State:
5.3% (101,674)
Number of families with income $60k - 75k:
Woodland:
3.4% (62)
State:
8.2% (158,348)
Number of families with income $75k - 100k:
Woodland:
24.3% (440)
State:
13.8% (267,812)
Number of families with income $100k - 125k:
Woodland:
6.8% (123)
State:
12.4% (240,213)
Number of families with income $125k - 150k:
Woodland:
9.6% (173)
Washington:
9.3% (180,011)
Number of families with income $150k - 200k:
Woodland:
7.2% (131)
State:
13.0% (250,874)
Number of families with income > $200k:
Woodland:
6.1% (110)
State:
20.4% (393,898)
Median per capita income in Woodland in 2022:
Woodland:
$31,051
Washington:
$50,764
Change in median per capita income between 2000 and 2022:
Woodland, Washington:
+99.1%
State:
+121.0%
Income statistics for White residents
Median household income in Woodland, WA in 2022:
Woodland:
$81,197
State:
$91,916
Change in median household income between 2000 and 2022:
Woodland, Washington:
+101.2%
State:
+95.4%
Number of households with income < $10k:
Woodland:
0.6% (13)
Washington:
4.3% (95,850)
Number of households with income $10k - 20k:
Woodland:
6.9% (145)
State:
4.8% (106,421)
Number of households with income $20k - 30k:
Woodland:
8.5% (179)
State:
5.5% (122,860)
Number of households with income $30k - 40k:
Woodland:
8.0% (167)
State:
5.4% (119,627)
Number of households with income $40k - 50k:
Woodland:
3.5% (73)
State:
5.9% (132,276)
Number of households with income $50k - 60k:
Woodland:
6.8% (142)
State:
6.1% (136,212)
Number of households with income $60k - 75k:
Woodland:
7.0% (147)
State:
8.8% (196,086)
Number of households with income $75k - 100k:
Woodland:
21.8% (456)
State:
13.4% (299,192)
Number of households with income $100k - 125k:
Woodland:
7.5% (157)
State:
11.3% (252,209)
Number of households with income $125k - 150k:
Woodland:
12.6% (265)
Washington:
7.9% (175,962)
Number of households with income $150k - 200k:
Woodland:
10.8% (226)
Washington:
10.7% (239,156)
Number of households with income > $200k:
Woodland:
6.0% (126)
State:
16.1% (359,917)
Aggregate household income in Woodland in 2022: $184,057,277
Median family income in Woodland in 2022:
Woodland:
$77,196
State:
$112,511
Number of families with income < $10k:
Woodland:
1.0% (15)
State:
2.4% (33,676)
Number of families with income $10k - 20k:
Woodland:
4.6% (72)
State:
2.0% (28,228)
Number of families with income $20k - 30k:
Woodland:
1.7% (26)
Washington:
2.9% (39,288)
Number of families with income $30k - 40k:
Woodland:
10.6% (165)
Washington:
3.6% (50,190)
Number of families with income $40k - 50k:
Woodland:
5.8% (90)
State:
4.6% (63,009)
Number of families with income $50k - 60k:
Woodland:
16.3% (254)
State:
5.0% (69,270)
Number of families with income $60k - 75k:
Woodland:
4.2% (65)
State:
8.2% (112,369)
Number of families with income $75k - 100k:
Woodland:
23.9% (372)
Washington:
14.1% (194,214)
Number of families with income $100k - 125k:
Woodland:
6.5% (102)
Washington:
13.2% (182,184)
Number of families with income $125k - 150k:
Woodland:
10.4% (162)
State:
9.5% (130,928)
Number of families with income $150k - 200k:
Woodland:
8.0% (124)
State:
13.7% (188,621)
Number of families with income > $200k:
Woodland:
7.2% (112)
Washington:
20.8% (285,982)
Median per capita income in Woodland in 2022:
Woodland:
$34,103
State:
$55,212
Change in median per capita income between 2000 and 2022:
Woodland, Washington:
+114.9%
Washington:
+123.8%
Income statistics for Black or African American residents
Number of households with income < $10k:
Woodland:
0.0% (0)
State:
7.2% (8,014)
Number of households with income $10k - 20k:
Woodland:
48.6% (17)
Washington:
8.0% (8,904)
Number of households with income $20k - 30k:
Woodland:
0.0% (0)
State:
7.4% (8,207)
Number of households with income $30k - 40k:
Woodland:
0.0% (0)
State:
5.6% (6,220)
Number of households with income $40k - 50k:
Woodland:
0.0% (0)
Washington:
9.5% (10,585)
Number of households with income $50k - 60k:
Woodland:
0.0% (0)
State:
7.3% (8,078)
Number of households with income $60k - 75k:
Woodland:
0.0% (0)
State:
8.7% (9,704)
Number of households with income $75k - 100k:
Woodland:
0.0% (0)
State:
12.9% (14,315)
Number of households with income $100k - 125k:
Woodland:
51.4% (18)
State:
7.7% (8,592)
Number of households with income $125k - 150k:
Woodland:
0.0% (0)
Washington:
8.9% (9,840)
Number of households with income $150k - 200k:
Woodland:
0.0% (0)
State:
7.6% (8,434)
Number of households with income > $200k:
Woodland:
0.0% (0)
Washington:
9.1% (10,075)
Median per capita income in Woodland in 2022:
Woodland:
$39,209
State:
$38,209
Income statistics for Hispanic or Latino residents
Number of households with income < $10k:
Woodland:
0.0% (0)
State:
4.9% (14,456)
Number of households with income $10k - 20k:
Woodland:
0.0% (0)
State:
5.3% (15,449)
Number of households with income $20k - 30k:
Woodland:
20.6% (76)
State:
6.8% (20,016)
Number of households with income $30k - 40k:
Woodland:
19.5% (72)
Washington:
7.7% (22,548)
Number of households with income $40k - 50k:
Woodland:
9.5% (35)
State:
7.3% (21,450)
Number of households with income $50k - 60k:
Woodland:
0.0% (0)
State:
7.7% (22,744)
Number of households with income $60k - 75k:
Woodland:
0.0% (0)
State:
10.5% (30,737)
Number of households with income $75k - 100k:
Woodland:
40.7% (150)
Washington:
14.9% (43,843)
Number of households with income $100k - 125k:
Woodland:
0.0% (0)
State:
11.1% (32,554)
Number of households with income $125k - 150k:
Woodland:
9.8% (36)
Washington:
7.4% (21,624)
Number of households with income $150k - 200k:
Woodland:
0.0% (0)
State:
7.3% (21,360)
Number of households with income > $200k:
Woodland:
0.0% (0)
State:
9.2% (27,055)
Aggregate household income in Woodland in 2022: $20,412,045
Median per capita income in Woodland in 2022:
Woodland:
$16,570
Washington:
$28,252
Change in median per capita income between 2000 and 2022:
Woodland, Washington:
+25.7%
State:
+150.2%
Income statistics for American Indian and Alaska Native residents
Aggregate household income in Woodland in 2022: $2,654,790
Median per capita income in Woodland in 2022:
Woodland:
$15,200
State:
$27,053
Change in median per capita income between 2000 and 2022:
Woodland, Washington:
+44.6%
State:
+98.6%
Income statistics for Multirace residents
Number of households with income < $10k:
Woodland:
8.0% (28)
State:
4.3% (12,040)
Number of households with income $10k - 20k:
Woodland:
4.5% (16)
State:
6.6% (18,437)
Number of households with income $20k - 30k:
Woodland:
36.6% (129)
State:
5.2% (14,559)
Number of households with income $30k - 40k:
Woodland:
0.0% (0)
Washington:
6.7% (18,491)
Number of households with income $40k - 50k:
Woodland:
11.1% (39)
Washington:
6.3% (17,459)
Number of households with income $50k - 60k:
Woodland:
0.0% (0)
State:
6.9% (19,086)
Number of households with income $60k - 75k:
Woodland:
0.0% (0)
Washington:
9.1% (25,310)
Number of households with income $75k - 100k:
Woodland:
21.6% (76)
Washington:
13.5% (37,493)
Number of households with income $100k - 125k:
Woodland:
5.7% (20)
Washington:
10.7% (29,626)
Number of households with income $125k - 150k:
Woodland:
12.5% (44)
State:
8.6% (23,899)
Number of households with income $150k - 200k:
Woodland:
0.0% (0)
Washington:
10.2% (28,214)
Number of households with income > $200k:
Woodland:
0.0% (0)
State:
11.9% (32,947)
Aggregate household income in Woodland in 2022: $18,744,314
Median per capita income in Woodland in 2022:
Woodland:
$21,066
Washington:
$32,496
Income statistics for other residents
Number of households with income < $10k:
Woodland:
0.0% (0)
Washington:
5.3% (6,540)
Number of households with income $10k - 20k:
Woodland:
0.0% (0)
State:
6.0% (7,385)
Number of households with income $20k - 30k:
Woodland:
51.5% (34)
Washington:
7.5% (9,289)
Number of households with income $30k - 40k:
Woodland:
0.0% (0)
State:
8.9% (11,015)
Number of households with income $40k - 50k:
Woodland:
15.2% (10)
State:
7.6% (9,399)
Number of households with income $50k - 60k:
Woodland:
0.0% (0)
State:
7.2% (8,867)
Number of households with income $60k - 75k:
Woodland:
0.0% (0)
Washington:
10.5% (13,032)
Number of households with income $75k - 100k:
Woodland:
33.3% (22)
State:
14.6% (18,007)
Number of households with income $100k - 125k:
Woodland:
0.0% (0)
State:
12.2% (15,128)
Number of households with income $125k - 150k:
Woodland:
0.0% (0)
State:
5.6% (6,950)
Number of households with income $150k - 200k:
Woodland:
0.0% (0)
State:
7.1% (8,749)
Number of households with income > $200k:
Woodland:
0.0% (0)
State:
7.5% (9,208)
Aggregate household income in Woodland in 2022: $4,097,683
Median per capita income in Woodland in 2022:
Woodland:
$12,646
Washington:
$27,542
Change in median per capita income between 2000 and 2022:: -52.9%
Woodland, Washington:
-52.9%
State:
+167.8%
Discuss Woodland, Washington (WA) on our hugely popular Washington forum.