Moody, Alabama Submit your own pictures of this town and show them to the world
OSM Map
General Map
Google Map
MSN Map
OSM Map
General Map
Google Map
MSN Map
OSM Map
General Map
Google Map
MSN Map
OSM Map
General Map
Google Map
MSN Map
Please wait while loading the map...
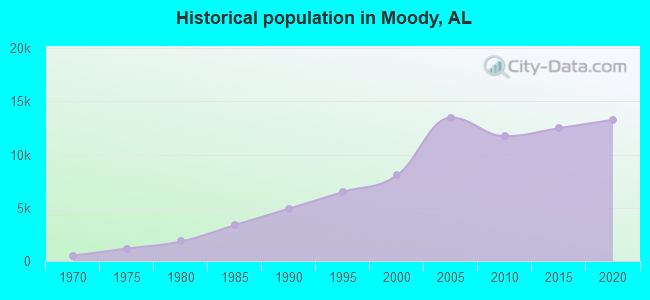
Population in 2022: 13,587 (55% urban, 45% rural). Population change since 2000: +68.7%Males: 6,584 Females: 7,003
March 2022 cost of living index in Moody: 86.9 (less than average, U.S. average is 100) Percentage of residents living in poverty in 2022: 8.7%for White Non-Hispanic residents , 7.5% for Black residents )Business Search - 14 Million verified businesses
Data:
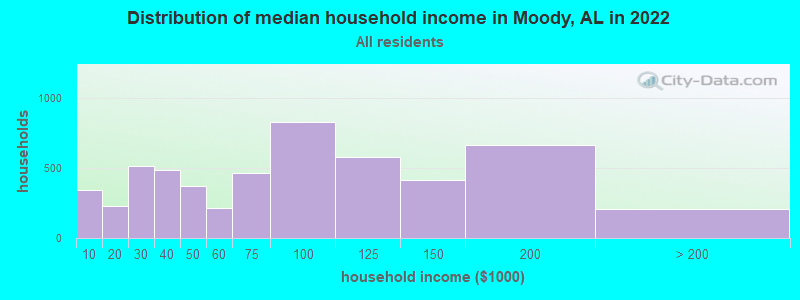
Median household income ($)
Median household income (% change since 2000)
Household income diversity
Ratio of average income to average house value (%)
Ratio of average income to average rent
Median household income ($) - White
Median household income ($) - Black or African American
Median household income ($) - Asian
Median household income ($) - Hispanic or Latino
Median household income ($) - American Indian and Alaska Native
Median household income ($) - Multirace
Median household income ($) - Other Race
Median household income for houses/condos with a mortgage ($)
Median household income for apartments without a mortgage ($)
Races - White alone (%)
Races - White alone (% change since 2000)
Races - Black alone (%)
Races - Black alone (% change since 2000)
Races - American Indian alone (%)
Races - American Indian alone (% change since 2000)
Races - Asian alone (%)
Races - Asian alone (% change since 2000)
Races - Hispanic (%)
Races - Hispanic (% change since 2000)
Races - Native Hawaiian and Other Pacific Islander alone (%)
Races - Native Hawaiian and Other Pacific Islander alone (% change since 2000)
Races - Two or more races (%)
Races - Two or more races (% change since 2000)
Races - Other race alone (%)
Races - Other race alone (% change since 2000)
Racial diversity
Unemployment (%)
Unemployment (% change since 2000)
Unemployment (%) - White
Unemployment (%) - Black or African American
Unemployment (%) - Asian
Unemployment (%) - Hispanic or Latino
Unemployment (%) - American Indian and Alaska Native
Unemployment (%) - Multirace
Unemployment (%) - Other Race
Population density (people per square mile)
Population - Males (%)
Population - Females (%)
Population - Males (%) - White
Population - Males (%) - Black or African American
Population - Males (%) - Asian
Population - Males (%) - Hispanic or Latino
Population - Males (%) - American Indian and Alaska Native
Population - Males (%) - Multirace
Population - Males (%) - Other Race
Population - Females (%) - White
Population - Females (%) - Black or African American
Population - Females (%) - Asian
Population - Females (%) - Hispanic or Latino
Population - Females (%) - American Indian and Alaska Native
Population - Females (%) - Multirace
Population - Females (%) - Other Race
Coronavirus confirmed cases (Jun 04, 2024)
Deaths caused by coronavirus (Jun 04, 2024)
Coronavirus confirmed cases (per 100k population) (Jun 04, 2024)
Deaths caused by coronavirus (per 100k population) (Jun 04, 2024)
Daily increase in number of cases (Jun 04, 2024)
Weekly increase in number of cases (Jun 04, 2024)
Cases doubled (in days) (Jun 04, 2024)
Hospitalized patients (Apr 18, 2022)
Negative test results (Apr 18, 2022)
Total test results (Apr 18, 2022)
COVID Vaccine doses distributed (per 100k population) (Sep 19, 2023)
COVID Vaccine doses administered (per 100k population) (Sep 19, 2023)
COVID Vaccine doses distributed (Sep 19, 2023)
COVID Vaccine doses administered (Sep 19, 2023)
Likely homosexual households (%)
Likely homosexual households (% change since 2000)
Likely homosexual households - Lesbian couples (%)
Likely homosexual households - Lesbian couples (% change since 2000)
Likely homosexual households - Gay men (%)
Likely homosexual households - Gay men (% change since 2000)
Cost of living index
Median gross rent ($)
Median contract rent ($)
Median monthly housing costs ($)
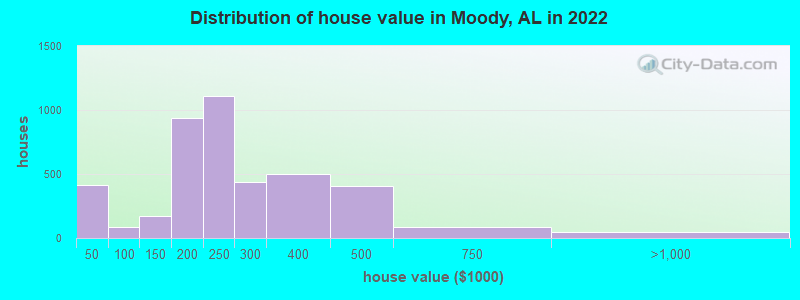
Median house or condo value ($)
Median house or condo value ($ change since 2000)
Mean house or condo value by units in structure - 1, detached ($)
Mean house or condo value by units in structure - 1, attached ($)
Mean house or condo value by units in structure - 2 ($)
Mean house or condo value by units in structure by units in structure - 3 or 4 ($)
Mean house or condo value by units in structure - 5 or more ($)
Mean house or condo value by units in structure - Boat, RV, van, etc. ($)
Mean house or condo value by units in structure - Mobile home ($)
Median house or condo value ($) - White
Median house or condo value ($) - Black or African American
Median house or condo value ($) - Asian
Median house or condo value ($) - Hispanic or Latino
Median house or condo value ($) - American Indian and Alaska Native
Median house or condo value ($) - Multirace
Median house or condo value ($) - Other Race
Median resident age
Resident age diversity
Median resident age - Males
Median resident age - Females
Median resident age - White
Median resident age - Black or African American
Median resident age - Asian
Median resident age - Hispanic or Latino
Median resident age - American Indian and Alaska Native
Median resident age - Multirace
Median resident age - Other Race
Median resident age - Males - White
Median resident age - Males - Black or African American
Median resident age - Males - Asian
Median resident age - Males - Hispanic or Latino
Median resident age - Males - American Indian and Alaska Native
Median resident age - Males - Multirace
Median resident age - Males - Other Race
Median resident age - Females - White
Median resident age - Females - Black or African American
Median resident age - Females - Asian
Median resident age - Females - Hispanic or Latino
Median resident age - Females - American Indian and Alaska Native
Median resident age - Females - Multirace
Median resident age - Females - Other Race
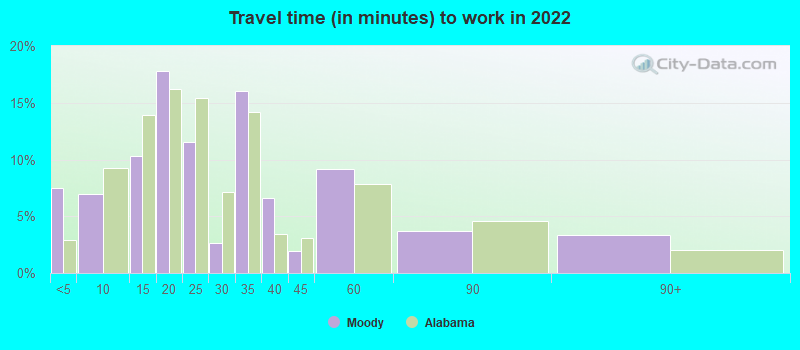
Commute - mean travel time to work (minutes)
Travel time to work - Less than 5 minutes (%)
Travel time to work - Less than 5 minutes (% change since 2000)
Travel time to work - 5 to 9 minutes (%)
Travel time to work - 5 to 9 minutes (% change since 2000)
Travel time to work - 10 to 19 minutes (%)
Travel time to work - 10 to 19 minutes (% change since 2000)
Travel time to work - 20 to 29 minutes (%)
Travel time to work - 20 to 29 minutes (% change since 2000)
Travel time to work - 30 to 39 minutes (%)
Travel time to work - 30 to 39 minutes (% change since 2000)
Travel time to work - 40 to 59 minutes (%)
Travel time to work - 40 to 59 minutes (% change since 2000)
Travel time to work - 60 to 89 minutes (%)
Travel time to work - 60 to 89 minutes (% change since 2000)
Travel time to work - 90 or more minutes (%)
Travel time to work - 90 or more minutes (% change since 2000)
Marital status - Never married (%)
Marital status - Now married (%)
Marital status - Separated (%)
Marital status - Widowed (%)
Marital status - Divorced (%)
Median family income ($)
Median family income (% change since 2000)
Median non-family income ($)
Median non-family income (% change since 2000)
Median per capita income ($)
Median per capita income (% change since 2000)
Median family income ($) - White
Median family income ($) - Black or African American
Median family income ($) - Asian
Median family income ($) - Hispanic or Latino
Median family income ($) - American Indian and Alaska Native
Median family income ($) - Multirace
Median family income ($) - Other Race
Median year house/condo built
Median year apartment built
Year house built - Built 2005 or later (%)
Year house built - Built 2000 to 2004 (%)
Year house built - Built 1990 to 1999 (%)
Year house built - Built 1980 to 1989 (%)
Year house built - Built 1970 to 1979 (%)
Year house built - Built 1960 to 1969 (%)
Year house built - Built 1950 to 1959 (%)
Year house built - Built 1940 to 1949 (%)
Year house built - Built 1939 or earlier (%)
Average household size
Household density (households per square mile)
Average household size - White
Average household size - Black or African American
Average household size - Asian
Average household size - Hispanic or Latino
Average household size - American Indian and Alaska Native
Average household size - Multirace
Average household size - Other Race
Occupied housing units (%)
Vacant housing units (%)
Owner occupied housing units (%)
Renter occupied housing units (%)
Vacancy status - For rent (%)
Vacancy status - For sale only (%)
Vacancy status - Rented or sold, not occupied (%)
Vacancy status - For seasonal, recreational, or occasional use (%)
Vacancy status - For migrant workers (%)
Vacancy status - Other vacant (%)
Residents with income below the poverty level (%)
Residents with income below 50% of the poverty level (%)
Children below poverty level (%)
Poor families by family type - Married-couple family (%)
Poor families by family type - Male, no wife present (%)
Poor families by family type - Female, no husband present (%)
Poverty status for native-born residents (%)
Poverty status for foreign-born residents (%)
Poverty among high school graduates not in families (%)
Poverty among people who did not graduate high school not in families (%)
Residents with income below the poverty level (%) - White
Residents with income below the poverty level (%) - Black or African American
Residents with income below the poverty level (%) - Asian
Residents with income below the poverty level (%) - Hispanic or Latino
Residents with income below the poverty level (%) - American Indian and Alaska Native
Residents with income below the poverty level (%) - Multirace
Residents with income below the poverty level (%) - Other Race
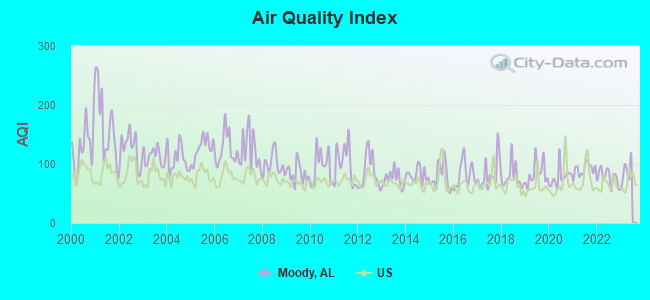
Air pollution - Air Quality Index (AQI)
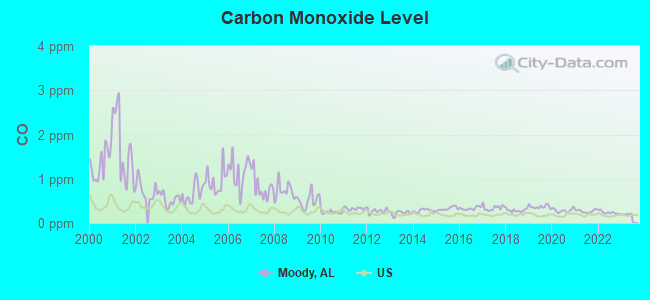
Air pollution - CO
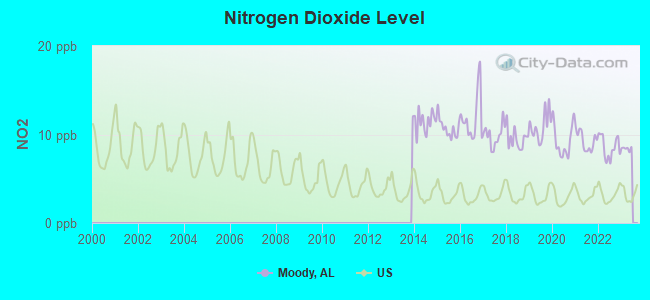
Air pollution - NO2
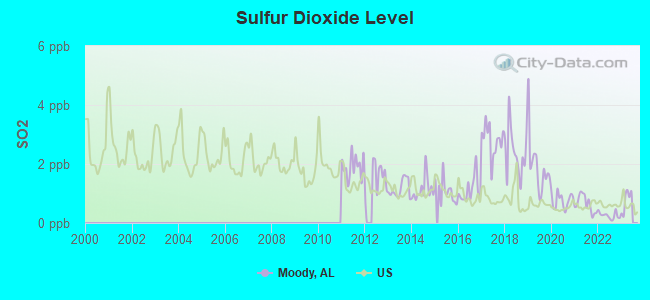
Air pollution - SO2
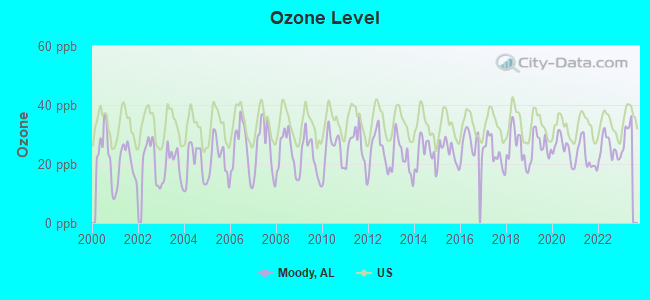
Air pollution - Ozone
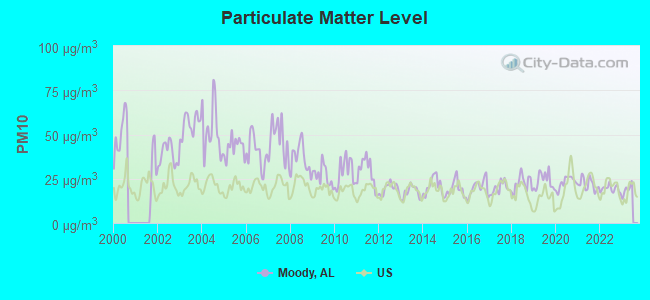
Air pollution - PM10
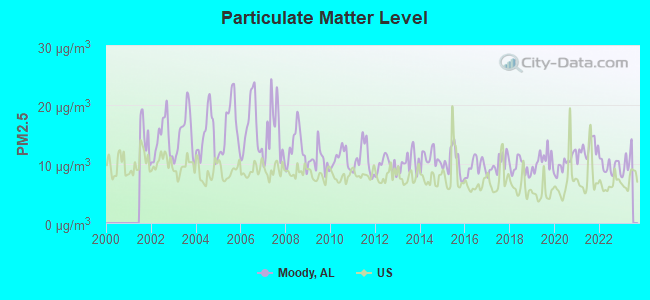
Air pollution - PM25
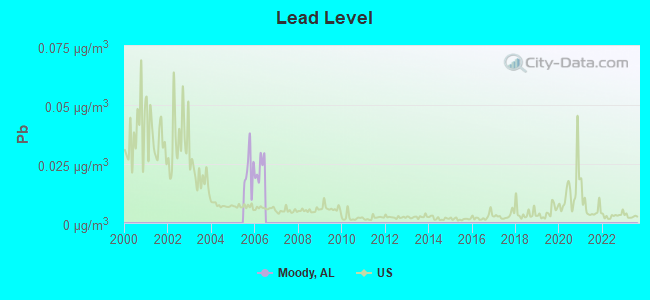
Air pollution - Pb
Crime - Murders per 100,000 population
Crime - Rapes per 100,000 population
Crime - Robberies per 100,000 population
Crime - Assaults per 100,000 population
Crime - Burglaries per 100,000 population
Crime - Thefts per 100,000 population
Crime - Auto thefts per 100,000 population
Crime - Arson per 100,000 population
Crime - City-data.com crime index
Crime - Violent crime index
Crime - Property crime index
Crime - Murders per 100,000 population (5 year average)
Crime - Rapes per 100,000 population (5 year average)
Crime - Robberies per 100,000 population (5 year average)
Crime - Assaults per 100,000 population (5 year average)
Crime - Burglaries per 100,000 population (5 year average)
Crime - Thefts per 100,000 population (5 year average)
Crime - Auto thefts per 100,000 population (5 year average)
Crime - Arson per 100,000 population (5 year average)
Crime - City-data.com crime index (5 year average)
Crime - Violent crime index (5 year average)
Crime - Property crime index (5 year average)
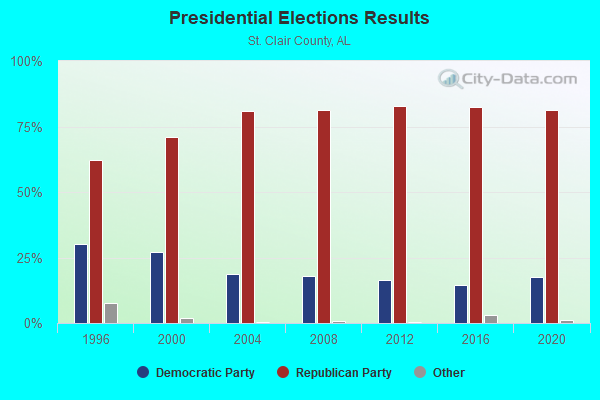
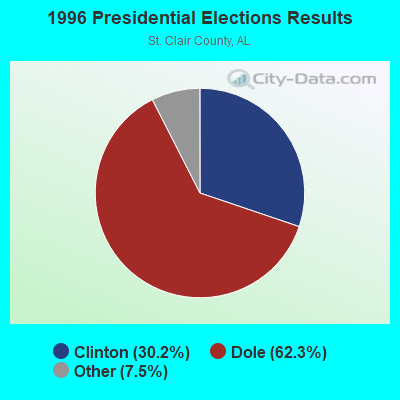
1996 Presidential Elections Results (%) - Democratic Party (Clinton)
1996 Presidential Elections Results (%) - Republican Party (Dole)
1996 Presidential Elections Results (%) - Other
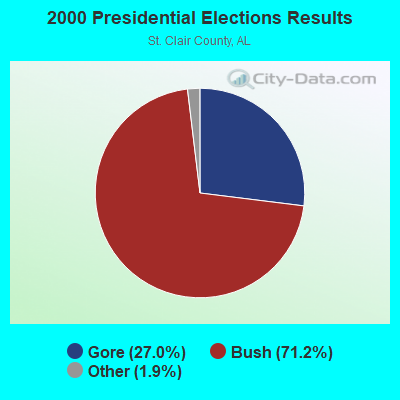
2000 Presidential Elections Results (%) - Democratic Party (Gore)
2000 Presidential Elections Results (%) - Republican Party (Bush)
2000 Presidential Elections Results (%) - Other
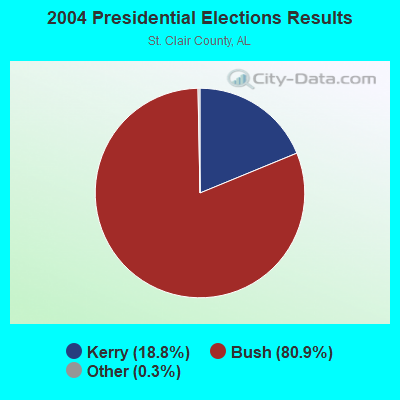
2004 Presidential Elections Results (%) - Democratic Party (Kerry)
2004 Presidential Elections Results (%) - Republican Party (Bush)
2004 Presidential Elections Results (%) - Other
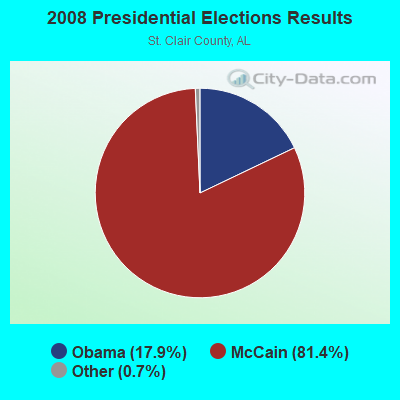
2008 Presidential Elections Results (%) - Democratic Party (Obama)
2008 Presidential Elections Results (%) - Republican Party (McCain)
2008 Presidential Elections Results (%) - Other
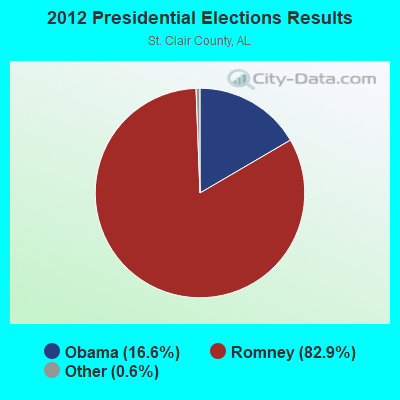
2012 Presidential Elections Results (%) - Democratic Party (Obama)
2012 Presidential Elections Results (%) - Republican Party (Romney)
2012 Presidential Elections Results (%) - Other
2016 Presidential Elections Results (%) - Democratic Party (Clinton)
2016 Presidential Elections Results (%) - Republican Party (Trump)
2016 Presidential Elections Results (%) - Other
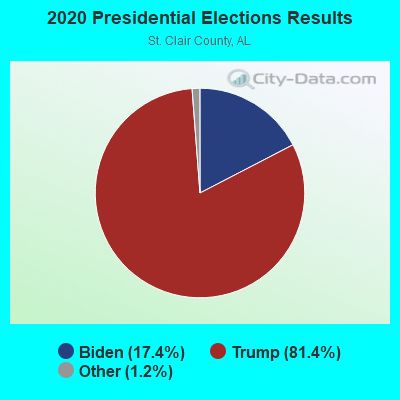
2020 Presidential Elections Results (%) - Democratic Party (Biden)
2020 Presidential Elections Results (%) - Republican Party (Trump)
2020 Presidential Elections Results (%) - Other
Ancestries Reported - Arab (%)
Ancestries Reported - Czech (%)
Ancestries Reported - Danish (%)
Ancestries Reported - Dutch (%)
Ancestries Reported - English (%)
Ancestries Reported - French (%)
Ancestries Reported - French Canadian (%)
Ancestries Reported - German (%)
Ancestries Reported - Greek (%)
Ancestries Reported - Hungarian (%)
Ancestries Reported - Irish (%)
Ancestries Reported - Italian (%)
Ancestries Reported - Lithuanian (%)
Ancestries Reported - Norwegian (%)
Ancestries Reported - Polish (%)
Ancestries Reported - Portuguese (%)
Ancestries Reported - Russian (%)
Ancestries Reported - Scotch-Irish (%)
Ancestries Reported - Scottish (%)
Ancestries Reported - Slovak (%)
Ancestries Reported - Subsaharan African (%)
Ancestries Reported - Swedish (%)
Ancestries Reported - Swiss (%)
Ancestries Reported - Ukrainian (%)
Ancestries Reported - United States (%)
Ancestries Reported - Welsh (%)
Ancestries Reported - West Indian (%)
Ancestries Reported - Other (%)
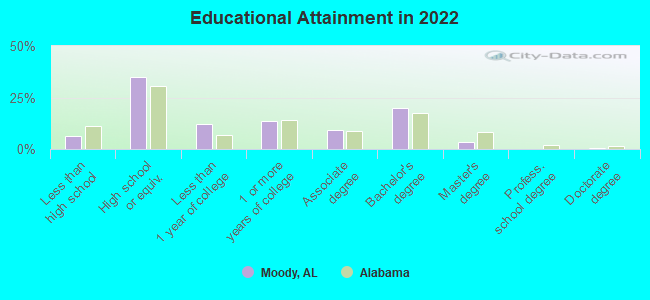
Educational Attainment - No schooling completed (%)
Educational Attainment - Less than high school (%)
Educational Attainment - High school or equivalent (%)
Educational Attainment - Less than 1 year of college (%)
Educational Attainment - 1 or more years of college (%)
Educational Attainment - Associate degree (%)
Educational Attainment - Bachelor's degree (%)
Educational Attainment - Master's degree (%)
Educational Attainment - Professional school degree (%)
Educational Attainment - Doctorate degree (%)
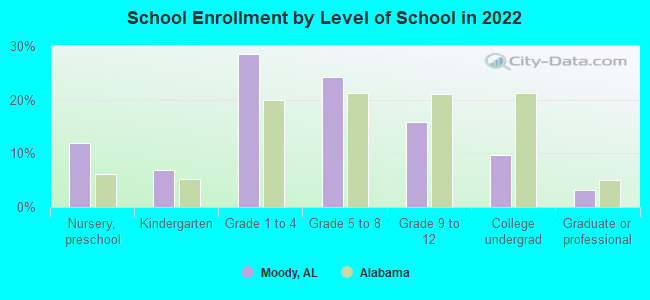
School Enrollment - Nursery, preschool (%)
School Enrollment - Kindergarten (%)
School Enrollment - Grade 1 to 4 (%)
School Enrollment - Grade 5 to 8 (%)
School Enrollment - Grade 9 to 12 (%)
School Enrollment - College undergrad (%)
School Enrollment - Graduate or professional (%)
School Enrollment - Not enrolled in school (%)
School enrollment - Public schools (%)
School enrollment - Private schools (%)
School enrollment - Not enrolled (%)
Median number of rooms in houses and condos
Median number of rooms in apartments
Housing units lacking complete plumbing facilities (%)
Housing units lacking complete kitchen facilities (%)
Density of houses
Urban houses (%)
Rural houses (%)
Households with people 60 years and over (%)
Households with people 65 years and over (%)
Households with people 75 years and over (%)
Households with one or more nonrelatives (%)
Households with no nonrelatives (%)
Population in households (%)
Family households (%)
Nonfamily households (%)
Population in families (%)
Family households with own children (%)
Median number of bedrooms in owner occupied houses
Mean number of bedrooms in owner occupied houses
Median number of bedrooms in renter occupied houses
Mean number of bedrooms in renter occupied houses
Median number of vehichles in owner occupied houses
Mean number of vehichles in owner occupied houses
Median number of vehichles in renter occupied houses
Mean number of vehichles in renter occupied houses
Mortgage status - with mortgage (%)
Mortgage status - with second mortgage (%)
Mortgage status - with home equity loan (%)
Mortgage status - with both second mortgage and home equity loan (%)
Mortgage status - without a mortgage (%)
Average family size
Average family size - White
Average family size - Black or African American
Average family size - Asian
Average family size - Hispanic or Latino
Average family size - American Indian and Alaska Native
Average family size - Multirace
Average family size - Other Race
Geographical mobility - Same house 1 year ago (%)
Geographical mobility - Moved within same county (%)
Geographical mobility - Moved from different county within same state (%)
Geographical mobility - Moved from different state (%)
Geographical mobility - Moved from abroad (%)
Place of birth - Born in state of residence (%)
Place of birth - Born in other state (%)
Place of birth - Native, outside of US (%)
Place of birth - Foreign born (%)
Housing units in structures - 1, detached (%)
Housing units in structures - 1, attached (%)
Housing units in structures - 2 (%)
Housing units in structures - 3 or 4 (%)
Housing units in structures - 5 to 9 (%)
Housing units in structures - 10 to 19 (%)
Housing units in structures - 20 to 49 (%)
Housing units in structures - 50 or more (%)
Housing units in structures - Mobile home (%)
Housing units in structures - Boat, RV, van, etc. (%)
House/condo owner moved in on average (years ago)
Renter moved in on average (years ago)
Year householder moved into unit - Moved in 1999 to March 2000 (%)
Year householder moved into unit - Moved in 1995 to 1998 (%)
Year householder moved into unit - Moved in 1990 to 1994 (%)
Year householder moved into unit - Moved in 1980 to 1989 (%)
Year householder moved into unit - Moved in 1970 to 1979 (%)
Year householder moved into unit - Moved in 1969 or earlier (%)
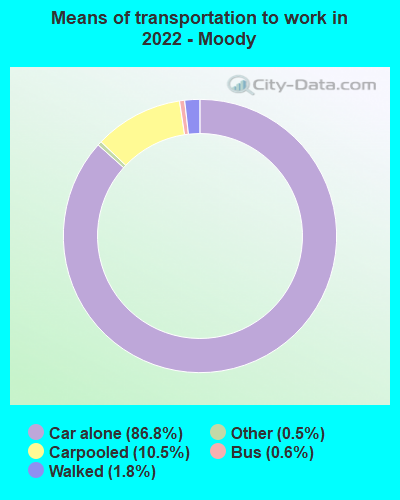
Means of transportation to work - Drove car alone (%)
Means of transportation to work - Carpooled (%)
Means of transportation to work - Public transportation (%)
Means of transportation to work - Bus or trolley bus (%)
Means of transportation to work - Streetcar or trolley car (%)
Means of transportation to work - Subway or elevated (%)
Means of transportation to work - Railroad (%)
Means of transportation to work - Ferryboat (%)
Means of transportation to work - Taxicab (%)
Means of transportation to work - Motorcycle (%)
Means of transportation to work - Bicycle (%)
Means of transportation to work - Walked (%)
Means of transportation to work - Other means (%)
Working at home (%)
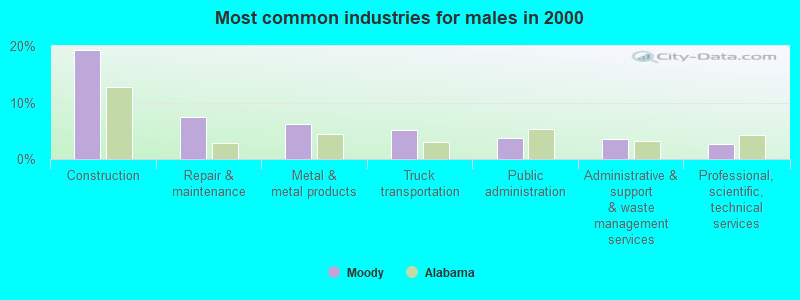
Industry diversity
Most Common Industries - Agriculture, forestry, fishing and hunting, and mining (%)
Most Common Industries - Agriculture, forestry, fishing and hunting (%)
Most Common Industries - Mining, quarrying, and oil and gas extraction (%)
Most Common Industries - Construction (%)
Most Common Industries - Manufacturing (%)
Most Common Industries - Wholesale trade (%)
Most Common Industries - Retail trade (%)
Most Common Industries - Transportation and warehousing, and utilities (%)
Most Common Industries - Transportation and warehousing (%)
Most Common Industries - Utilities (%)
Most Common Industries - Information (%)
Most Common Industries - Finance and insurance, and real estate and rental and leasing (%)
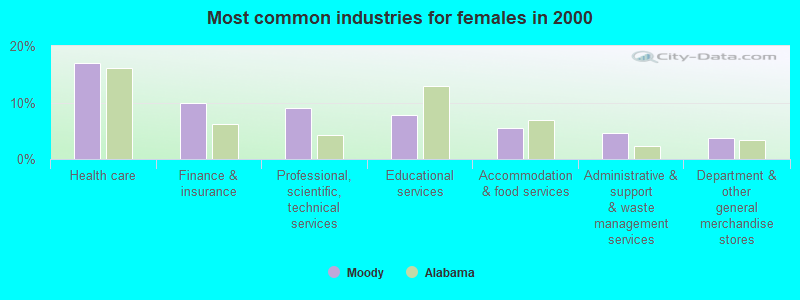
Most Common Industries - Finance and insurance (%)
Most Common Industries - Real estate and rental and leasing (%)
Most Common Industries - Professional, scientific, and management, and administrative and waste management services (%)
Most Common Industries - Professional, scientific, and technical services (%)
Most Common Industries - Management of companies and enterprises (%)
Most Common Industries - Administrative and support and waste management services (%)
Most Common Industries - Educational services, and health care and social assistance (%)
Most Common Industries - Educational services (%)
Most Common Industries - Health care and social assistance (%)
Most Common Industries - Arts, entertainment, and recreation, and accommodation and food services (%)
Most Common Industries - Arts, entertainment, and recreation (%)
Most Common Industries - Accommodation and food services (%)
Most Common Industries - Other services, except public administration (%)
Most Common Industries - Public administration (%)
Occupation diversity
Most Common Occupations - Management, business, science, and arts occupations (%)
Most Common Occupations - Management, business, and financial occupations (%)
Most Common Occupations - Management occupations (%)
Most Common Occupations - Business and financial operations occupations (%)
Most Common Occupations - Computer, engineering, and science occupations (%)
Most Common Occupations - Computer and mathematical occupations (%)
Most Common Occupations - Architecture and engineering occupations (%)
Most Common Occupations - Life, physical, and social science occupations (%)
Most Common Occupations - Education, legal, community service, arts, and media occupations (%)
Most Common Occupations - Community and social service occupations (%)
Most Common Occupations - Legal occupations (%)
Most Common Occupations - Education, training, and library occupations (%)
Most Common Occupations - Arts, design, entertainment, sports, and media occupations (%)
Most Common Occupations - Healthcare practitioners and technical occupations (%)
Most Common Occupations - Health diagnosing and treating practitioners and other technical occupations (%)
Most Common Occupations - Health technologists and technicians (%)
Most Common Occupations - Service occupations (%)
Most Common Occupations - Healthcare support occupations (%)
Most Common Occupations - Protective service occupations (%)
Most Common Occupations - Fire fighting and prevention, and other protective service workers including supervisors (%)
Most Common Occupations - Law enforcement workers including supervisors (%)
Most Common Occupations - Food preparation and serving related occupations (%)
Most Common Occupations - Building and grounds cleaning and maintenance occupations (%)
Most Common Occupations - Personal care and service occupations (%)
Most Common Occupations - Sales and office occupations (%)
Most Common Occupations - Sales and related occupations (%)
Most Common Occupations - Office and administrative support occupations (%)
Most Common Occupations - Natural resources, construction, and maintenance occupations (%)
Most Common Occupations - Farming, fishing, and forestry occupations (%)
Most Common Occupations - Construction and extraction occupations (%)
Most Common Occupations - Installation, maintenance, and repair occupations (%)
Most Common Occupations - Production, transportation, and material moving occupations (%)
Most Common Occupations - Production occupations (%)
Most Common Occupations - Transportation occupations (%)
Most Common Occupations - Material moving occupations (%)
People in Group quarters - Institutionalized population (%)
People in Group quarters - Correctional institutions (%)
People in Group quarters - Federal prisons and detention centers (%)
People in Group quarters - Halfway houses (%)
People in Group quarters - Local jails and other confinement facilities (including police lockups) (%)
People in Group quarters - Military disciplinary barracks (%)
People in Group quarters - State prisons (%)
People in Group quarters - Other types of correctional institutions (%)
People in Group quarters - Nursing homes (%)
People in Group quarters - Hospitals/wards, hospices, and schools for the handicapped (%)
People in Group quarters - Hospitals/wards and hospices for chronically ill (%)
People in Group quarters - Hospices or homes for chronically ill (%)
People in Group quarters - Military hospitals or wards for chronically ill (%)
People in Group quarters - Other hospitals or wards for chronically ill (%)
People in Group quarters - Hospitals or wards for drug/alcohol abuse (%)
People in Group quarters - Mental (Psychiatric) hospitals or wards (%)
People in Group quarters - Schools, hospitals, or wards for the mentally retarded (%)
People in Group quarters - Schools, hospitals, or wards for the physically handicapped (%)
People in Group quarters - Institutions for the deaf (%)
People in Group quarters - Institutions for the blind (%)
People in Group quarters - Orthopedic wards and institutions for the physically handicapped (%)
People in Group quarters - Wards in general hospitals for patients who have no usual home elsewhere (%)
People in Group quarters - Wards in military hospitals for patients who have no usual home elsewhere (%)
People in Group quarters - Juvenile institutions (%)
People in Group quarters - Long-term care (%)
People in Group quarters - Homes for abused, dependent, and neglected children (%)
People in Group quarters - Residential treatment centers for emotionally disturbed children (%)
People in Group quarters - Training schools for juvenile delinquents (%)
People in Group quarters - Short-term care, detention or diagnostic centers for delinquent children (%)
People in Group quarters - Type of juvenile institution unknown (%)
People in Group quarters - Noninstitutionalized population (%)
People in Group quarters - College dormitories (includes college quarters off campus) (%)
People in Group quarters - Military quarters (%)
People in Group quarters - On base (%)
People in Group quarters - Barracks, unaccompanied personnel housing (UPH), (Enlisted/Officer), ;and similar group living quarters for military personnel (%)
People in Group quarters - Transient quarters for temporary residents (%)
People in Group quarters - Military ships (%)
People in Group quarters - Group homes (%)
People in Group quarters - Homes or halfway houses for drug/alcohol abuse (%)
People in Group quarters - Homes for the mentally ill (%)
People in Group quarters - Homes for the mentally retarded (%)
People in Group quarters - Homes for the physically handicapped (%)
People in Group quarters - Other group homes (%)
People in Group quarters - Religious group quarters (%)
People in Group quarters - Dormitories (%)
People in Group quarters - Agriculture workers' dormitories on farms (%)
People in Group quarters - Job Corps and vocational training facilities (%)
People in Group quarters - Other workers' dormitories (%)
People in Group quarters - Crews of maritime vessels (%)
People in Group quarters - Other nonhousehold living situations (%)
People in Group quarters - Other noninstitutional group quarters (%)
Residents speaking English at home (%)
Residents speaking English at home - Born in the United States (%)
Residents speaking English at home - Native, born elsewhere (%)
Residents speaking English at home - Foreign born (%)
Residents speaking Spanish at home (%)
Residents speaking Spanish at home - Born in the United States (%)
Residents speaking Spanish at home - Native, born elsewhere (%)
Residents speaking Spanish at home - Foreign born (%)
Residents speaking other language at home (%)
Residents speaking other language at home - Born in the United States (%)
Residents speaking other language at home - Native, born elsewhere (%)
Residents speaking other language at home - Foreign born (%)
Class of Workers - Employee of private company (%)
Class of Workers - Self-employed in own incorporated business (%)
Class of Workers - Private not-for-profit wage and salary workers (%)
Class of Workers - Local government workers (%)
Class of Workers - State government workers (%)
Class of Workers - Federal government workers (%)
Class of Workers - Self-employed workers in own not incorporated business and Unpaid family workers (%)
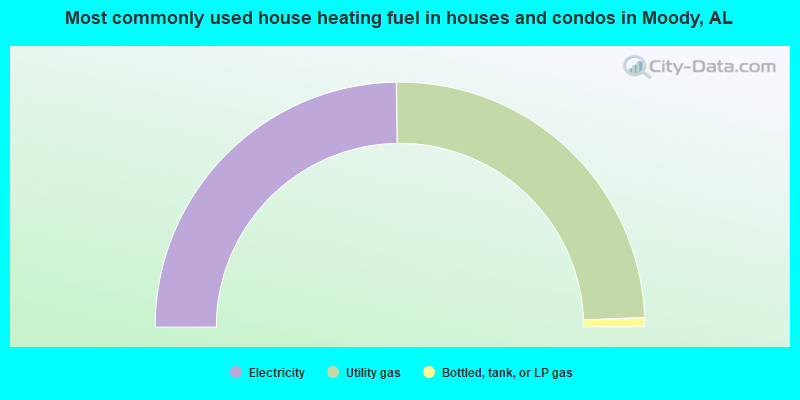
House heating fuel used in houses and condos - Utility gas (%)
House heating fuel used in houses and condos - Bottled, tank, or LP gas (%)
House heating fuel used in houses and condos - Electricity (%)
House heating fuel used in houses and condos - Fuel oil, kerosene, etc. (%)
House heating fuel used in houses and condos - Coal or coke (%)
House heating fuel used in houses and condos - Wood (%)
House heating fuel used in houses and condos - Solar energy (%)
House heating fuel used in houses and condos - Other fuel (%)
House heating fuel used in houses and condos - No fuel used (%)
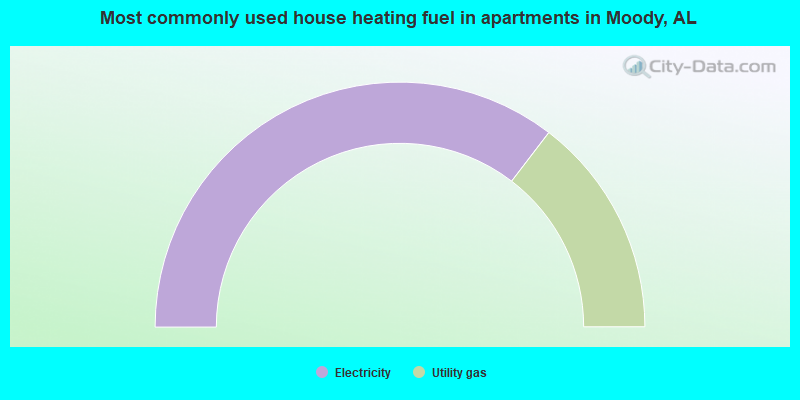
House heating fuel used in apartments - Utility gas (%)
House heating fuel used in apartments - Bottled, tank, or LP gas (%)
House heating fuel used in apartments - Electricity (%)
House heating fuel used in apartments - Fuel oil, kerosene, etc. (%)
House heating fuel used in apartments - Coal or coke (%)
House heating fuel used in apartments - Wood (%)
House heating fuel used in apartments - Solar energy (%)
House heating fuel used in apartments - Other fuel (%)
House heating fuel used in apartments - No fuel used (%)
Armed forces status - In Armed Forces (%)
Armed forces status - Civilian (%)
Armed forces status - Civilian - Veteran (%)
Armed forces status - Civilian - Nonveteran (%)
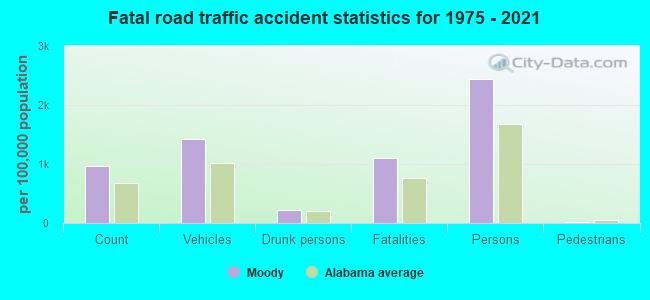
Fatal accidents locations in years 2005-2021
Fatal accidents locations in 2005
Fatal accidents locations in 2006
Fatal accidents locations in 2007
Fatal accidents locations in 2008
Fatal accidents locations in 2009
Fatal accidents locations in 2010
Fatal accidents locations in 2011
Fatal accidents locations in 2012
Fatal accidents locations in 2013
Fatal accidents locations in 2014
Fatal accidents locations in 2015
Fatal accidents locations in 2016
Fatal accidents locations in 2017
Fatal accidents locations in 2018
Fatal accidents locations in 2019
Fatal accidents locations in 2020
Fatal accidents locations in 2021
Alcohol use - People drinking some alcohol every month (%)
Alcohol use - People not drinking at all (%)
Alcohol use - Average days/month drinking alcohol
Alcohol use - Average drinks/week
Alcohol use - Average days/year people drink much
Audiometry - Average condition of hearing (%)
Audiometry - People that can hear a whisper from across a quiet room (%)
Audiometry - People that can hear normal voice from across a quiet room (%)
Audiometry - Ears ringing, roaring, buzzing (%)
Audiometry - Had a job exposure to loud noise (%)
Audiometry - Had off-work exposure to loud noise (%)
Blood Pressure & Cholesterol - Has high blood pressure (%)
Blood Pressure & Cholesterol - Checking blood pressure at home (%)
Blood Pressure & Cholesterol - Frequently checking blood cholesterol (%)
Blood Pressure & Cholesterol - Has high cholesterol level (%)
Consumer Behavior - Money monthly spent on food at supermarket/grocery store
Consumer Behavior - Money monthly spent on food at other stores
Consumer Behavior - Money monthly spent on eating out
Consumer Behavior - Money monthly spent on carryout/delivered foods
Consumer Behavior - Income spent on food at supermarket/grocery store (%)
Consumer Behavior - Income spent on food at other stores (%)
Consumer Behavior - Income spent on eating out (%)
Consumer Behavior - Income spent on carryout/delivered foods (%)
Current Health Status - General health condition (%)
Current Health Status - Blood donors (%)
Current Health Status - Has blood ever tested for HIV virus (%)
Current Health Status - Left-handed people (%)
Dermatology - People using sunscreen (%)
Diabetes - Diabetics (%)
Diabetes - Had a blood test for high blood sugar (%)
Diabetes - People taking insulin (%)
Diet Behavior & Nutrition - Diet health (%)
Diet Behavior & Nutrition - Milk product consumption (# of products/month)
Diet Behavior & Nutrition - Meals not home prepared (#/week)
Diet Behavior & Nutrition - Meals from fast food or pizza place (#/week)
Diet Behavior & Nutrition - Ready-to-eat foods (#/month)
Diet Behavior & Nutrition - Frozen meals/pizza (#/month)
Drug Use - People that ever used marijuana or hashish (%)
Drug Use - Ever used hard drugs (%)
Drug Use - Ever used any form of cocaine (%)
Drug Use - Ever used heroin (%)
Drug Use - Ever used methamphetamine (%)
Health Insurance - People covered by health insurance (%)
Kidney Conditions-Urology - Avg. # of times urinating at night
Medical Conditions - People with asthma (%)
Medical Conditions - People with anemia (%)
Medical Conditions - People with psoriasis (%)
Medical Conditions - People with overweight (%)
Medical Conditions - Elderly people having difficulties in thinking or remembering (%)
Medical Conditions - People who ever received blood transfusion (%)
Medical Conditions - People having trouble seeing even with glass/contacts (%)
Medical Conditions - People with arthritis (%)
Medical Conditions - People with gout (%)
Medical Conditions - People with congestive heart failure (%)
Medical Conditions - People with coronary heart disease (%)
Medical Conditions - People with angina pectoris (%)
Medical Conditions - People who ever had heart attack (%)
Medical Conditions - People who ever had stroke (%)
Medical Conditions - People with emphysema (%)
Medical Conditions - People with thyroid problem (%)
Medical Conditions - People with chronic bronchitis (%)
Medical Conditions - People with any liver condition (%)
Medical Conditions - People who ever had cancer or malignancy (%)
Mental Health - People who have little interest in doing things (%)
Mental Health - People feeling down, depressed, or hopeless (%)
Mental Health - People who have trouble sleeping or sleeping too much (%)
Mental Health - People feeling tired or having little energy (%)
Mental Health - People with poor appetite or overeating (%)
Mental Health - People feeling bad about themself (%)
Mental Health - People who have trouble concentrating on things (%)
Mental Health - People moving or speaking slowly or too fast (%)
Mental Health - People having thoughts they would be better off dead (%)
Oral Health - Average years since last visit a dentist
Oral Health - People embarrassed because of mouth (%)
Oral Health - People with gum disease (%)
Oral Health - General health of teeth and gums (%)
Oral Health - Average days a week using dental floss/device
Oral Health - Average days a week using mouthwash for dental problem
Oral Health - Average number of teeth
Pesticide Use - Households using pesticides to control insects (%)
Pesticide Use - Households using pesticides to kill weeds (%)
Physical Activity - People doing vigorous-intensity work activities (%)
Physical Activity - People doing moderate-intensity work activities (%)
Physical Activity - People walking or bicycling (%)
Physical Activity - People doing vigorous-intensity recreational activities (%)
Physical Activity - People doing moderate-intensity recreational activities (%)
Physical Activity - Average hours a day doing sedentary activities
Physical Activity - Average hours a day watching TV or videos
Physical Activity - Average hours a day using computer
Physical Functioning - People having limitations keeping them from working (%)
Physical Functioning - People limited in amount of work they can do (%)
Physical Functioning - People that need special equipment to walk (%)
Physical Functioning - People experiencing confusion/memory problems (%)
Physical Functioning - People requiring special healthcare equipment (%)
Prescription Medications - Average number of prescription medicines taking
Preventive Aspirin Use - Adults 40+ taking low-dose aspirin (%)
Reproductive Health - Vaginal deliveries (%)
Reproductive Health - Cesarean deliveries (%)
Reproductive Health - Deliveries resulted in a live birth (%)
Reproductive Health - Pregnancies resulted in a delivery (%)
Reproductive Health - Women breastfeeding newborns (%)
Reproductive Health - Women that had a hysterectomy (%)
Reproductive Health - Women that had both ovaries removed (%)
Reproductive Health - Women that have ever taken birth control pills (%)
Reproductive Health - Women taking birth control pills (%)
Reproductive Health - Women that have ever used Depo-Provera or injectables (%)
Reproductive Health - Women that have ever used female hormones (%)
Sexual Behavior - People 18+ that ever had sex (vaginal, anal, or oral) (%)
Sexual Behavior - Males 18+ that ever had vaginal sex with a woman (%)
Sexual Behavior - Males 18+ that ever performed oral sex on a woman (%)
Sexual Behavior - Males 18+ that ever had anal sex with a woman (%)
Sexual Behavior - Males 18+ that ever had any sex with a man (%)
Sexual Behavior - Females 18+ that ever had vaginal sex with a man (%)
Sexual Behavior - Females 18+ that ever performed oral sex on a man (%)
Sexual Behavior - Females 18+ that ever had anal sex with a man (%)
Sexual Behavior - Females 18+ that ever had any kind of sex with a woman (%)
Sexual Behavior - Average age people first had sex
Sexual Behavior - Average number of female sex partners in lifetime (males 18+)
Sexual Behavior - Average number of female vaginal sex partners in lifetime (males 18+)
Sexual Behavior - Average age people first performed oral sex on a woman (18+)
Sexual Behavior - Average number of woman performed oral sex on in lifetime (18+)
Sexual Behavior - Average number of male sex partners in lifetime (males 18+)
Sexual Behavior - Average number of male anal sex partners in lifetime (males 18+)
Sexual Behavior - Average age people first performed oral sex on a man (18+)
Sexual Behavior - Average number of male oral sex partners in lifetime (18+)
Sexual Behavior - People using protection when performing oral sex (%)
Sexual Behavior - Average number of times people have vaginal or anal sex a year
Sexual Behavior - People having sex without condom (%)
Sexual Behavior - Average number of male sex partners in lifetime (females 18+)
Sexual Behavior - Average number of male vaginal sex partners in lifetime (females 18+)
Sexual Behavior - Average number of female sex partners in lifetime (females 18+)
Sexual Behavior - Circumcised males 18+ (%)
Sleep Disorders - Average hours sleeping at night
Sleep Disorders - People that has trouble sleeping (%)
Smoking-Cigarette Use - People smoking cigarettes (%)
Taste & Smell - People 40+ having problems with smell (%)
Taste & Smell - People 40+ having problems with taste (%)
Taste & Smell - People 40+ that ever had wisdom teeth removed (%)
Taste & Smell - People 40+ that ever had tonsils teeth removed (%)
Taste & Smell - People 40+ that ever had a loss of consciousness because of a head injury (%)
Taste & Smell - People 40+ that ever had a broken nose or other serious injury to face or skull (%)
Taste & Smell - People 40+ that ever had two or more sinus infections (%)
Weight - Average height (inches)
Weight - Average weight (pounds)
Weight - Average BMI
Weight - People that are obese (%)
Weight - People that ever were obese (%)
Weight - People trying to lose weight (%)
11,225 84.0% White alone 1,017 7.6% Black alone 591 4.4% Two or more races 403 3.0% Hispanic 112 0.8% American Indian alone 23 0.2% Asian alone
According to our research of Alabama and other state lists, there were 16 registered sex offenders living in Moody, Alabama as of June 04, 2024 . The ratio of all residents to sex offenders in Moody is 783 to 1.The ratio of registered sex offenders to all residents in this city is lower than the state average.
Officers per 1,000 residents here:
2.01Alabama average:
2.40
Latest news from Moody, AL collected exclusively by city-data.com from local newspapers, TV, and radio stations
Ancestries: English (16.9%), American (15.8%), Irish (7.4%), German (6.3%), Scottish (5.6%), European (4.3%).
Current Local Time:
Land area: 23.9 square miles.
Population density: 569 people per square mile (low).
258 residents are foreign born
This town:
1.9%Alabama:
3.5%
Median real estate property taxes paid for housing units with mortgages in 2022: $765 (0.3%)Median real estate property taxes paid for housing units with no mortgage in 2022: $599 (0.3%)
Nearest city with pop. 50,000+: Birmingham, AL
Nearest city with pop. 1,000,000+: Chicago, IL
Nearest cities:
Latitude: 33.59 N, Longitude: 86.50 W
Daytime population change due to commuting: -1,326 (-9.8%)Workers who live and work in this town: 2,321 (35.6%)
Area code commonly used in this area: 205
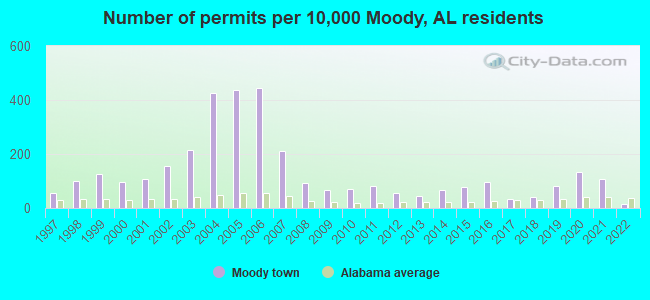
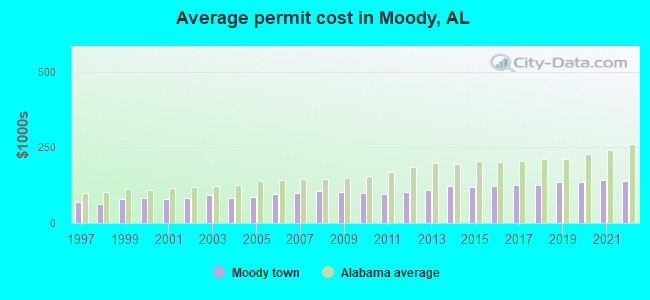
Single-family new house construction building permits:
2022: 13 buildings , average cost: $138,2002021: 86 buildings , average cost: $142,4002020: 107 buildings , average cost: $137,0002019: 65 buildings , average cost: $136,7002018: 33 buildings , average cost: $123,8002017: 28 buildings , average cost: $126,3002016: 77 buildings , average cost: $121,8002015: 64 buildings , average cost: $120,2002014: 53 buildings , average cost: $121,5002013: 36 buildings , average cost: $107,8002012: 44 buildings , average cost: $103,2002011: 66 buildings , average cost: $97,2002010: 57 buildings , average cost: $97,8002009: 55 buildings , average cost: $101,6002008: 74 buildings , average cost: $106,9002007: 170 buildings , average cost: $97,6002006: 359 buildings , average cost: $96,6002005: 351 buildings , average cost: $84,7002004: 342 buildings , average cost: $83,9002003: 173 buildings , average cost: $93,0002002: 126 buildings , average cost: $84,2002001: 86 buildings , average cost: $78,2002000: 79 buildings , average cost: $82,1001999: 101 buildings , average cost: $80,4001998: 81 buildings , average cost: $63,1001997: 46 buildings , average cost: $67,600Unemployment in December 2023:
Population change in the 1990s: +900 (+12.6%).
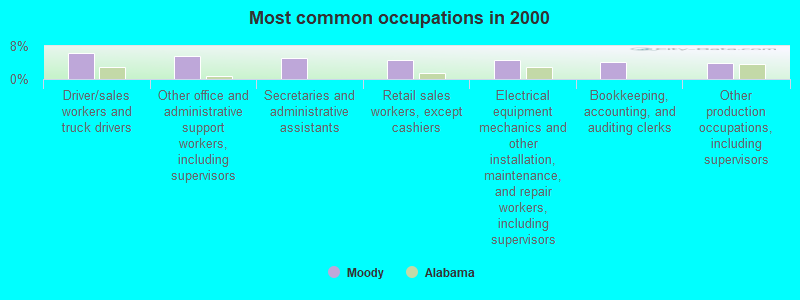
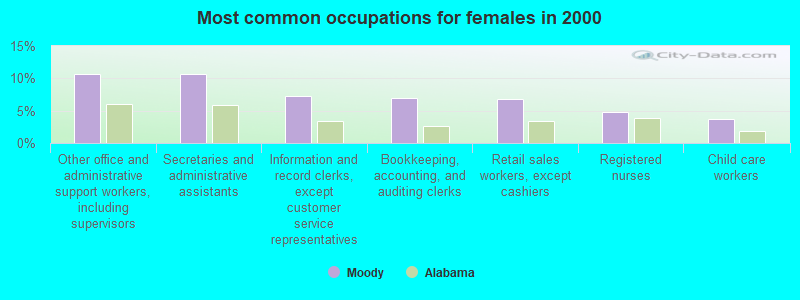
Most common occupations in Moody, AL (%)
Both Males Females
Driver/sales workers and truck drivers (6.2%)
Other office and administrative support workers, including supervisors (5.5%)
Secretaries and administrative assistants (5.1%)
Retail sales workers, except cashiers (4.6%)
Electrical equipment mechanics and other installation, maintenance, and repair workers, including supervisors (4.5%)
Bookkeeping, accounting, and auditing clerks (4.0%)
Other production occupations, including supervisors (3.9%)
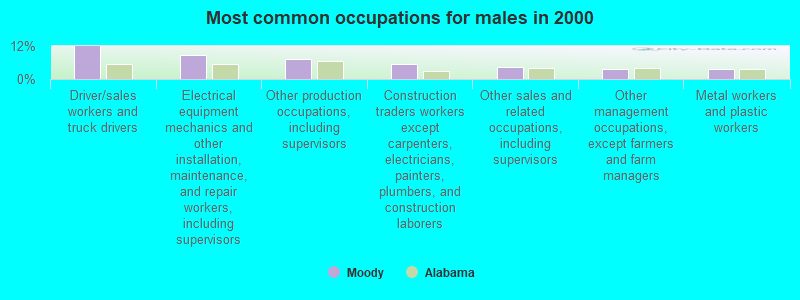
Driver/sales workers and truck drivers (11.9%)
Electrical equipment mechanics and other installation, maintenance, and repair workers, including supervisors (8.7%)
Other production occupations, including supervisors (7.2%)
Construction traders workers except carpenters, electricians, painters, plumbers, and construction laborers (5.4%)
Other sales and related occupations, including supervisors (4.2%)
Other management occupations, except farmers and farm managers (3.8%)
Metal workers and plastic workers (3.7%)
Other office and administrative support workers, including supervisors (10.7%)
Secretaries and administrative assistants (10.6%)
Information and record clerks, except customer service representatives (7.3%)
Bookkeeping, accounting, and auditing clerks (6.9%)
Retail sales workers, except cashiers (6.7%)
Registered nurses (4.8%)
Child care workers (3.7%)
Tornado activity:
Moody-area historical tornado activity is slightly above Alabama state average. It is 152% greater than the overall U.S. average.
On 4/4/1977, a category F5 (max. wind speeds 261-318 mph) tornado 11.7 miles away from the Moody town center killed 22 people and injured 130 people and caused between $5,000,000 and $50,000,000 in damages.
On 4/8/1998, a category F5 tornado 21.5 miles away from the town center killed 32 people and injured 259 people and caused $200 million in damages.
Earthquake activity:
Moody-area historical earthquake activity is significantly above Alabama state average. It is 120% greater than the overall U.S. average. On 1/18/1999 at 07:00:53, a magnitude 4.8 (4.8 MB, 4.0 LG, Depth: 0.6 mi, Class: Light, Intensity: IV - V) earthquake occurred 45.6 miles away from Moody center On 4/29/2003 at 08:59:39, a magnitude 4.9 (4.4 MB, 4.6 MW, 4.9 LG) earthquake occurred 79.7 miles away from Moody center On 4/29/2003 at 08:59:39, a magnitude 4.6 (4.6 MW, Depth: 12.3 mi) earthquake occurred 79.7 miles away from Moody center On 6/24/1975 at 11:11:36, a magnitude 4.5 (4.5 MB) earthquake occurred 77.9 miles away from the city center On 10/24/1997 at 08:35:17, a magnitude 4.9 (4.8 MB, 4.2 MS, 4.9 LG, Depth: 6.2 mi) earthquake occurred 176.7 miles away from the city center On 11/7/2004 at 11:20:21, a magnitude 4.3 (4.3 MW, Depth: 3.1 mi) earthquake occurred 105.8 miles away from the city center Magnitude types: regional Lg-wave magnitude (LG), body-wave magnitude (MB), surface-wave magnitude (MS), moment magnitude (MW) Natural disasters: The number of natural disasters in St. Clair County (3) is a lot smaller than the US average (15).Major Disasters (Presidential) Declared: 1Storms: 2, Tornadoes: 2, Flood: 1, Wind: 1, Other: 1 (Note: some incidents may be assigned to more than one category). Hospitals and medical centers near Moody: GOLDEN LIVING CENTER - TRUSSVILLE (Nursing Home, about 7 miles away; TRUSSVILLE, AL)
KIRKWOOD BY THE RIVER (Nursing Home, about 9 miles away; BIRMINGHAM, AL)
BIRMINGHAM NURSING AND REHABILITATION CENTER EAST (Nursing Home, about 11 miles away; BIRMINGHAM, AL)
DCI PELL CITY (Dialysis Facility, about 11 miles away; PELL CITY, AL)
BIRMINGHAM EAST DIALYSIS (Dialysis Facility, about 11 miles away; BIRMINGHAM, AL)
DAVITA CENTER POINT DIALYSIS (Dialysis Facility, about 12 miles away; CENTER POINT, AL)
SOUTHERN CARE BIRMINGHAM (Hospital, about 12 miles away; BIRMINGHAM, AL)
Airports located in Moody: Amtrak station near Moody: 19 miles: BIRMINGHAM (1819 MORRIS AVE.) Services: ticket office, partially wheelchair accessible, enclosed waiting area, public restrooms, public payphones, vending machines, paid short-term parking, paid long-term parking, call for taxi service.
Colleges/universities with over 2000 students nearest to Moody:
Jefferson State Community College (about 13 miles; Birmingham, AL ; Full-time enrollment: 6,041)
University of Alabama at Birmingham (about 20 miles; Birmingham, AL ; FT enrollment: 14,853)
Samford University (about 20 miles; Birmingham, AL ; FT enrollment: 3,829)
Virginia College-Birmingham (about 21 miles; Birmingham, AL ; FT enrollment: 8,167)
Lawson State Community College-Birmingham Campus (about 25 miles; Birmingham, AL ; FT enrollment: 2,695)
George C Wallace State Community College-Hanceville (about 38 miles; Hanceville, AL ; FT enrollment: 4,486)
University of Montevallo (about 40 miles; Montevallo, AL ; FT enrollment: 2,826)
Public high school in Moody: MOODY HIGH SCH Students: 632, Location: 714 HIGH SCHOOL DR, Grades: 9-12)Public elementary/middle schools in Moody: MOODY ELEM SCH Students: 736, Location: 1006 H L BLOCKER CIR, Grades: PK-3)MOODY MIDDLE SCH Students: 494, Location: 696 HIGH SCHOOL DRIVE, Grades: 4-6)MOODY JR HIGH SCH Students: 338, Location: 600 HIGH SCHOOL DRIVE, Grades: 7-8)See full list of schools located in Moody Library in Moody: MOODY - DORIS STANLEY MEMORIAL LIBRARY Operating income: $118,147; Location: 1515 BOOKMARK LANE; 19,206 books ; 281 audio materials ; 712 video materials ; 98 state licensed databases ; 33 print serial subscriptions )
User-submitted facts and corrections:
Moody is a growing community. We offer affordable new housing and a 20 minute commute to the Honda Manufacturing Plant.
Notable location: (A) . Display/hide its location on the map
Churches in Moody include: (A) , Happy Home Church (B) , Mount Olive Baptist Church (C) , Acmar Church (D) , Acmar Community Church (E) , Bethel Baptist Church (F) , Marketta Baptist Church (G) , Moody Tabernacle (H) , The Church of the Valley (I) . Display/hide their locations on the map
Cemetery: (1) . Display/hide its location on the map
Reservoirs: (A) , Halls Lake (B) , Lake Joyce (C) , Lazy V Lake (D) , James Lake (E) , Lake Melanie (F) . Display/hide their locations on the map
Streams, rivers, and creeks: (A) , Head Springs (B) , Kerr Branch (C) , Little Black Creek (D) , Hawkins Branch (E) . Display/hide their locations on the map
Park in Moody: (1) . Display/hide its location on the map
Tourist attractions: (1) , Skate Express (Arcades & Amusements; 661 Ashley Drive) (2) . Display/hide their approximate locations on the map
Hotels: (1) , Super 8 Motel (2451 Moody Parkway) (2) , Super 8 Moody (2451 Moody Parkway) (3) , James Robert CO (930 Markeeta Spur Road) (4) . Display/hide their approximate locations on the map
St. Clair County has a predicted average indoor radon screening level between 2 and 4 pCi/L (pico curies per liter) - Moderate Potential Average household size: This town:
2.5 peopleAlabama:
2.5 people
Percentage of family households: This town:
71.2%Whole state:
67.8%
Percentage of households with unmarried partners: This town:
4.0%Whole state:
4.7%
Likely homosexual households (counted as self-reported same-sex unmarried-partner households)
Lesbian couples: 0.4% of all households Gay men: 0.5% of all households
2 people in group homes intended for adults in 2010
Banks with branches in Moody (2011 data):
Metro Bank: Moody Branch at 2603 Moody Parkway, branch established on 2009/04/06. Info updated 2011/02/24: Bank assets: $627.7 mil, Deposits: $557.5 mil, headquarters in Pell City, AL, positive income , Commercial Lending Specialization, 9 total offices
Branch Banking and Trust Company: Moody Branch at 2821 Moody Pkwy, branch established on 1973/06/09. Info updated 2010/03/29: Bank assets: $168,867.6 mil, Deposits: $127,549.5 mil, headquarters in Winston Salem, NC, positive income , Commercial Lending Specialization, 1793 total offices , Holding Company: Bb&T Corporation
Covenant Bank: Moody Branch at 2460 Moody Parkway, branch established on 1999/03/01. Info updated 2011/02/24: Bank assets: $98.9 mil, Deposits: $81.7 mil, headquarters in Leeds, AL, negative income in the last year , Commercial Lending Specialization, 2 total offices , Holding Company: Covenant Bancgroup, Inc.
BancorpSouth Bank: Moody Branch at 2450 Moody Parkway, branch established on 1992/12/14. Info updated 2007/07/18: Bank assets: $12,990.3 mil, Deposits: $10,863.8 mil, headquarters in Tupelo, MS, positive income , Commercial Lending Specialization, 271 total offices , Holding Company: Bancorpsouth, Inc.
PNC Bank, National Association: Moody Branch at 2301 Moody Parkway, branch established on 1992/03/01. Info updated 2012/03/20: Bank assets: $263,309.6 mil, Deposits: $197,343.0 mil, headquarters in Wilmington, DE, positive income , Commercial Lending Specialization, 3085 total offices , Holding Company: Pnc Financial Services Group, Inc., The
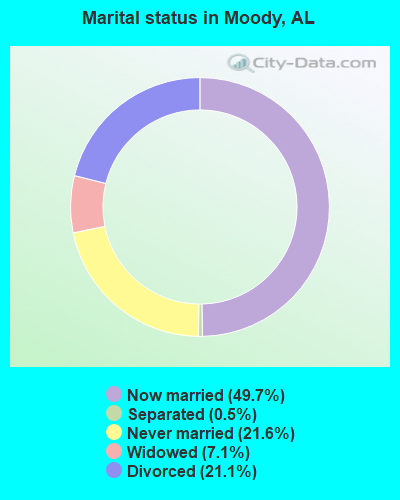
For population 15 years and over in Moody:
Never married: 21.6%Now married: 49.7%Separated: 0.5%Widowed: 7.1%Divorced: 21.1% For population 25 years and over in Moody:
High school or higher: 93.7%Bachelor's degree or higher: 23.9%Graduate or professional degree: 5.0%Unemployed: 4.2%Mean travel time to work (commute): 23.8 minutes
Education Gini index (Inequality in education) Here:
8.4Alabama average:
11.5
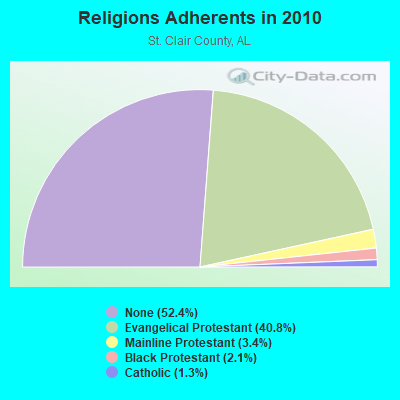
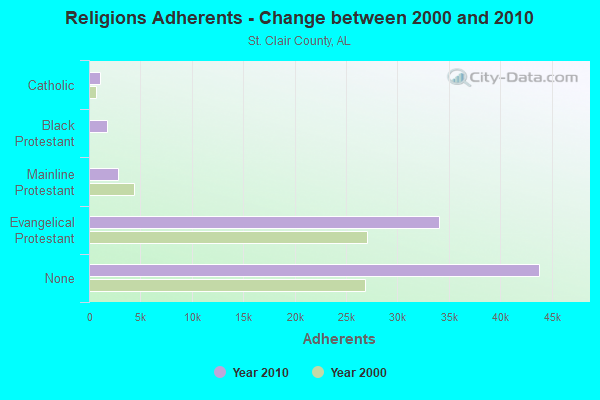
Religion statistics for Moody, AL (based on St. Clair County data)
Religion Adherents Congregations Evangelical Protestant 34,066 121 Mainline Protestant 2,856 18 Black Protestant 1,778 12 Catholic 1,056 1 Other 12 2 None 43,825 -
Source: Clifford Grammich, Kirk Hadaway, Richard Houseal, Dale E.Jones, Alexei Krindatch, Richie Stanley and Richard H.Taylor. 2012. 2010 U.S.Religion Census: Religious Congregations & Membership Study. Association of Statisticians of American Religious Bodies. Jones, Dale E., et al. 2002. Congregations and Membership in the United States 2000. Nashville, TN: Glenmary Research Center. Graphs represent county-level data
Food Environment Statistics: Number of grocery stores : 14This county :
1.79 / 10,000 pop.State :
1.89 / 10,000 pop.
Number of supercenters and club stores : 1St. Clair County :
0.13 / 10,000 pop.Alabama :
0.20 / 10,000 pop.
Number of convenience stores (no gas) : 2This county :
0.26 / 10,000 pop.Alabama :
0.65 / 10,000 pop.
Number of convenience stores (with gas) : 44This county :
5.64 / 10,000 pop.Alabama :
6.32 / 10,000 pop.
Number of full-service restaurants : 45Here :
5.77 / 10,000 pop.State :
5.75 / 10,000 pop.
Adult diabetes rate : This county :
10.7%Alabama :
11.8%
Adult obesity rate : This county :
33.9%Alabama :
31.7%
Low-income preschool obesity rate : This county :
9.2%Alabama :
13.5%
Health and Nutrition:
Average overall health of teeth and gums : People feeling badly about themselves : People not drinking alcohol at all : This city:
13.7%Alabama:
11.0%
Average hours sleeping at night : General health condition : Average condition of hearing : More about Health and Nutrition of Moody, AL Residents
Local government employment and payroll (March 2022)
Function
Full-time employees
Monthly full-time payroll
Average yearly full-time wage
Part-time employees
Monthly part-time payroll
Police Protection - Officers
24 $105,783 $52,892 3 $6,472 Firefighters
14 $65,009 $55,722 11 $13,372 Other Government Administration
7 $29,175 $50,014 5 $3,600 Parks and Recreation
7 $23,146 $39,679 11 $8,687 Streets and Highways
5 $14,510 $34,824 0 $0 Local Libraries
3 $10,744 $42,976 0 $0 Other and Unallocable
3 $11,807 $47,228 1 $2,214 Judicial and Legal
2 $7,185 $43,110 1 $1,000 Police - Other
1 $3,120 $37,440 1 $1,461 Welfare
0 $0 2 $2,243
Totals for Government
66 $270,479 $49,178 35 $39,050
Moody government finances - Expenditure in 2017 (per resident):
Current Operations - Police Protection: $1,046,000 ($76.99)
Central Staff Services: $198,000 ($14.57)Libraries: $120,000 ($8.83)Sewerage: $118,000 ($8.68)Judicial and Legal Services: $94,000 ($6.92)Financial Administration: $82,000 ($6.04)Regular Highways: $23,000 ($1.69)General - Interest on Debt: $40,000 ($2.94)
Total Salaries and Wages: $1,279,000 ($94.13)
Moody government finances - Revenue in 2017 (per resident):
Charges - Sewerage: $103,000 ($7.58)
Miscellaneous - Fines and Forfeits: $44,000 ($3.24)
Interest Earnings: $16,000 ($1.18)Tax - General Sales and Gross Receipts: $2,511,000 ($184.81)
Property: $646,000 ($47.55)Motor Fuels Sales: $285,000 ($20.98)Public Utilities Sales: $226,000 ($16.63)Tobacco Products Sales: $149,000 ($10.97)Occupation and Business License - Other: $137,000 ($10.08)Motor Vehicle License: $50,000 ($3.68)Alcoholic Beverage Sales: $28,000 ($2.06)Alcoholic Beverage License: $1,000 ($0.07)
Moody government finances - Debt in 2017 (per resident):
Long Term Debt - Beginning Outstanding - Unspecified Public Purpose: $945,000 ($69.55)
Outstanding Unspecified Public Purpose: $891,000 ($65.58)Retired Unspecified Public Purpose: $54,000 ($3.97)
Moody government finances - Cash and Securities in 2017 (per resident):
Other Funds - Cash and Securities: $400,000 ($29.44)
Businesses in Moody, AL
Name Count Name Count
Burger King 1 Super 8 1 CVS 1 U-Haul 1 FedEx 2 UPS 2 H&R Block 1 Waffle House 1 Subway 1
Strongest AM radio stations in Moody:
WURL (760 AM; daytime; 1 kW; MOODY, AL; Owner: THE BILL DAVISON EVANGELISTIC ASSOC)
WDJC (850 AM; 50 kW; BIRMINGHAM, AL; Owner: KIMTRON, INC.)
WJOX (690 AM; 50 kW; BIRMINGHAM, AL; Owner: CITADEL BROADCASTING COMPANY)
WAPI (1070 AM; 50 kW; BIRMINGHAM, AL; Owner: CITADEL BROADCASTING COMPANY)
WFHK (1430 AM; 5 kW; PELL CITY, AL; Owner: STOCKS BROADCASTING, INC.)
WLPH (1480 AM; daytime; 5 kW; IRONDALE, AL; Owner: BIRMINGHAM CHRISTIAN RADIO, INC.)
WNSI (810 AM; 50 kW; JACKSONVILLE, AL; Owner: UNITED BROADCASTING NETWORK, INC.)
WYDE (1260 AM; 5 kW; BIRMINGHAM, AL; Owner: KIMTRON, INC.)
WERC (960 AM; 5 kW; BIRMINGHAM, AL; Owner: CAPSTAR TX LIMITED PARTNERSHIP)
WKNG (1060 AM; daytime; 50 kW; TALLAPOOSA, GA; Owner: WKNG, INC.)
WRJS (1320 AM; 5 kW; BIRMINGHAM, AL; Owner: CXR HOLDINGS, INC.)
WAAX (570 AM; 5 kW; GADSDEN, AL; Owner: CAPSTAR TX LIMITED PARTNERSHIP)
WGST (640 AM; 50 kW; ATLANTA, GA; Owner: CITICASTERS LICENSES, L.P.)
Strongest FM radio stations in Moody:
WRAX (107.7 FM; BIRMINGHAM, AL; Owner: CITADEL BROADCASTING COMPANY)
WGIB (91.9 FM; BIRMINGHAM, AL; Owner: GLEN IRIS BAPTIST SCHOOL)
WBPT (106.9 FM; BIRMINGHAM, AL; Owner: CXR HOLDINGS, INC.)
WBHK (98.7 FM; WARRIOR, AL; Owner: CXR HOLDINGS, INC.)
WZZK-FM (104.7 FM; BIRMINGHAM, AL; Owner: CXR HOLDINGS, INC.)
WENN (105.9 FM; TRUSSVILLE, AL; Owner: CAPSTAR TX LIMITED PARTNERSHIP)
WBHM (90.3 FM; BIRMINGHAM, AL; Owner: BD OF TRUSTEES/U OF AL AT BIRMINGHAM)
WODL (97.3 FM; HOMEWOOD, AL; Owner: CXR HOLDINGS, INC.)
WYSF (94.5 FM; BIRMINGHAM, AL; Owner: CITADEL BROADCASTING COMPANY)
WMJJ (96.5 FM; BIRMINGHAM, AL; Owner: CAPSTAR TX LIMITED PARTNERSHIP)
WQEN (103.7 FM; GADSDEN, AL; Owner: CAPSTAR TX LIMITED PARTNERSHIP)
WTDR (92.7 FM; TALLADEGA, AL; Owner: JACOBS BROADCAST GROUP, INC.)
WLJR (88.5 FM; BIRMINGHAM, AL; Owner: BRIARWOOD PRESBYTERIAN CHURCH)
WDJC-FM (93.7 FM; BIRMINGHAM, AL; Owner: KIMTRON, INC.)
WZRR (99.5 FM; BIRMINGHAM, AL; Owner: CITADEL BROADCASTING COMPANY)
WTBJ (91.3 FM; OXFORD, AL; Owner: TRINITY CHRISTIAN ACADEMY)
WBFR (89.5 FM; BIRMINGHAM, AL; Owner: FAMILY STATIONS, INC.)
WYDE-FM (101.1 FM; CULLMAN, AL; Owner: KIMTRON, INC.)
WDXB (102.5 FM; JASPER, AL; Owner: CAPSTAR TX LIMITED PARTNERSHIP)
WVOK-FM (97.9 FM; OXFORD, AL; Owner: WOODARD BROADCASTING CO. INC.)
TV broadcast stations around Moody:
WJSU-TV (Channel 40; ANNISTON, AL; Owner: TV ALABAMA, INC.)
WBMG-LP (Channel 38; MOODY, AL; Owner: TIGER EYE BROADCASTING CORPORATION)
WIAT (Channel 42; BIRMINGHAM, AL; Owner: MEDIA GENERAL COMMUNICATIONS, INC.)
WBIQ (Channel 10; BIRMINGHAM, AL; Owner: ALABAMA EDUCATIONAL TELEVISION COMMISSION)
WBRC (Channel 6; BIRMINGHAM, AL; Owner: WBRC LICENSE, INC.)
WTTO (Channel 21; HOMEWOOD, AL; Owner: WTTO LICENSEE, LLC)
WVTM-TV (Channel 13; BIRMINGHAM, AL; Owner: BIRMINGHAM BROADCASTING (WVTM-TV), LLC)
WTJP (Channel 60; GADSDEN, AL; Owner: TRINITY BROADCASTING NETWORK)
WABM (Channel 68; BIRMINGHAM, AL; Owner: BIRMINGHAM (WABM-TV) LICENSEE, INC.)
WBXA-CA (Channel 2; BIRMINGHAM, AL; Owner: THE BOX WORLDWIDE LLC)
WPXH (Channel 44; GADSDEN, AL; Owner: PAXSON COMMUNICATIONS LICENSE COMPANY, LLC)
W27CM (Channel 27; BIRMINGHAM, AL; Owner: EQUITY BROADCASTING CORPORATION)
W46DK (Channel 46; BIRMINGHAM, AL; Owner: TRINITY BROADCASTING NETWORK)
WDBB (Channel 17; BESSEMER, AL; Owner: WDBB-TV, INC.)
WCFT-TV (Channel 33; TUSCALOOSA, AL; Owner: TV ALABAMA, INCORPORATED)
WBMA-LP (Channel 58; BIRMINGHAM, AL; Owner: TV ALABAMA, INC.)
W34BI (Channel 34; BIRMINGHAM, AL; Owner: VENTANA TELEVISION, INC.)
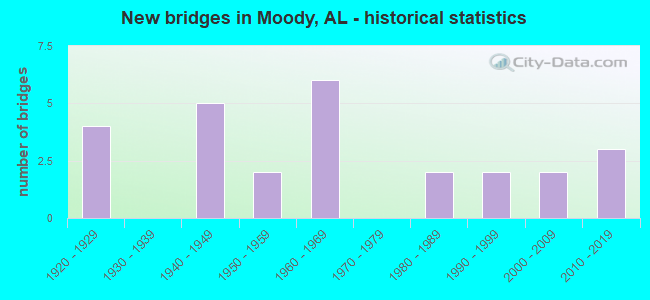
National Bridge Inventory (NBI) Statistics 26 Number of bridges243ft / 74.2m Total length $42,666,000 Total costs383,310 Total average daily traffic80,388 Total average daily truck traffic
New bridges - historical statistics
4 1920-1929 5 1940-1949 2 1950-1959 6 1960-1969 2 1980-1989 2 1990-1999 2 2000-2009 3 2010-2019
See full National Bridge Inventory statistics for Moody, AL
FCC Registered Cell Phone Towers: 1 (
See the full list of FCC Registered Cell Phone Towers in Moody )
FCC Registered Antenna Towers: 39 (
See the full list of FCC Registered Antenna Towers )
FCC Registered Broadcast Land Mobile Towers: 5
Lat: 33.586111 Lon: -86.477778, Call Sign: WQRR867, Assigned Frequencies: 466.487 MHz, 466.662 MHz, 468.987 MHz, 469.525 MHz, 469.912 MHz, Grant Date: 07/16/2013, Expiration Date: 07/16/2023, Cancellation Date: 09/16/2023, Certifier: Matt Curtis, Registrant: Sullivan Communications, 202 Business Center Drive, Birmingham, AL 35244, Phone: (205) 988-5522, Fax: (205) 988-3125, Email:
Lat: 33.594639 Lon: -86.486111, Call Sign: WQWG629, Assigned Frequencies: 463.487 MHz, 463.550 MHz, 464.350 MHz, 468.487 MHz, 469.350 MHz, Grant Date: 08/17/2015, Expiration Date: 08/17/2025, Certifier: Thomas L Greene Jr, Registrant: Falcon Direct, Inc., 36-20th Ave Nw, Birmingham, AL 35215, Phone: (205) 854-2611, Email:
Lat: 33.567583 Lon: -86.489000, Call Sign: WQZJ297, Assigned Frequencies: 464.362 MHz, 469.362 MHz, Grant Date: 06/05/2017, Expiration Date: 06/05/2027, Certifier: Jenny Eden, Registrant: Bearcom Operating LP, P.O. Box 559001, Dallas, TX 75355-9001, Phone: (800) 458-9887, Fax: (214) 355-1714, Email:
MOB, Lat: 33.580750 Lon: -86.477389, Call Sign: WRBM486, Assigned Frequencies: 467.925 MHz, 451.462 MHz, 456.462 MHz, Grant Date: 04/30/2018, Expiration Date: 04/30/2028, Certifier: Travis Mcgehee, Registrant: Bearcom Operating LLC, Dallas, TX 75355-9001, Phone: (800) 458-9887, Email:
Lat: 33.579278 Lon: -86.511472, Call Sign: WRCV680, Assigned Frequencies: 451.237 MHz, 451.337 MHz, 451.537 MHz, 452.187 MHz, 452.787 MHz, Grant Date: 02/07/2019, Expiration Date: 02/07/2029, Certifier: Edward Burton, Registrant: Bearcom Operating LLC, Dallas, TX 75355-9001, Phone: (800) 458-9887, Email:
FCC Registered Microwave Towers: 4
AL0052, 230 Franklin Gap Road (Lat: 33.569000 Lon: -86.545389), Type: Tower, Structure height: 54.9 m, Overall height: 58.8 m, Call Sign: WQMP920, Assigned Frequencies: 10835.0 MHz, 10755.0 MHz, Grant Date: 10/19/2010, Expiration Date: 10/19/2020, Cancellation Date: 02/16/2012, Certifier: Dan Mieszala, Registrant: Open Range Communications Inc., 6430 S. Fiddlers Green Circle, Suite 500, Greenwood Village, CO 80111, Phone: (303) 376-2112, Fax: (303) 376-2109, Email:
AL0053, 701 Park Avenue (Lat: 33.583306 Lon: -86.496694), Type: Tower, Structure height: 76.2 m, Overall height: 79.2 m, Call Sign: WQMP922, Assigned Frequencies: 11285.0 MHz, 11325.0 MHz, Grant Date: 10/19/2010, Expiration Date: 10/19/2020, Cancellation Date: 02/16/2012, Certifier: Dan Mieszala, Registrant: Open Range Communications Inc., 6430 S. Fiddlers Green Circle, Suite 500, Greenwood Village, CO 80111, Phone: (303) 376-2112, Fax: (303) 376-2109, Email:
AG MOODY, 230 Franklin Gap Road (Lat: 33.568972 Lon: -86.545361), Type: Tower, Structure height: 54.9 m, Overall height: 58.8 m, Call Sign: WQOC203, Assigned Frequencies: 10795.0 MHz, Grant Date: 08/08/2011, Expiration Date: 08/08/2021, Cancellation Date: 10/31/2018, Certifier: Christopher L Harris, Registrant: Conterra Ultra Broadband, LLC, 2101 Rexford Road Suite 200 E, Charlotte, NC 28211, Phone: (704) 936-1801, Fax: (704) 936-1801, Email:
BRAGGSVILLE, 701 Park Avenue (Lat: 33.583500 Lon: -86.496944), Type: Mast, Structure height: 76.2 m, Overall height: 79.2 m, Call Sign: WQVQ855, Assigned Frequencies: 11325.0 MHz, 11685.0 MHz, Grant Date: 04/17/2015, Expiration Date: 04/17/2025, Cancellation Date: 09/12/2022, Certifier: Gregory M Romano, Registrant: Verizon, 1300 I St Nw - Suite 500 East, Washington, DC 20005, Phone: (202) 515-2453, Email:
FCC Registered Amateur Radio Licenses: 53 (
See the full list of FCC Registered Amateur Radio Licenses in Moody )
FAA Registered Aircraft: 15 (
See the full list of FAA Registered Aircraft in Moody )
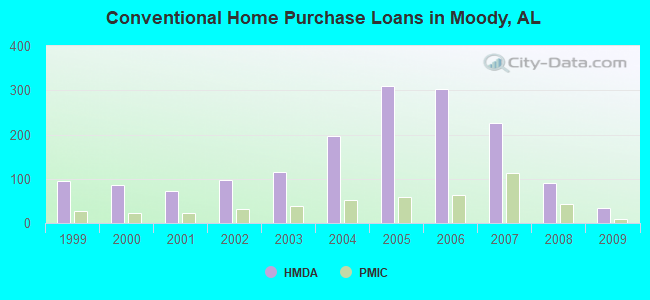
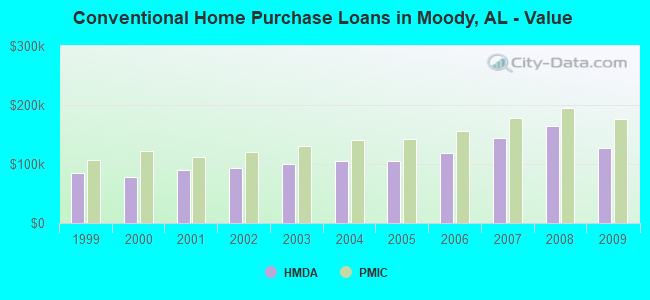
Home Mortgage Disclosure Act Aggregated Statistics For Year 2009(Based on 2 partial tracts) A) FHA, FSA/RHS & VA B) Conventional C) Refinancings D) Home Improvement Loans F) Non-occupant Loans on G) Loans On Manufactured Number Average Value Number Average Value Number Average Value Number Average Value Number Average Value Number Average Value
LOANS ORIGINATED 70 $144,007 35 $126,597 191 $155,599 6 $88,757 8 $84,579 7 $42,956 APPLICATIONS APPROVED, NOT ACCEPTED 2 $166,270 2 $179,180 14 $142,976 0 $0 1 $47,340 2 $19,750 APPLICATIONS DENIED 14 $132,695 9 $80,086 71 $151,272 5 $59,550 3 $128,933 7 $53,826 APPLICATIONS WITHDRAWN 10 $138,160 10 $157,176 84 $153,946 1 $147,600 2 $110,345 1 $40,790 FILES CLOSED FOR INCOMPLETENESS 2 $156,075 1 $156,040 16 $155,297 1 $71,370 1 $40,680 1 $64,780
Aggregated Statistics For Year 2008(Based on 2 partial tracts) A) FHA, FSA/RHS & VA B) Conventional C) Refinancings D) Home Improvement Loans F) Non-occupant Loans on G) Loans On Manufactured Number Average Value Number Average Value Number Average Value Number Average Value Number Average Value Number Average Value
LOANS ORIGINATED 67 $145,534 91 $164,284 107 $154,855 12 $34,082 6 $98,887 11 $51,505 APPLICATIONS APPROVED, NOT ACCEPTED 4 $153,108 7 $140,211 18 $156,526 4 $63,565 1 $89,460 3 $40,407 APPLICATIONS DENIED 11 $135,733 20 $159,373 88 $138,724 19 $55,097 9 $165,169 13 $57,348 APPLICATIONS WITHDRAWN 9 $140,726 13 $186,997 43 $146,338 2 $91,770 0 $0 1 $69,370 FILES CLOSED FOR INCOMPLETENESS 1 $282,390 3 $177,280 12 $155,269 1 $88,880 1 $70,930 0 $0
Aggregated Statistics For Year 2007(Based on 2 partial tracts) A) FHA, FSA/RHS & VA B) Conventional C) Refinancings D) Home Improvement Loans F) Non-occupant Loans on G) Loans On Manufactured Number Average Value Number Average Value Number Average Value Number Average Value Number Average Value Number Average Value
LOANS ORIGINATED 35 $150,239 227 $143,629 116 $118,366 23 $46,786 15 $118,243 13 $50,997 APPLICATIONS APPROVED, NOT ACCEPTED 3 $140,097 23 $127,456 19 $115,524 4 $34,930 5 $129,980 7 $43,521 APPLICATIONS DENIED 2 $175,055 25 $122,484 107 $131,393 31 $43,521 6 $76,407 15 $67,673 APPLICATIONS WITHDRAWN 3 $157,643 24 $136,961 50 $132,632 7 $46,324 3 $86,217 1 $82,550 FILES CLOSED FOR INCOMPLETENESS 0 $0 10 $172,773 14 $183,775 1 $79,260 1 $152,350 0 $0
Aggregated Statistics For Year 2006(Based on 2 partial tracts) A) FHA, FSA/RHS & VA B) Conventional C) Refinancings D) Home Improvement Loans F) Non-occupant Loans on G) Loans On Manufactured Number Average Value Number Average Value Number Average Value Number Average Value Number Average Value Number Average Value
LOANS ORIGINATED 39 $138,433 303 $118,638 112 $115,977 23 $31,258 23 $101,203 18 $52,850 APPLICATIONS APPROVED, NOT ACCEPTED 2 $170,580 37 $84,018 19 $118,794 4 $31,972 2 $116,625 6 $46,692 APPLICATIONS DENIED 4 $124,978 41 $93,469 81 $117,520 24 $45,977 3 $134,830 16 $53,289 APPLICATIONS WITHDRAWN 4 $142,252 29 $110,400 52 $129,130 9 $81,046 4 $212,102 3 $63,940 FILES CLOSED FOR INCOMPLETENESS 1 $79,810 14 $121,781 23 $133,868 2 $103,285 0 $0 1 $52,670
Aggregated Statistics For Year 2005(Based on 2 partial tracts) A) FHA, FSA/RHS & VA B) Conventional C) Refinancings D) Home Improvement Loans F) Non-occupant Loans on G) Loans On Manufactured Number Average Value Number Average Value Number Average Value Number Average Value Number Average Value Number Average Value
LOANS ORIGINATED 35 $134,639 310 $105,142 109 $124,336 17 $43,238 18 $93,083 13 $63,857 APPLICATIONS APPROVED, NOT ACCEPTED 3 $128,407 30 $91,853 22 $103,458 3 $47,337 1 $52,640 7 $49,017 APPLICATIONS DENIED 7 $101,831 38 $72,033 81 $109,710 20 $50,940 3 $54,183 24 $57,482 APPLICATIONS WITHDRAWN 1 $102,350 30 $100,037 75 $122,894 10 $135,800 5 $94,262 5 $61,006 FILES CLOSED FOR INCOMPLETENESS 1 $89,700 7 $110,736 16 $122,811 3 $28,393 1 $106,790 1 $44,950
Aggregated Statistics For Year 2004(Based on 2 partial tracts) A) FHA, FSA/RHS & VA B) Conventional C) Refinancings D) Home Improvement Loans F) Non-occupant Loans on G) Loans On Manufactured Number Average Value Number Average Value Number Average Value Number Average Value Number Average Value Number Average Value
LOANS ORIGINATED 26 $119,246 196 $105,043 129 $104,991 12 $38,733 17 $80,570 17 $57,147 APPLICATIONS APPROVED, NOT ACCEPTED 1 $83,870 21 $89,434 26 $99,561 2 $58,375 1 $125,830 8 $60,572 APPLICATIONS DENIED 3 $101,110 37 $72,226 69 $92,113 19 $50,163 2 $39,025 27 $53,647 APPLICATIONS WITHDRAWN 2 $112,200 21 $108,024 29 $97,992 5 $66,154 3 $66,633 4 $74,492 FILES CLOSED FOR INCOMPLETENESS 0 $0 7 $97,110 44 $111,726 1 $31,990 0 $0 4 $75,358
Aggregated Statistics For Year 2003(Based on 2 partial tracts) A) FHA, FSA/RHS & VA B) Conventional C) Refinancings D) Home Improvement Loans F) Non-occupant Loans on Number Average Value Number Average Value Number Average Value Number Average Value Number Average Value
LOANS ORIGINATED 24 $120,584 115 $99,895 220 $102,250 12 $31,662 6 $78,577 APPLICATIONS APPROVED, NOT ACCEPTED 0 $0 10 $102,286 35 $96,907 1 $31,070 0 $0 APPLICATIONS DENIED 2 $30,545 30 $64,836 102 $96,327 12 $27,313 1 $121,110 APPLICATIONS WITHDRAWN 1 $104,890 8 $123,801 52 $103,122 2 $85,870 1 $61,910 FILES CLOSED FOR INCOMPLETENESS 0 $0 6 $97,995 13 $107,228 2 $74,985 0 $0
Aggregated Statistics For Year 2002(Based on 2 partial tracts) A) FHA, FSA/RHS & VA B) Conventional C) Refinancings D) Home Improvement Loans F) Non-occupant Loans on Number Average Value Number Average Value Number Average Value Number Average Value Number Average Value
LOANS ORIGINATED 20 $120,202 97 $93,795 156 $93,793 13 $18,459 4 $65,568 APPLICATIONS APPROVED, NOT ACCEPTED 2 $67,395 12 $76,978 23 $85,434 1 $19,690 0 $0 APPLICATIONS DENIED 3 $96,497 40 $51,522 55 $83,255 9 $35,417 1 $78,050 APPLICATIONS WITHDRAWN 3 $120,707 9 $114,229 45 $90,936 1 $27,030 0 $0 FILES CLOSED FOR INCOMPLETENESS 1 $100,240 4 $98,410 15 $100,724 0 $0 1 $27,520
Aggregated Statistics For Year 2001(Based on 2 partial tracts) A) FHA, FSA/RHS & VA B) Conventional C) Refinancings D) Home Improvement Loans F) Non-occupant Loans on Number Average Value Number Average Value Number Average Value Number Average Value Number Average Value
LOANS ORIGINATED 24 $105,288 72 $89,949 120 $92,101 14 $20,600 6 $64,580 APPLICATIONS APPROVED, NOT ACCEPTED 1 $96,920 24 $43,928 11 $77,570 2 $51,730 0 $0 APPLICATIONS DENIED 0 $0 48 $52,880 50 $76,998 7 $18,316 2 $67,155 APPLICATIONS WITHDRAWN 2 $80,075 7 $82,739 29 $97,705 2 $12,630 1 $64,530 FILES CLOSED FOR INCOMPLETENESS 0 $0 2 $72,890 10 $92,774 0 $0 0 $0
Aggregated Statistics For Year 2000(Based on 2 partial tracts) A) FHA, FSA/RHS & VA B) Conventional C) Refinancings D) Home Improvement Loans F) Non-occupant Loans on Number Average Value Number Average Value Number Average Value Number Average Value Number Average Value
LOANS ORIGINATED 19 $100,096 85 $77,268 44 $75,148 20 $14,567 4 $59,798 APPLICATIONS APPROVED, NOT ACCEPTED 3 $58,363 15 $55,180 10 $56,055 2 $25,390 1 $18,860 APPLICATIONS DENIED 2 $61,615 68 $39,616 31 $73,255 5 $19,812 2 $74,020 APPLICATIONS WITHDRAWN 2 $88,300 9 $71,956 16 $76,172 0 $0 0 $0 FILES CLOSED FOR INCOMPLETENESS 0 $0 2 $97,310 13 $94,590 0 $0 0 $0
Aggregated Statistics For Year 1999(Based on 2 partial tracts) A) FHA, FSA/RHS & VA B) Conventional C) Refinancings D) Home Improvement Loans F) Non-occupant Loans on Number Average Value Number Average Value Number Average Value Number Average Value Number Average Value
LOANS ORIGINATED 23 $102,392 95 $84,044 63 $82,651 15 $15,239 5 $144,960 APPLICATIONS APPROVED, NOT ACCEPTED 0 $0 31 $51,598 11 $63,962 3 $17,287 1 $27,720 APPLICATIONS DENIED 2 $83,015 91 $42,165 35 $62,662 11 $12,168 5 $43,358 APPLICATIONS WITHDRAWN 1 $113,250 11 $79,456 13 $74,522 1 $14,020 0 $0 FILES CLOSED FOR INCOMPLETENESS 0 $0 2 $60,050 14 $66,561 0 $0 1 $56,350
Detailed HMDA statistics for the following Tracts:
0401.01
, 0401.02
Private Mortgage Insurance Companies Aggregated Statistics For Year 2009(Based on 2 partial tracts) A) Conventional B) Refinancings Number Average Value Number Average Value
LOANS ORIGINATED 9 $175,742 15 $174,673 APPLICATIONS APPROVED, NOT ACCEPTED 1 $253,850 4 $198,835 APPLICATIONS DENIED 1 $81,610 1 $161,260 APPLICATIONS WITHDRAWN 0 $0 1 $98,690 FILES CLOSED FOR INCOMPLETENESS 0 $0 2 $118,635
Aggregated Statistics For Year 2008(Based on 2 partial tracts) A) Conventional B) Refinancings C) Non-occupant Loans on D) Loans On Manufactured Number Average Value Number Average Value Number Average Value Number Average Value
LOANS ORIGINATED 44 $194,301 19 $204,528 1 $176,250 1 $30,600 APPLICATIONS APPROVED, NOT ACCEPTED 15 $186,933 7 $179,416 2 $211,670 0 $0 APPLICATIONS DENIED 1 $269,570 2 $245,625 1 $212,150 0 $0 APPLICATIONS WITHDRAWN 3 $228,733 1 $82,550 0 $0 0 $0 FILES CLOSED FOR INCOMPLETENESS 0 $0 0 $0 0 $0 0 $0
Aggregated Statistics For Year 2007(Based on 2 partial tracts) A) Conventional B) Refinancings C) Non-occupant Loans on D) Loans On Manufactured Number Average Value Number Average Value Number Average Value Number Average Value
LOANS ORIGINATED 113 $177,307 22 $172,404 5 $210,946 1 $30,240 APPLICATIONS APPROVED, NOT ACCEPTED 5 $229,180 3 $208,630 0 $0 0 $0 APPLICATIONS DENIED 0 $0 1 $261,030 0 $0 0 $0 APPLICATIONS WITHDRAWN 5 $199,638 1 $238,880 1 $188,400 0 $0 FILES CLOSED FOR INCOMPLETENESS 0 $0 0 $0 0 $0 0 $0
Aggregated Statistics For Year 2006(Based on 2 partial tracts) A) Conventional B) Refinancings C) Non-occupant Loans on D) Loans On Manufactured Number Average Value Number Average Value Number Average Value Number Average Value
LOANS ORIGINATED 64 $156,191 11 $164,775 2 $80,845 1 $54,200 APPLICATIONS APPROVED, NOT ACCEPTED 7 $178,207 1 $296,350 0 $0 0 $0 APPLICATIONS DENIED 0 $0 0 $0 0 $0 0 $0 APPLICATIONS WITHDRAWN 1 $187,470 2 $170,425 0 $0 0 $0 FILES CLOSED FOR INCOMPLETENESS 0 $0 0 $0 0 $0 0 $0
Aggregated Statistics For Year 2005(Based on 2 partial tracts) A) Conventional B) Refinancings C) Non-occupant Loans on Number Average Value Number Average Value Number Average Value
LOANS ORIGINATED 58 $141,608 12 $134,589 4 $109,030 APPLICATIONS APPROVED, NOT ACCEPTED 3 $169,757 2 $149,925 0 $0 APPLICATIONS DENIED 0 $0 0 $0 0 $0 APPLICATIONS WITHDRAWN 3 $128,287 2 $89,095 0 $0 FILES CLOSED FOR INCOMPLETENESS 0 $0 0 $0 0 $0
Aggregated Statistics For Year 2004(Based on 2 partial tracts) A) Conventional B) Refinancings C) Non-occupant Loans on D) Loans On Manufactured Number Average Value Number Average Value Number Average Value Number Average Value
LOANS ORIGINATED 51 $140,198 17 $133,794 1 $91,600 1 $67,740 APPLICATIONS APPROVED, NOT ACCEPTED 6 $105,345 3 $118,127 0 $0 0 $0 APPLICATIONS DENIED 1 $100,140 0 $0 0 $0 0 $0 APPLICATIONS WITHDRAWN 3 $112,343 1 $164,270 0 $0 0 $0 FILES CLOSED FOR INCOMPLETENESS 0 $0 0 $0 0 $0 0 $0
Aggregated Statistics For Year 2003(Based on 2 partial tracts) A) Conventional B) Refinancings Number Average Value Number Average Value
LOANS ORIGINATED 39 $130,062 34 $124,415 APPLICATIONS APPROVED, NOT ACCEPTED 5 $141,656 11 $114,001 APPLICATIONS DENIED 0 $0 1 $58,010 APPLICATIONS WITHDRAWN 2 $76,450 4 $114,210 FILES CLOSED FOR INCOMPLETENESS 0 $0 0 $0
Aggregated Statistics For Year 2002(Based on 2 partial tracts) A) Conventional B) Refinancings C) Non-occupant Loans on Number Average Value Number Average Value Number Average Value
LOANS ORIGINATED 32 $120,902 31 $113,748 1 $108,910 APPLICATIONS APPROVED, NOT ACCEPTED 2 $104,690 2 $154,780 0 $0 APPLICATIONS DENIED 0 $0 0 $0 0 $0 APPLICATIONS WITHDRAWN 1 $130,120 3 $119,333 1 $80,670 FILES CLOSED FOR INCOMPLETENESS 0 $0 0 $0 0 $0
Aggregated Statistics For Year 2001(Based on 2 partial tracts) A) Conventional B) Refinancings Number Average Value Number Average Value
LOANS ORIGINATED 23 $111,610 15 $113,268 APPLICATIONS APPROVED, NOT ACCEPTED 1 $174,180 3 $97,043 APPLICATIONS DENIED 0 $0 0 $0 APPLICATIONS WITHDRAWN 1 $103,750 0 $0 FILES CLOSED FOR INCOMPLETENESS 0 $0 0 $0
Aggregated Statistics For Year 2000(Based on 2 partial tracts) A) Conventional B) Refinancings Number Average Value Number Average Value
LOANS ORIGINATED 22 $121,522 7 $99,947 APPLICATIONS APPROVED, NOT ACCEPTED 3 $116,287 1 $90,510 APPLICATIONS DENIED 0 $0 0 $0 APPLICATIONS WITHDRAWN 1 $142,380 0 $0 FILES CLOSED FOR INCOMPLETENESS 0 $0 0 $0
Aggregated Statistics For Year 1999(Based on 2 partial tracts) A) Conventional B) Refinancings Number Average Value Number Average Value
LOANS ORIGINATED 27 $107,119 12 $96,926 APPLICATIONS APPROVED, NOT ACCEPTED 1 $56,410 1 $101,330 APPLICATIONS DENIED 0 $0 1 $85,330 APPLICATIONS WITHDRAWN 0 $0 0 $0 FILES CLOSED FOR INCOMPLETENESS 1 $36,940 2 $98,120
Detailed PMIC statistics for the following Tracts:
0401.01
, 0401.02
Most common first names in Moody, AL among deceased individuals Name Count Lived (average)
James 26 76.6 years William 24 72.2 years John 19 75.9 years Charles 16 72.0 years Mary 15 75.5 years Robert 14 69.6 years Virginia 9 74.6 years Mildred 8 85.5 years David 8 58.5 years Dorothy 8 75.9 years
Most common last names in Moody, AL among deceased individuals Last name Count Lived (average)
Smith 15 74.9 years Johnson 10 70.4 years Davis 7 57.6 years Jones 7 77.7 years Taylor 7 85.0 years Lee 7 79.9 years Robinson 5 74.6 years Moore 5 61.8 years Williams 5 78.7 years Evans 5 64.4 years
Moody compared to Alabama state average:
Unemployed percentage significantly below state average. Black race population percentage below state average. Median age below state average. House age below state average.
#38 on the list of "Top 101 cities with largest percentage of males in industries: transportation and warehousing (population 5,000+)"
#7 on the list of "Top 101 counties with highest percentage of residents voting for Romney (Republican) in the 2012 Presidential Election (pop. 50,000+)"
#34 on the list of "Top 101 counties with the smallest number of people without health insurance coverage in 2000 (pop. 50,000+)"
#41 on the list of "Top 101 counties with the lowest surface withdrawal of fresh water for public supply (pop. 50,000+)"
Top Patent Applicants
Joshua Charles Wilson (4)
Paul Zelazny (4)
Paul F. Zelazny (3)
James Mitchell Leith, Sr. (2)
John M. Scelsi (2)
Tommy W. Gill (2)
Ryan R. Butler (2)
John Michael Scelsi (1)
Patricia L. Jackson (1)
Michael B. Moyer (1)
Total of 31 patent applications in 2008-2024.

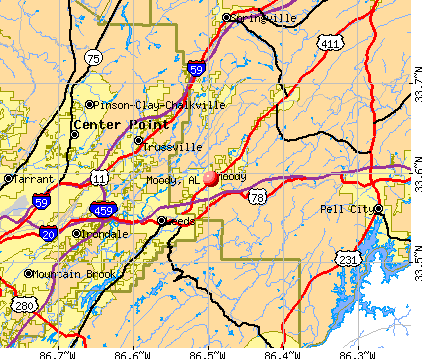


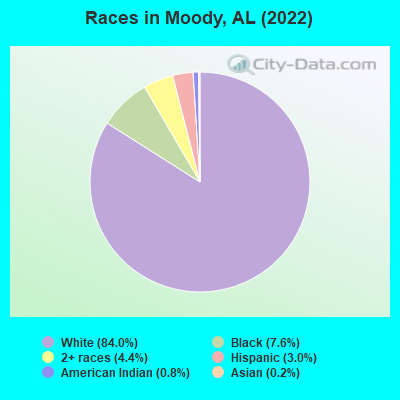
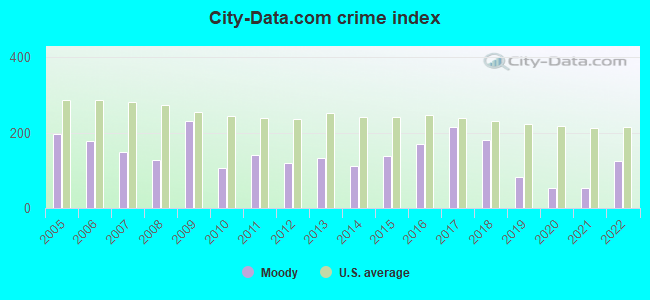
 Recent articles from our blog. Our writers, many of them Ph.D. graduates or candidates, create easy-to-read articles on a wide variety of topics.

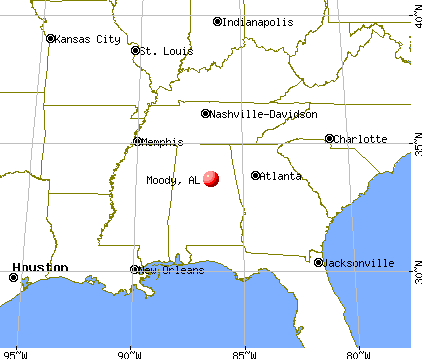
 (18.8 miles