Stokesdale, North Carolina Submit your own pictures of this town and show them to the world
OSM Map
General Map
Google Map
MSN Map
OSM Map
General Map
Google Map
MSN Map
OSM Map
General Map
Google Map
MSN Map
OSM Map
General Map
Google Map
MSN Map
Please wait while loading the map...
Population in 2022: 5,993 (22% urban, 78% rural). Population change since 2000: +83.4%Males: 3,040 Females: 2,953
March 2022 cost of living index in Stokesdale: 78.4 (low, U.S. average is 100) Percentage of residents living in poverty in 2022: 4.7%for White Non-Hispanic residents , 21.6% for Hispanic or Latino residents , 100.0% for other race residents )Business Search - 14 Million verified businesses
Data:
Median household income ($)
Median household income (% change since 2000)
Household income diversity
Ratio of average income to average house value (%)
Ratio of average income to average rent
Median household income ($) - White
Median household income ($) - Black or African American
Median household income ($) - Asian
Median household income ($) - Hispanic or Latino
Median household income ($) - American Indian and Alaska Native
Median household income ($) - Multirace
Median household income ($) - Other Race
Median household income for houses/condos with a mortgage ($)
Median household income for apartments without a mortgage ($)
Races - White alone (%)
Races - White alone (% change since 2000)
Races - Black alone (%)
Races - Black alone (% change since 2000)
Races - American Indian alone (%)
Races - American Indian alone (% change since 2000)
Races - Asian alone (%)
Races - Asian alone (% change since 2000)
Races - Hispanic (%)
Races - Hispanic (% change since 2000)
Races - Native Hawaiian and Other Pacific Islander alone (%)
Races - Native Hawaiian and Other Pacific Islander alone (% change since 2000)
Races - Two or more races (%)
Races - Two or more races (% change since 2000)
Races - Other race alone (%)
Races - Other race alone (% change since 2000)
Racial diversity
Unemployment (%)
Unemployment (% change since 2000)
Unemployment (%) - White
Unemployment (%) - Black or African American
Unemployment (%) - Asian
Unemployment (%) - Hispanic or Latino
Unemployment (%) - American Indian and Alaska Native
Unemployment (%) - Multirace
Unemployment (%) - Other Race
Population density (people per square mile)
Population - Males (%)
Population - Females (%)
Population - Males (%) - White
Population - Males (%) - Black or African American
Population - Males (%) - Asian
Population - Males (%) - Hispanic or Latino
Population - Males (%) - American Indian and Alaska Native
Population - Males (%) - Multirace
Population - Males (%) - Other Race
Population - Females (%) - White
Population - Females (%) - Black or African American
Population - Females (%) - Asian
Population - Females (%) - Hispanic or Latino
Population - Females (%) - American Indian and Alaska Native
Population - Females (%) - Multirace
Population - Females (%) - Other Race
Coronavirus confirmed cases (Jun 08, 2024)
Deaths caused by coronavirus (Jun 08, 2024)
Coronavirus confirmed cases (per 100k population) (Jun 08, 2024)
Deaths caused by coronavirus (per 100k population) (Jun 08, 2024)
Daily increase in number of cases (Jun 08, 2024)
Weekly increase in number of cases (Jun 08, 2024)
Cases doubled (in days) (Jun 08, 2024)
Hospitalized patients (Apr 18, 2022)
Negative test results (Apr 18, 2022)
Total test results (Apr 18, 2022)
COVID Vaccine doses distributed (per 100k population) (Sep 19, 2023)
COVID Vaccine doses administered (per 100k population) (Sep 19, 2023)
COVID Vaccine doses distributed (Sep 19, 2023)
COVID Vaccine doses administered (Sep 19, 2023)
Likely homosexual households (%)
Likely homosexual households (% change since 2000)
Likely homosexual households - Lesbian couples (%)
Likely homosexual households - Lesbian couples (% change since 2000)
Likely homosexual households - Gay men (%)
Likely homosexual households - Gay men (% change since 2000)
Cost of living index
Median gross rent ($)
Median contract rent ($)
Median monthly housing costs ($)
Median house or condo value ($)
Median house or condo value ($ change since 2000)
Mean house or condo value by units in structure - 1, detached ($)
Mean house or condo value by units in structure - 1, attached ($)
Mean house or condo value by units in structure - 2 ($)
Mean house or condo value by units in structure by units in structure - 3 or 4 ($)
Mean house or condo value by units in structure - 5 or more ($)
Mean house or condo value by units in structure - Boat, RV, van, etc. ($)
Mean house or condo value by units in structure - Mobile home ($)
Median house or condo value ($) - White
Median house or condo value ($) - Black or African American
Median house or condo value ($) - Asian
Median house or condo value ($) - Hispanic or Latino
Median house or condo value ($) - American Indian and Alaska Native
Median house or condo value ($) - Multirace
Median house or condo value ($) - Other Race
Median resident age
Resident age diversity
Median resident age - Males
Median resident age - Females
Median resident age - White
Median resident age - Black or African American
Median resident age - Asian
Median resident age - Hispanic or Latino
Median resident age - American Indian and Alaska Native
Median resident age - Multirace
Median resident age - Other Race
Median resident age - Males - White
Median resident age - Males - Black or African American
Median resident age - Males - Asian
Median resident age - Males - Hispanic or Latino
Median resident age - Males - American Indian and Alaska Native
Median resident age - Males - Multirace
Median resident age - Males - Other Race
Median resident age - Females - White
Median resident age - Females - Black or African American
Median resident age - Females - Asian
Median resident age - Females - Hispanic or Latino
Median resident age - Females - American Indian and Alaska Native
Median resident age - Females - Multirace
Median resident age - Females - Other Race
Commute - mean travel time to work (minutes)
Travel time to work - Less than 5 minutes (%)
Travel time to work - Less than 5 minutes (% change since 2000)
Travel time to work - 5 to 9 minutes (%)
Travel time to work - 5 to 9 minutes (% change since 2000)
Travel time to work - 10 to 19 minutes (%)
Travel time to work - 10 to 19 minutes (% change since 2000)
Travel time to work - 20 to 29 minutes (%)
Travel time to work - 20 to 29 minutes (% change since 2000)
Travel time to work - 30 to 39 minutes (%)
Travel time to work - 30 to 39 minutes (% change since 2000)
Travel time to work - 40 to 59 minutes (%)
Travel time to work - 40 to 59 minutes (% change since 2000)
Travel time to work - 60 to 89 minutes (%)
Travel time to work - 60 to 89 minutes (% change since 2000)
Travel time to work - 90 or more minutes (%)
Travel time to work - 90 or more minutes (% change since 2000)
Marital status - Never married (%)
Marital status - Now married (%)
Marital status - Separated (%)
Marital status - Widowed (%)
Marital status - Divorced (%)
Median family income ($)
Median family income (% change since 2000)
Median non-family income ($)
Median non-family income (% change since 2000)
Median per capita income ($)
Median per capita income (% change since 2000)
Median family income ($) - White
Median family income ($) - Black or African American
Median family income ($) - Asian
Median family income ($) - Hispanic or Latino
Median family income ($) - American Indian and Alaska Native
Median family income ($) - Multirace
Median family income ($) - Other Race
Median year house/condo built
Median year apartment built
Year house built - Built 2005 or later (%)
Year house built - Built 2000 to 2004 (%)
Year house built - Built 1990 to 1999 (%)
Year house built - Built 1980 to 1989 (%)
Year house built - Built 1970 to 1979 (%)
Year house built - Built 1960 to 1969 (%)
Year house built - Built 1950 to 1959 (%)
Year house built - Built 1940 to 1949 (%)
Year house built - Built 1939 or earlier (%)
Average household size
Household density (households per square mile)
Average household size - White
Average household size - Black or African American
Average household size - Asian
Average household size - Hispanic or Latino
Average household size - American Indian and Alaska Native
Average household size - Multirace
Average household size - Other Race
Occupied housing units (%)
Vacant housing units (%)
Owner occupied housing units (%)
Renter occupied housing units (%)
Vacancy status - For rent (%)
Vacancy status - For sale only (%)
Vacancy status - Rented or sold, not occupied (%)
Vacancy status - For seasonal, recreational, or occasional use (%)
Vacancy status - For migrant workers (%)
Vacancy status - Other vacant (%)
Residents with income below the poverty level (%)
Residents with income below 50% of the poverty level (%)
Children below poverty level (%)
Poor families by family type - Married-couple family (%)
Poor families by family type - Male, no wife present (%)
Poor families by family type - Female, no husband present (%)
Poverty status for native-born residents (%)
Poverty status for foreign-born residents (%)
Poverty among high school graduates not in families (%)
Poverty among people who did not graduate high school not in families (%)
Residents with income below the poverty level (%) - White
Residents with income below the poverty level (%) - Black or African American
Residents with income below the poverty level (%) - Asian
Residents with income below the poverty level (%) - Hispanic or Latino
Residents with income below the poverty level (%) - American Indian and Alaska Native
Residents with income below the poverty level (%) - Multirace
Residents with income below the poverty level (%) - Other Race
Air pollution - Air Quality Index (AQI)
Air pollution - CO
Air pollution - NO2
Air pollution - SO2
Air pollution - Ozone
Air pollution - PM10
Air pollution - PM25
Air pollution - Pb
Crime - Murders per 100,000 population
Crime - Rapes per 100,000 population
Crime - Robberies per 100,000 population
Crime - Assaults per 100,000 population
Crime - Burglaries per 100,000 population
Crime - Thefts per 100,000 population
Crime - Auto thefts per 100,000 population
Crime - Arson per 100,000 population
Crime - City-data.com crime index
Crime - Violent crime index
Crime - Property crime index
Crime - Murders per 100,000 population (5 year average)
Crime - Rapes per 100,000 population (5 year average)
Crime - Robberies per 100,000 population (5 year average)
Crime - Assaults per 100,000 population (5 year average)
Crime - Burglaries per 100,000 population (5 year average)
Crime - Thefts per 100,000 population (5 year average)
Crime - Auto thefts per 100,000 population (5 year average)
Crime - Arson per 100,000 population (5 year average)
Crime - City-data.com crime index (5 year average)
Crime - Violent crime index (5 year average)
Crime - Property crime index (5 year average)
1996 Presidential Elections Results (%) - Democratic Party (Clinton)
1996 Presidential Elections Results (%) - Republican Party (Dole)
1996 Presidential Elections Results (%) - Other
2000 Presidential Elections Results (%) - Democratic Party (Gore)
2000 Presidential Elections Results (%) - Republican Party (Bush)
2000 Presidential Elections Results (%) - Other
2004 Presidential Elections Results (%) - Democratic Party (Kerry)
2004 Presidential Elections Results (%) - Republican Party (Bush)
2004 Presidential Elections Results (%) - Other
2008 Presidential Elections Results (%) - Democratic Party (Obama)
2008 Presidential Elections Results (%) - Republican Party (McCain)
2008 Presidential Elections Results (%) - Other
2012 Presidential Elections Results (%) - Democratic Party (Obama)
2012 Presidential Elections Results (%) - Republican Party (Romney)
2012 Presidential Elections Results (%) - Other
2016 Presidential Elections Results (%) - Democratic Party (Clinton)
2016 Presidential Elections Results (%) - Republican Party (Trump)
2016 Presidential Elections Results (%) - Other
2020 Presidential Elections Results (%) - Democratic Party (Biden)
2020 Presidential Elections Results (%) - Republican Party (Trump)
2020 Presidential Elections Results (%) - Other
Ancestries Reported - Arab (%)
Ancestries Reported - Czech (%)
Ancestries Reported - Danish (%)
Ancestries Reported - Dutch (%)
Ancestries Reported - English (%)
Ancestries Reported - French (%)
Ancestries Reported - French Canadian (%)
Ancestries Reported - German (%)
Ancestries Reported - Greek (%)
Ancestries Reported - Hungarian (%)
Ancestries Reported - Irish (%)
Ancestries Reported - Italian (%)
Ancestries Reported - Lithuanian (%)
Ancestries Reported - Norwegian (%)
Ancestries Reported - Polish (%)
Ancestries Reported - Portuguese (%)
Ancestries Reported - Russian (%)
Ancestries Reported - Scotch-Irish (%)
Ancestries Reported - Scottish (%)
Ancestries Reported - Slovak (%)
Ancestries Reported - Subsaharan African (%)
Ancestries Reported - Swedish (%)
Ancestries Reported - Swiss (%)
Ancestries Reported - Ukrainian (%)
Ancestries Reported - United States (%)
Ancestries Reported - Welsh (%)
Ancestries Reported - West Indian (%)
Ancestries Reported - Other (%)
Educational Attainment - No schooling completed (%)
Educational Attainment - Less than high school (%)
Educational Attainment - High school or equivalent (%)
Educational Attainment - Less than 1 year of college (%)
Educational Attainment - 1 or more years of college (%)
Educational Attainment - Associate degree (%)
Educational Attainment - Bachelor's degree (%)
Educational Attainment - Master's degree (%)
Educational Attainment - Professional school degree (%)
Educational Attainment - Doctorate degree (%)
School Enrollment - Nursery, preschool (%)
School Enrollment - Kindergarten (%)
School Enrollment - Grade 1 to 4 (%)
School Enrollment - Grade 5 to 8 (%)
School Enrollment - Grade 9 to 12 (%)
School Enrollment - College undergrad (%)
School Enrollment - Graduate or professional (%)
School Enrollment - Not enrolled in school (%)
School enrollment - Public schools (%)
School enrollment - Private schools (%)
School enrollment - Not enrolled (%)
Median number of rooms in houses and condos
Median number of rooms in apartments
Housing units lacking complete plumbing facilities (%)
Housing units lacking complete kitchen facilities (%)
Density of houses
Urban houses (%)
Rural houses (%)
Households with people 60 years and over (%)
Households with people 65 years and over (%)
Households with people 75 years and over (%)
Households with one or more nonrelatives (%)
Households with no nonrelatives (%)
Population in households (%)
Family households (%)
Nonfamily households (%)
Population in families (%)
Family households with own children (%)
Median number of bedrooms in owner occupied houses
Mean number of bedrooms in owner occupied houses
Median number of bedrooms in renter occupied houses
Mean number of bedrooms in renter occupied houses
Median number of vehichles in owner occupied houses
Mean number of vehichles in owner occupied houses
Median number of vehichles in renter occupied houses
Mean number of vehichles in renter occupied houses
Mortgage status - with mortgage (%)
Mortgage status - with second mortgage (%)
Mortgage status - with home equity loan (%)
Mortgage status - with both second mortgage and home equity loan (%)
Mortgage status - without a mortgage (%)
Average family size
Average family size - White
Average family size - Black or African American
Average family size - Asian
Average family size - Hispanic or Latino
Average family size - American Indian and Alaska Native
Average family size - Multirace
Average family size - Other Race
Geographical mobility - Same house 1 year ago (%)
Geographical mobility - Moved within same county (%)
Geographical mobility - Moved from different county within same state (%)
Geographical mobility - Moved from different state (%)
Geographical mobility - Moved from abroad (%)
Place of birth - Born in state of residence (%)
Place of birth - Born in other state (%)
Place of birth - Native, outside of US (%)
Place of birth - Foreign born (%)
Housing units in structures - 1, detached (%)
Housing units in structures - 1, attached (%)
Housing units in structures - 2 (%)
Housing units in structures - 3 or 4 (%)
Housing units in structures - 5 to 9 (%)
Housing units in structures - 10 to 19 (%)
Housing units in structures - 20 to 49 (%)
Housing units in structures - 50 or more (%)
Housing units in structures - Mobile home (%)
Housing units in structures - Boat, RV, van, etc. (%)
House/condo owner moved in on average (years ago)
Renter moved in on average (years ago)
Year householder moved into unit - Moved in 1999 to March 2000 (%)
Year householder moved into unit - Moved in 1995 to 1998 (%)
Year householder moved into unit - Moved in 1990 to 1994 (%)
Year householder moved into unit - Moved in 1980 to 1989 (%)
Year householder moved into unit - Moved in 1970 to 1979 (%)
Year householder moved into unit - Moved in 1969 or earlier (%)
Means of transportation to work - Drove car alone (%)
Means of transportation to work - Carpooled (%)
Means of transportation to work - Public transportation (%)
Means of transportation to work - Bus or trolley bus (%)
Means of transportation to work - Streetcar or trolley car (%)
Means of transportation to work - Subway or elevated (%)
Means of transportation to work - Railroad (%)
Means of transportation to work - Ferryboat (%)
Means of transportation to work - Taxicab (%)
Means of transportation to work - Motorcycle (%)
Means of transportation to work - Bicycle (%)
Means of transportation to work - Walked (%)
Means of transportation to work - Other means (%)
Working at home (%)
Industry diversity
Most Common Industries - Agriculture, forestry, fishing and hunting, and mining (%)
Most Common Industries - Agriculture, forestry, fishing and hunting (%)
Most Common Industries - Mining, quarrying, and oil and gas extraction (%)
Most Common Industries - Construction (%)
Most Common Industries - Manufacturing (%)
Most Common Industries - Wholesale trade (%)
Most Common Industries - Retail trade (%)
Most Common Industries - Transportation and warehousing, and utilities (%)
Most Common Industries - Transportation and warehousing (%)
Most Common Industries - Utilities (%)
Most Common Industries - Information (%)
Most Common Industries - Finance and insurance, and real estate and rental and leasing (%)
Most Common Industries - Finance and insurance (%)
Most Common Industries - Real estate and rental and leasing (%)
Most Common Industries - Professional, scientific, and management, and administrative and waste management services (%)
Most Common Industries - Professional, scientific, and technical services (%)
Most Common Industries - Management of companies and enterprises (%)
Most Common Industries - Administrative and support and waste management services (%)
Most Common Industries - Educational services, and health care and social assistance (%)
Most Common Industries - Educational services (%)
Most Common Industries - Health care and social assistance (%)
Most Common Industries - Arts, entertainment, and recreation, and accommodation and food services (%)
Most Common Industries - Arts, entertainment, and recreation (%)
Most Common Industries - Accommodation and food services (%)
Most Common Industries - Other services, except public administration (%)
Most Common Industries - Public administration (%)
Occupation diversity
Most Common Occupations - Management, business, science, and arts occupations (%)
Most Common Occupations - Management, business, and financial occupations (%)
Most Common Occupations - Management occupations (%)
Most Common Occupations - Business and financial operations occupations (%)
Most Common Occupations - Computer, engineering, and science occupations (%)
Most Common Occupations - Computer and mathematical occupations (%)
Most Common Occupations - Architecture and engineering occupations (%)
Most Common Occupations - Life, physical, and social science occupations (%)
Most Common Occupations - Education, legal, community service, arts, and media occupations (%)
Most Common Occupations - Community and social service occupations (%)
Most Common Occupations - Legal occupations (%)
Most Common Occupations - Education, training, and library occupations (%)
Most Common Occupations - Arts, design, entertainment, sports, and media occupations (%)
Most Common Occupations - Healthcare practitioners and technical occupations (%)
Most Common Occupations - Health diagnosing and treating practitioners and other technical occupations (%)
Most Common Occupations - Health technologists and technicians (%)
Most Common Occupations - Service occupations (%)
Most Common Occupations - Healthcare support occupations (%)
Most Common Occupations - Protective service occupations (%)
Most Common Occupations - Fire fighting and prevention, and other protective service workers including supervisors (%)
Most Common Occupations - Law enforcement workers including supervisors (%)
Most Common Occupations - Food preparation and serving related occupations (%)
Most Common Occupations - Building and grounds cleaning and maintenance occupations (%)
Most Common Occupations - Personal care and service occupations (%)
Most Common Occupations - Sales and office occupations (%)
Most Common Occupations - Sales and related occupations (%)
Most Common Occupations - Office and administrative support occupations (%)
Most Common Occupations - Natural resources, construction, and maintenance occupations (%)
Most Common Occupations - Farming, fishing, and forestry occupations (%)
Most Common Occupations - Construction and extraction occupations (%)
Most Common Occupations - Installation, maintenance, and repair occupations (%)
Most Common Occupations - Production, transportation, and material moving occupations (%)
Most Common Occupations - Production occupations (%)
Most Common Occupations - Transportation occupations (%)
Most Common Occupations - Material moving occupations (%)
People in Group quarters - Institutionalized population (%)
People in Group quarters - Correctional institutions (%)
People in Group quarters - Federal prisons and detention centers (%)
People in Group quarters - Halfway houses (%)
People in Group quarters - Local jails and other confinement facilities (including police lockups) (%)
People in Group quarters - Military disciplinary barracks (%)
People in Group quarters - State prisons (%)
People in Group quarters - Other types of correctional institutions (%)
People in Group quarters - Nursing homes (%)
People in Group quarters - Hospitals/wards, hospices, and schools for the handicapped (%)
People in Group quarters - Hospitals/wards and hospices for chronically ill (%)
People in Group quarters - Hospices or homes for chronically ill (%)
People in Group quarters - Military hospitals or wards for chronically ill (%)
People in Group quarters - Other hospitals or wards for chronically ill (%)
People in Group quarters - Hospitals or wards for drug/alcohol abuse (%)
People in Group quarters - Mental (Psychiatric) hospitals or wards (%)
People in Group quarters - Schools, hospitals, or wards for the mentally retarded (%)
People in Group quarters - Schools, hospitals, or wards for the physically handicapped (%)
People in Group quarters - Institutions for the deaf (%)
People in Group quarters - Institutions for the blind (%)
People in Group quarters - Orthopedic wards and institutions for the physically handicapped (%)
People in Group quarters - Wards in general hospitals for patients who have no usual home elsewhere (%)
People in Group quarters - Wards in military hospitals for patients who have no usual home elsewhere (%)
People in Group quarters - Juvenile institutions (%)
People in Group quarters - Long-term care (%)
People in Group quarters - Homes for abused, dependent, and neglected children (%)
People in Group quarters - Residential treatment centers for emotionally disturbed children (%)
People in Group quarters - Training schools for juvenile delinquents (%)
People in Group quarters - Short-term care, detention or diagnostic centers for delinquent children (%)
People in Group quarters - Type of juvenile institution unknown (%)
People in Group quarters - Noninstitutionalized population (%)
People in Group quarters - College dormitories (includes college quarters off campus) (%)
People in Group quarters - Military quarters (%)
People in Group quarters - On base (%)
People in Group quarters - Barracks, unaccompanied personnel housing (UPH), (Enlisted/Officer), ;and similar group living quarters for military personnel (%)
People in Group quarters - Transient quarters for temporary residents (%)
People in Group quarters - Military ships (%)
People in Group quarters - Group homes (%)
People in Group quarters - Homes or halfway houses for drug/alcohol abuse (%)
People in Group quarters - Homes for the mentally ill (%)
People in Group quarters - Homes for the mentally retarded (%)
People in Group quarters - Homes for the physically handicapped (%)
People in Group quarters - Other group homes (%)
People in Group quarters - Religious group quarters (%)
People in Group quarters - Dormitories (%)
People in Group quarters - Agriculture workers' dormitories on farms (%)
People in Group quarters - Job Corps and vocational training facilities (%)
People in Group quarters - Other workers' dormitories (%)
People in Group quarters - Crews of maritime vessels (%)
People in Group quarters - Other nonhousehold living situations (%)
People in Group quarters - Other noninstitutional group quarters (%)
Residents speaking English at home (%)
Residents speaking English at home - Born in the United States (%)
Residents speaking English at home - Native, born elsewhere (%)
Residents speaking English at home - Foreign born (%)
Residents speaking Spanish at home (%)
Residents speaking Spanish at home - Born in the United States (%)
Residents speaking Spanish at home - Native, born elsewhere (%)
Residents speaking Spanish at home - Foreign born (%)
Residents speaking other language at home (%)
Residents speaking other language at home - Born in the United States (%)
Residents speaking other language at home - Native, born elsewhere (%)
Residents speaking other language at home - Foreign born (%)
Class of Workers - Employee of private company (%)
Class of Workers - Self-employed in own incorporated business (%)
Class of Workers - Private not-for-profit wage and salary workers (%)
Class of Workers - Local government workers (%)
Class of Workers - State government workers (%)
Class of Workers - Federal government workers (%)
Class of Workers - Self-employed workers in own not incorporated business and Unpaid family workers (%)
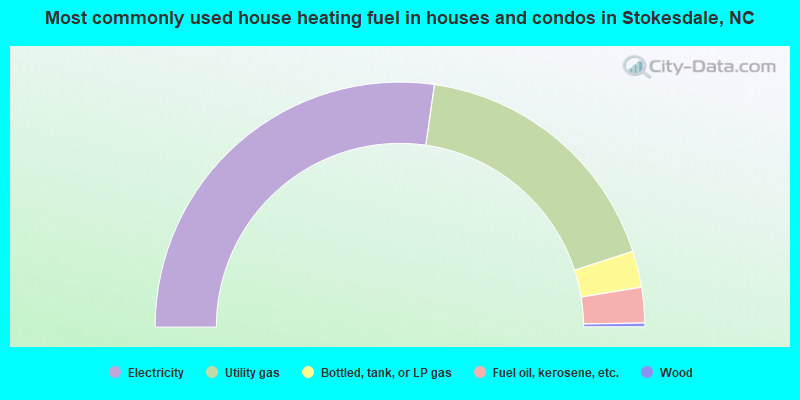
House heating fuel used in houses and condos - Utility gas (%)
House heating fuel used in houses and condos - Bottled, tank, or LP gas (%)
House heating fuel used in houses and condos - Electricity (%)
House heating fuel used in houses and condos - Fuel oil, kerosene, etc. (%)
House heating fuel used in houses and condos - Coal or coke (%)
House heating fuel used in houses and condos - Wood (%)
House heating fuel used in houses and condos - Solar energy (%)
House heating fuel used in houses and condos - Other fuel (%)
House heating fuel used in houses and condos - No fuel used (%)
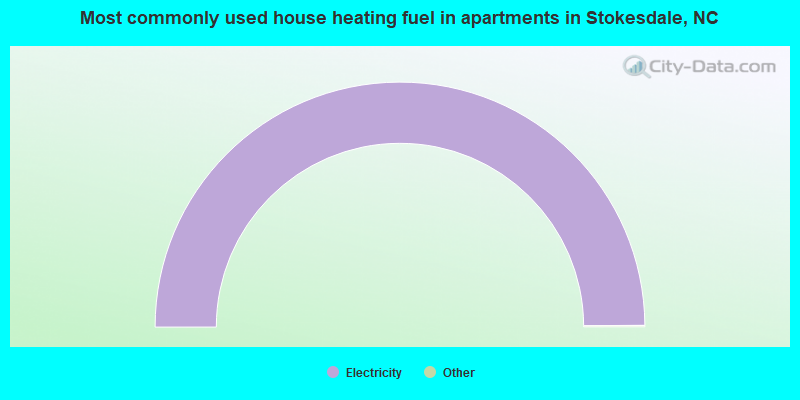
House heating fuel used in apartments - Utility gas (%)
House heating fuel used in apartments - Bottled, tank, or LP gas (%)
House heating fuel used in apartments - Electricity (%)
House heating fuel used in apartments - Fuel oil, kerosene, etc. (%)
House heating fuel used in apartments - Coal or coke (%)
House heating fuel used in apartments - Wood (%)
House heating fuel used in apartments - Solar energy (%)
House heating fuel used in apartments - Other fuel (%)
House heating fuel used in apartments - No fuel used (%)
Armed forces status - In Armed Forces (%)
Armed forces status - Civilian (%)
Armed forces status - Civilian - Veteran (%)
Armed forces status - Civilian - Nonveteran (%)
Fatal accidents locations in years 2005-2021
Fatal accidents locations in 2005
Fatal accidents locations in 2006
Fatal accidents locations in 2007
Fatal accidents locations in 2008
Fatal accidents locations in 2009
Fatal accidents locations in 2010
Fatal accidents locations in 2011
Fatal accidents locations in 2012
Fatal accidents locations in 2013
Fatal accidents locations in 2014
Fatal accidents locations in 2015
Fatal accidents locations in 2016
Fatal accidents locations in 2017
Fatal accidents locations in 2018
Fatal accidents locations in 2019
Fatal accidents locations in 2020
Fatal accidents locations in 2021
Alcohol use - People drinking some alcohol every month (%)
Alcohol use - People not drinking at all (%)
Alcohol use - Average days/month drinking alcohol
Alcohol use - Average drinks/week
Alcohol use - Average days/year people drink much
Audiometry - Average condition of hearing (%)
Audiometry - People that can hear a whisper from across a quiet room (%)
Audiometry - People that can hear normal voice from across a quiet room (%)
Audiometry - Ears ringing, roaring, buzzing (%)
Audiometry - Had a job exposure to loud noise (%)
Audiometry - Had off-work exposure to loud noise (%)
Blood Pressure & Cholesterol - Has high blood pressure (%)
Blood Pressure & Cholesterol - Checking blood pressure at home (%)
Blood Pressure & Cholesterol - Frequently checking blood cholesterol (%)
Blood Pressure & Cholesterol - Has high cholesterol level (%)
Consumer Behavior - Money monthly spent on food at supermarket/grocery store
Consumer Behavior - Money monthly spent on food at other stores
Consumer Behavior - Money monthly spent on eating out
Consumer Behavior - Money monthly spent on carryout/delivered foods
Consumer Behavior - Income spent on food at supermarket/grocery store (%)
Consumer Behavior - Income spent on food at other stores (%)
Consumer Behavior - Income spent on eating out (%)
Consumer Behavior - Income spent on carryout/delivered foods (%)
Current Health Status - General health condition (%)
Current Health Status - Blood donors (%)
Current Health Status - Has blood ever tested for HIV virus (%)
Current Health Status - Left-handed people (%)
Dermatology - People using sunscreen (%)
Diabetes - Diabetics (%)
Diabetes - Had a blood test for high blood sugar (%)
Diabetes - People taking insulin (%)
Diet Behavior & Nutrition - Diet health (%)
Diet Behavior & Nutrition - Milk product consumption (# of products/month)
Diet Behavior & Nutrition - Meals not home prepared (#/week)
Diet Behavior & Nutrition - Meals from fast food or pizza place (#/week)
Diet Behavior & Nutrition - Ready-to-eat foods (#/month)
Diet Behavior & Nutrition - Frozen meals/pizza (#/month)
Drug Use - People that ever used marijuana or hashish (%)
Drug Use - Ever used hard drugs (%)
Drug Use - Ever used any form of cocaine (%)
Drug Use - Ever used heroin (%)
Drug Use - Ever used methamphetamine (%)
Health Insurance - People covered by health insurance (%)
Kidney Conditions-Urology - Avg. # of times urinating at night
Medical Conditions - People with asthma (%)
Medical Conditions - People with anemia (%)
Medical Conditions - People with psoriasis (%)
Medical Conditions - People with overweight (%)
Medical Conditions - Elderly people having difficulties in thinking or remembering (%)
Medical Conditions - People who ever received blood transfusion (%)
Medical Conditions - People having trouble seeing even with glass/contacts (%)
Medical Conditions - People with arthritis (%)
Medical Conditions - People with gout (%)
Medical Conditions - People with congestive heart failure (%)
Medical Conditions - People with coronary heart disease (%)
Medical Conditions - People with angina pectoris (%)
Medical Conditions - People who ever had heart attack (%)
Medical Conditions - People who ever had stroke (%)
Medical Conditions - People with emphysema (%)
Medical Conditions - People with thyroid problem (%)
Medical Conditions - People with chronic bronchitis (%)
Medical Conditions - People with any liver condition (%)
Medical Conditions - People who ever had cancer or malignancy (%)
Mental Health - People who have little interest in doing things (%)
Mental Health - People feeling down, depressed, or hopeless (%)
Mental Health - People who have trouble sleeping or sleeping too much (%)
Mental Health - People feeling tired or having little energy (%)
Mental Health - People with poor appetite or overeating (%)
Mental Health - People feeling bad about themself (%)
Mental Health - People who have trouble concentrating on things (%)
Mental Health - People moving or speaking slowly or too fast (%)
Mental Health - People having thoughts they would be better off dead (%)
Oral Health - Average years since last visit a dentist
Oral Health - People embarrassed because of mouth (%)
Oral Health - People with gum disease (%)
Oral Health - General health of teeth and gums (%)
Oral Health - Average days a week using dental floss/device
Oral Health - Average days a week using mouthwash for dental problem
Oral Health - Average number of teeth
Pesticide Use - Households using pesticides to control insects (%)
Pesticide Use - Households using pesticides to kill weeds (%)
Physical Activity - People doing vigorous-intensity work activities (%)
Physical Activity - People doing moderate-intensity work activities (%)
Physical Activity - People walking or bicycling (%)
Physical Activity - People doing vigorous-intensity recreational activities (%)
Physical Activity - People doing moderate-intensity recreational activities (%)
Physical Activity - Average hours a day doing sedentary activities
Physical Activity - Average hours a day watching TV or videos
Physical Activity - Average hours a day using computer
Physical Functioning - People having limitations keeping them from working (%)
Physical Functioning - People limited in amount of work they can do (%)
Physical Functioning - People that need special equipment to walk (%)
Physical Functioning - People experiencing confusion/memory problems (%)
Physical Functioning - People requiring special healthcare equipment (%)
Prescription Medications - Average number of prescription medicines taking
Preventive Aspirin Use - Adults 40+ taking low-dose aspirin (%)
Reproductive Health - Vaginal deliveries (%)
Reproductive Health - Cesarean deliveries (%)
Reproductive Health - Deliveries resulted in a live birth (%)
Reproductive Health - Pregnancies resulted in a delivery (%)
Reproductive Health - Women breastfeeding newborns (%)
Reproductive Health - Women that had a hysterectomy (%)
Reproductive Health - Women that had both ovaries removed (%)
Reproductive Health - Women that have ever taken birth control pills (%)
Reproductive Health - Women taking birth control pills (%)
Reproductive Health - Women that have ever used Depo-Provera or injectables (%)
Reproductive Health - Women that have ever used female hormones (%)
Sexual Behavior - People 18+ that ever had sex (vaginal, anal, or oral) (%)
Sexual Behavior - Males 18+ that ever had vaginal sex with a woman (%)
Sexual Behavior - Males 18+ that ever performed oral sex on a woman (%)
Sexual Behavior - Males 18+ that ever had anal sex with a woman (%)
Sexual Behavior - Males 18+ that ever had any sex with a man (%)
Sexual Behavior - Females 18+ that ever had vaginal sex with a man (%)
Sexual Behavior - Females 18+ that ever performed oral sex on a man (%)
Sexual Behavior - Females 18+ that ever had anal sex with a man (%)
Sexual Behavior - Females 18+ that ever had any kind of sex with a woman (%)
Sexual Behavior - Average age people first had sex
Sexual Behavior - Average number of female sex partners in lifetime (males 18+)
Sexual Behavior - Average number of female vaginal sex partners in lifetime (males 18+)
Sexual Behavior - Average age people first performed oral sex on a woman (18+)
Sexual Behavior - Average number of woman performed oral sex on in lifetime (18+)
Sexual Behavior - Average number of male sex partners in lifetime (males 18+)
Sexual Behavior - Average number of male anal sex partners in lifetime (males 18+)
Sexual Behavior - Average age people first performed oral sex on a man (18+)
Sexual Behavior - Average number of male oral sex partners in lifetime (18+)
Sexual Behavior - People using protection when performing oral sex (%)
Sexual Behavior - Average number of times people have vaginal or anal sex a year
Sexual Behavior - People having sex without condom (%)
Sexual Behavior - Average number of male sex partners in lifetime (females 18+)
Sexual Behavior - Average number of male vaginal sex partners in lifetime (females 18+)
Sexual Behavior - Average number of female sex partners in lifetime (females 18+)
Sexual Behavior - Circumcised males 18+ (%)
Sleep Disorders - Average hours sleeping at night
Sleep Disorders - People that has trouble sleeping (%)
Smoking-Cigarette Use - People smoking cigarettes (%)
Taste & Smell - People 40+ having problems with smell (%)
Taste & Smell - People 40+ having problems with taste (%)
Taste & Smell - People 40+ that ever had wisdom teeth removed (%)
Taste & Smell - People 40+ that ever had tonsils teeth removed (%)
Taste & Smell - People 40+ that ever had a loss of consciousness because of a head injury (%)
Taste & Smell - People 40+ that ever had a broken nose or other serious injury to face or skull (%)
Taste & Smell - People 40+ that ever had two or more sinus infections (%)
Weight - Average height (inches)
Weight - Average weight (pounds)
Weight - Average BMI
Weight - People that are obese (%)
Weight - People that ever were obese (%)
Weight - People trying to lose weight (%)
Latest news from Stokesdale, NC collected exclusively by city-data.com from local newspapers, TV, and radio stations
Ancestries: English (13.0%), American (9.4%), European (6.8%), German (6.3%), Canadian (3.7%), Polish (3.7%).
Current Local Time:
Land area: 19.4 square miles.
Population density: 309 people per square mile (very low).
546 residents are foreign born (3.7% Asia , 2.1% North America , 2.1% Europe ).
This town:
9.1%North Carolina:
8.3%
Median real estate property taxes paid for housing units with mortgages in 2022: $2,656 (0.7%)Median real estate property taxes paid for housing units with no mortgage in 2022: $1,736 (0.6%)
Nearest city with pop. 50,000+: Greensboro, NC
Nearest city with pop. 1,000,000+: Philadelphia, PA
Nearest cities:
Latitude: 36.24 N, Longitude: 79.98 W
Area code commonly used in this area: 336
Unemployment in December 2023: Here:
3.6%North Carolina:
3.2%
Population change in the 1990s: +1,193 (+57.5%).
Most common occupations in Stokesdale, NC (%)
Both Males Females
Other production occupations, including supervisors (5.4%)
Other sales and related occupations, including supervisors (4.7%)
Electrical equipment mechanics and other installation, maintenance, and repair workers, including supervisors (4.4%)
Vehicle and mobile equipment mechanics, installers, and repairers (3.7%)
Other management occupations, except farmers and farm managers (3.7%)
Driver/sales workers and truck drivers (3.5%)
Secretaries and administrative assistants (3.3%)
Electrical equipment mechanics and other installation, maintenance, and repair workers, including supervisors (8.0%)
Other production occupations, including supervisors (7.0%)
Vehicle and mobile equipment mechanics, installers, and repairers (6.8%)
Other sales and related occupations, including supervisors (5.7%)
Driver/sales workers and truck drivers (5.3%)
Retail sales workers, except cashiers (4.9%)
Building and grounds cleaning and maintenance occupations (4.2%)
Secretaries and administrative assistants (7.4%)
Information and record clerks, except customer service representatives (5.5%)
Textile, apparel, and furnishings workers (5.1%)
Financial clerks, except bookkeeping, accounting and auditing clerks (4.5%)
Accountants and auditors (4.4%)
Preschool, kindergarten, elementary, and middle school teachers (4.3%)
Customer service representatives (3.9%)
Tornado activity:
Stokesdale-area historical tornado activity is slightly below North Carolina state average. It is 30% smaller than the overall U.S. average.
On 5/5/1989, a category F3 (max. wind speeds 158-206 mph) tornado 6.7 miles away from the Stokesdale town center injured 30 people and caused between $5,000,000 and $50,000,000 in damages.
On 3/20/1998, a category F3 tornado 11.3 miles away from the town center killed 2 people and injured 27 people and caused $34 million in damages.
Earthquake activity:
Stokesdale-area historical earthquake activity is significantly above North Carolina state average. It is 30% smaller than the overall U.S. average. On 8/23/2011 at 17:51:04, a magnitude 5.8 (5.8 MW, Depth: 3.7 mi, Class: Moderate, Intensity: VI - VII) earthquake occurred 161.7 miles away from the city center On 8/9/2020 at 12:07:37, a magnitude 5.1 (5.1 MW, Depth: 4.7 mi) earthquake occurred 64.1 miles away from Stokesdale center On 7/27/1980 at 18:52:21, a magnitude 5.2 (5.1 MB, 4.7 MS, 5.0 UK, 5.2 UK) earthquake occurred 257.1 miles away from Stokesdale center On 8/2/1974 at 08:52:09, a magnitude 4.9 (4.3 MB, 4.9 LG, Class: Light, Intensity: IV - V) earthquake occurred 216.5 miles away from the city center On 12/9/2003 at 20:59:14, a magnitude 4.5 (4.5 MB, 4.5 LG) earthquake occurred 148.2 miles away from Stokesdale center On 12/9/2003 at 20:59:18, a magnitude 4.5 (4.5 ML, Depth: 6.2 mi) earthquake occurred 148.7 miles away from Stokesdale center Magnitude types: regional Lg-wave magnitude (LG), body-wave magnitude (MB), local magnitude (ML), surface-wave magnitude (MS), moment magnitude (MW) Natural disasters: The number of natural disasters in Guilford County (20) is greater than the US average (15).Major Disasters (Presidential) Declared: 11Emergencies Declared: 6Hurricanes: 8, Winter Storms: 3, Droughts: 2, Ice Storms: 2, Storms: 2, Tornadoes: 2, Blizzard: 1, Flood: 1, Freeze: 1, Snowfall: 1, Other: 1 (Note: some incidents may be assigned to more than one category). Hospitals and medical centers in Stokesdale: COUNTRYSIDE MANOR (7700 US 158 EAST)
Other hospitals and medical centers near Stokesdale: FORSYTH GROUP HOME #2 (Hospital, about 6 miles away; BELEWS CREEK, NC)
GUILFORD III (Hospital, about 7 miles away; SUMMERFIELD, NC)
FORSYTH GROUP HOME #1 (Hospital, about 9 miles away; KERNERSVILLE, NC)
PINEY GROVE NURSING AND REHABILITATION CENTER (Nursing Home, about 9 miles away; KERNERSVILLE, NC)
JACOB'S CREEK NURSING AND REHABILITATION CENTER (Nursing Home, about 10 miles away; MADISON, NC)
WALNUT COVE HEALTH AND REHABILITATION CENTER (Nursing Home, about 10 miles away; WALNUT COVE, NC)
GUILFORD II (Hospital, about 11 miles away; GREENSBORO, NC)
Amtrak stations near Stokesdale: 15 miles: GREENSBORO (2603 OAKLAND AVE.) Services: ticket office, fully wheelchair accessible, enclosed waiting area, public restrooms, public payphones, vending machines, free short-term parking, free long-term parking, call for car rental service, call for taxi service.
18 miles: WINSTON-SALEM (127 S. CHERRY ST.) - Bus Station Services: fully wheelchair accessible, enclosed waiting area, public restrooms, public payphones, vending machines, free short-term parking, free long-term parking, call for taxi service.
20 miles: HIGH POINT (100 W. HIGH ST.) Services: partially wheelchair accessible, enclosed waiting area, public restrooms, public payphones, vending machines, paid short-term parking, paid long-term parking, call for car rental service, call for taxi service, public transit connection.
Colleges/universities with over 2000 students nearest to Stokesdale:
Guilford College (about 12 miles; Greensboro, NC ; Full-time enrollment: 2,211)
University of North Carolina at Greensboro (about 16 miles; Greensboro, NC ; FT enrollment: 16,174)
North Carolina A & T State University (about 17 miles; Greensboro, NC ; FT enrollment: 9,805)
Guilford Technical Community College (about 17 miles; Jamestown, NC ; FT enrollment: 13,068)
Winston-Salem State University (about 17 miles; Winston-Salem, NC ; FT enrollment: 5,378)
Wake Forest University (about 18 miles; Winston Salem, NC ; FT enrollment: 6,407)
High Point University (about 19 miles; High Point, NC ; FT enrollment: 4,240)
Private high school in Stokesdale: OAK LEVEL BAPTIST ACADEMY Students: 111, Location: 1569 OAK LEVEL CHURCH RD, Grades: PK-12)
Public elementary/middle school in Stokesdale:
See full list of schools located in Stokesdale
Churches in Stokesdale include: (A) , Oak Spring Church (B) , Flat Rock Church (C) . Display/hide their locations on the map
Reservoirs: (A) , Lower Merchants Lake (B) , Hardin Lake (C) , Honkers Hollow Lake (D) , Lambert Lake (E) , Thompson Lake (F) , Pope Lake (G) . Display/hide their locations on the map
Streams, rivers, and creeks: (A) , Kings Creek (B) . Display/hide their locations on the map
Guilford County has a predicted average indoor radon screening level less than 2 pCi/L (pico curies per liter) - Low Potential Drinking water stations with addresses in Stokesdale and their reported violations in the past:
PARKERS RESTAURANT (Population served: 50, Groundwater):
Past monitoring violations:
7 routine major monitoring violations
5 regular monitoring violations
Population served: 50, Groundwater):
Past monitoring violations:
2 routine major monitoring violations
Population served: 25, Groundwater):
Past health violations:
MCL, Monthly (TCR) - Between APR-2006 and JUN-2006, Contaminant: Coliform. Follow-up actions: St Public Notif requested (MAY-02-2006), St Formal NOV issued (MAY-02-2006), St Compliance achieved (NOV-13-2006)
Past monitoring violations:
Monitoring, Repeat Major (TCR) - Between OCT-2007 and DEC-2007, Contaminant: Coliform (TCR). Follow-up actions: St Public Notif requested (APR-18-2008), St Formal NOV issued (APR-18-2008), St Compliance achieved (APR-28-2008)
7 routine major monitoring violations
Population served: 25, Groundwater):
Past health violations:
MCL, Monthly (TCR) - Between APR-2012 and JUN-2012, Contaminant: Coliform. Follow-up actions: St Public Notif requested (JUN-15-2012), St Formal NOV issued (JUN-15-2012), St Public Notif received (JUN-15-2012), St AO (w/o penalty) issued (JUN-15-2012), St Compliance achieved (SEP-30-2012)
Past monitoring violations:
14 routine major monitoring violations
3 regular monitoring violations
Population served: 25, Groundwater):
Past monitoring violations:
20 routine major monitoring violations
Population served: 25, Groundwater):
Past health violations:
MCL, Monthly (TCR) - Between JUL-2012 and SEP-2012, Contaminant: Coliform. Follow-up actions: St Public Notif received (OCT-01-2012), St Public Notif requested (OCT-02-2012), St Formal NOV issued (OCT-02-2012), St AO (w/o penalty) issued (OCT-02-2012), St Compliance achieved (OCT-31-2012)
Drinking water stations with addresses in Stokesdale that have no violations reported:
HUMPHREY`S RIDGE CAMPGRD NO 1 (Population served: 100, Primary Water Source Type: Groundwater)
HUMPHREYS RIDGE CAMPGROUND NO 2 (Population served: 33, Primary Water Source Type: Groundwater)
HUMPHREY`S GRILL (Population served: 25, Primary Water Source Type: Groundwater)
Average household size: This town:
2.7 peopleNorth Carolina:
2.5 people
Percentage of family households: This town:
78.8%Whole state:
66.7%
Percentage of households with unmarried partners: This town:
4.0%Whole state:
5.9%
Likely homosexual households (counted as self-reported same-sex unmarried-partner households)
Lesbian couples: 0.3% of all households Gay men: 0.2% of all households
71 people in nursing facilities/skilled-nursing facilities in 2010people in nursing homes in 2000
Banks with branches in Stokesdale (2011 data):
SunTrust Bank: Stokesdale Branch 520 at 8401 Ivan, branch established on 1908/06/01. Info updated 2010/05/27: Bank assets: $171,291.7 mil, Deposits: $129,833.2 mil, headquarters in Atlanta, GA, positive income , Commercial Lending Specialization, 1716 total offices , Holding Company: Suntrust Banks, Inc.
The Fidelity Bank: Stokesdale Branch at 8110 U.S. Highway 158, branch established on 1977/10/19. Info updated 2006/11/03: Bank assets: $1,422.4 mil, Deposits: $1,234.1 mil, headquarters in Fuquay Varina, NC, positive income , Commercial Lending Specialization, 66 total offices , Holding Company: Fidelity Bancshares (N.C.), Inc.
For population 15 years and over in Stokesdale:
Never married: 22.3%Now married: 67.5%Separated: 0.3%Widowed: 3.2%Divorced: 6.8% For population 25 years and over in Stokesdale:
High school or higher: 97.8%Bachelor's degree or higher: 42.4%Graduate or professional degree: 15.2%Unemployed: 2.4%Mean travel time to work (commute): 22.2 minutes
Education Gini index (Inequality in education) Here:
9.1North Carolina average:
11.7
Religion statistics for Stokesdale, NC (based on Guilford County data)
Religion Adherents Congregations Evangelical Protestant 113,377 411 Mainline Protestant 74,143 178 Catholic 20,228 7 Black Protestant 16,255 44 Other 14,164 39 Orthodox 540 4 None 252,345 -
Source: Clifford Grammich, Kirk Hadaway, Richard Houseal, Dale E.Jones, Alexei Krindatch, Richie Stanley and Richard H.Taylor. 2012. 2010 U.S.Religion Census: Religious Congregations & Membership Study. Association of Statisticians of American Religious Bodies. Jones, Dale E., et al. 2002. Congregations and Membership in the United States 2000. Nashville, TN: Glenmary Research Center. Graphs represent county-level data
Food Environment Statistics: Number of grocery stores : 100Here :
2.16 / 10,000 pop.North Carolina :
2.05 / 10,000 pop.
Number of supercenters and club stores : 5Here :
0.11 / 10,000 pop.North Carolina :
0.14 / 10,000 pop.
Number of convenience stores (no gas) : 57This county :
1.23 / 10,000 pop.North Carolina :
0.92 / 10,000 pop.
Number of convenience stores (with gas) : 182Guilford County :
3.92 / 10,000 pop.State :
4.75 / 10,000 pop.
Number of full-service restaurants : 416Guilford County :
8.96 / 10,000 pop.North Carolina :
7.57 / 10,000 pop.
Adult obesity rate : This county :
27.8%State :
28.3%
Low-income preschool obesity rate : Here :
14.9%North Carolina :
15.6%
Health and Nutrition: Healthy diet rate : Stokesdale:
49.7%North Carolina:
48.9%
Average overall health of teeth and gums : Stokesdale:
48.3%North Carolina:
46.1%
People feeling badly about themselves : Stokesdale:
22.4%State:
20.7%
People not drinking alcohol at all : Stokesdale:
9.0%North Carolina:
10.7%
Average hours sleeping at night : Overweight people : Here:
38.1%North Carolina:
33.7%
General health condition : Here:
57.0%North Carolina:
55.8%
Average condition of hearing : This city:
79.3%North Carolina:
79.7%
More about Health and Nutrition of Stokesdale, NC Residents
Local government employment and payroll (March 2022)
Function
Full-time employees
Monthly full-time payroll
Average yearly full-time wage
Part-time employees
Monthly part-time payroll
Other Government Administration
0 $0 6 $3,850 Water Supply
0 $0 1 $850
Totals for Government
0 $0 7 $4,700
Stokesdale government finances - Expenditure in 2017 (per resident):
Current Operations - Water Utilities: $182,000 ($30.37)
Financial Administration: $98,000 ($16.35)Parks and Recreation: $37,000 ($6.17)General Public Buildings: $26,000 ($4.34)Police Protection: $14,000 ($2.34)Judicial and Legal Services: $12,000 ($2.00)General - Other: $11,000 ($1.84)Central Staff Services: $10,000 ($1.67)Transit Utilities: $4,000 ($0.67)Protective Inspection and Regulation - Other: $2,000 ($0.33)Housing and Community Development: $1,000 ($0.17)Intergovernmental to Local - Other - Water Utilities: $222,000 ($37.04)
Other - Housing and Community Development: $25,000 ($4.17)Other Capital Outlay - Parks and Recreation: $7,000 ($1.17)
Stokesdale government finances - Revenue in 2017 (per resident):
Miscellaneous - General Revenue - Other: $41,000 ($6.84)
Donations From Private Sources: $6,000 ($1.00)Interest Earnings: $0 ($0.00)Revenue - Water Utilities: $508,000 ($84.77)
State Intergovernmental - General Local Government Support: $338,000 ($56.40)
Tax - Occupation and Business License - Other: $25,000 ($4.17)
6.88% of this county's 2021 resident taxpayers lived in other counties in 2020 ($56,409 average adjusted gross income )
Here:
6.88%North Carolina average:
8.85%
0.01% of residents moved from foreign countries ($118 average AGI )Guilford County:
0.01%North Carolina average:
0.04%
Top counties from which taxpayers relocated into this county between 2020 and 2021:
7.21% of this county's 2020 resident taxpayers moved to other counties in 2021 ($56,265 average adjusted gross income )
Here:
7.21%North Carolina average:
7.89%
0.01% of residents moved to foreign countries ($97 average AGI )Guilford County:
0.01%North Carolina average:
0.03%
Top counties to which taxpayers relocated from this county between 2020 and 2021: Businesses in Stokesdale, NC
Strongest AM radio stations in Stokesdale:
WTRU (830 AM; 50 kW; KERNERSVILLE, NC; Owner: TRUTH BROADCASTING CORPORATION)
WWBG (1470 AM; 10 kW; GREENSBORO, NC; Owner: TRUTH BROADCASTING COPORATION)
WCOG (1320 AM; 5 kW; GREENSBORO, NC; Owner: TRUTH BROADCASTING CORPORATION)
WSJS (600 AM; 5 kW; WINSTON-SALEM, NC)
WPTF (680 AM; 50 kW; RALEIGH, NC; Owner: FIRST STATE COMMUNICATIONS)
WFTK (1030 AM; daytime; 50 kW; WAKE FOREST, NC; Owner: POSITIVE RADIO GROUP, INC.)
WSGH (1040 AM; 9 kW; LEWISVILLE, NC; Owner: WINSTON-SALEM, GREENSBORO, HIGH POINT AREA RADIO)
WSML (1200 AM; 10 kW; GRAHAM, NC; Owner: INFINITY RADIO OPERATIONS INC.)
WTOB (1380 AM; 5 kW; WINSTON-SALEM, NC; Owner: TRUTH BROADCASTING CORP)
WIST (790 AM; 2 kW; THOMASVILLE, NC; Owner: GHB RADIO, INC.)
WPAQ (740 AM; 10 kW; MOUNT AIRY, NC; Owner: RALPH D. EPPERSON)
WPCM (920 AM; 5 kW; BURLINGTON-GRAHAM, NC; Owner: CAROLINA RADIO GROUP, INC.)
WHKY (1290 AM; 50 kW; HICKORY, NC; Owner: LONG COMMUNICATIONS, LLC.)
Strongest FM radio stations in Stokesdale:
WJMH (102.1 FM; REIDSVILLE, NC; Owner: ENTERCOM GREENSBORO LICENSE, LLC)
WMQX-FM (93.1 FM; WINSTON-SALEM, NC; Owner: ENTERCOM GREENSBORO LICENSE, LLC)
WGBT (94.5 FM; EDEN, NC; Owner: CLEAR CHANNEL BROADCASTING LICENSES, INC.)
WFDD (88.5 FM; WINSTON-SALEM, NC; Owner: WAKE FOREST UNIVERSITY)
WKZL (107.5 FM; WINSTON-SALEM, NC; Owner: DICK BROADCASTING COMPANY, INC. OF TENNESSEE)
WOZN (98.7 FM; GREENSBORO, NC; Owner: ENTERCOM GREENSBORO LICENSE, LLC)
WTQR (104.1 FM; WINSTON-SALEM, NC; Owner: CLEAR CHANNEL BROADCASTING LICENSES, INC.)
WQMG-FM (97.1 FM; GREENSBORO, NC; Owner: ENTERCOM GREENSBORO LICENSE, LLC)
WVBZ (100.3 FM; HIGH POINT, NC; Owner: CAPSTAR TX LIMITED PARTNERSHIP)
WMAG (99.5 FM; HIGH POINT, NC; Owner: CAPSTAR TX LIMITED PARTNERSHIP)
W285DJ (104.9 FM; MOUNT AIRY, NC; Owner: TRIAD FAMILY NETWORK, INC,)
WKRR (92.3 FM; ASHEBORO, NC; Owner: DICK BROADCASTING COMPANY, INC. OF TENNESSEE)
WNAA (90.1 FM; GREENSBORO, NC; Owner: NC AGRICULTURAL & TECHNICAL STATE UNIVERSITY)
WKXU (101.1 FM; BURLINGTON, NC; Owner: CAROLINA RADIO GROUP, INC.)
WIST-FM (98.3 FM; THOMASVILLE, NC; Owner: WEAM QUALITY RADIO CORP.)
WBFJ-FM (89.3 FM; WINSTON-SALEM, NC; Owner: TRIAD FAMILY NETWORK, INC.)
WBRF (98.1 FM; GALAX, VA; Owner: BLUE RIDGE RADIO, INC.)
WROV-FM (96.3 FM; MARTINSVILLE, VA; Owner: CAPSTAR TX LIMITED PARTNERSHIP)
WFMX (105.7 FM; STATESVILLE, NC; Owner: MERCURY BROADCASTING COMPANY, INC.)
WHPE-FM (95.5 FM; HIGH POINT, NC; Owner: BIBLE BROADCASTING NETWORK, INC.)
TV broadcast stations around Stokesdale:
WFMY-TV (Channel 2; GREENSBORO, NC; Owner: WFMY TELEVISION CORPORATION)
WUPN-TV (Channel 48; GREENSBORO, NC; Owner: WUPN LICENSEE, LLC)
WXLV-TV (Channel 45; WINSTON-SALEM, NC; Owner: WXLV LICENSEE, LLC)
WTWB-TV (Channel 20; LEXINGTON, NC; Owner: WTWB OF THE TRIAD, LLC)
WLXI-TV (Channel 61; GREENSBORO, NC; Owner: TRI-STATE CHRISTIAN TV, INC.)
WGPX (Channel 16; BURLINGTON, NC; Owner: PAXSON GREENSBORO LICENSE, INC.)
WGHP (Channel 8; HIGH POINT, NC; Owner: WGHP LICENSE, INC.)
WXII-TV (Channel 12; WINSTON-SALEM, NC; Owner: WXII HEARST-ARGYLE TELEVISION, INC.)
WXIV-LP (Channel 14; REIDSVILLE, NC; Owner: CAROLINA BLUE COMMUNICATIONS, INC.)
WUNL-TV (Channel 26; WINSTON-SALEM, NC; Owner: UNIVERSITY OF NORTH CAROLINA)
FCC Registered Cell Phone Towers: 2 (
See the full list of FCC Registered Cell Phone Towers in Stokesdale )
FCC Registered Antenna Towers: 51 (
See the full list of FCC Registered Antenna Towers )
FCC Registered Broadcast Land Mobile Towers: 1
County Fire Station 12 (Lat: 36.243194 Lon: -79.954750), Call Sign: KIU962, Assigned Frequencies: 46.5000 MHz, Grant Date: 06/06/2023, Expiration Date: 09/01/2033, Registrant: County Of Guilford, 1002 Meadowood St, Greensboro, NC 27409, Phone: (336) 641-6546, Fax: (336) 641-3328, Email:
FCC Registered Microwave Towers: 6
STOKESDALE, 9578 St Rt 65 (Lat: 36.261528 Lon: -79.935583), Type: Tower, Structure height: 57.9 m, Overall height: 60.7 m, Call Sign: WPNL257, Assigned Frequencies: 6590.00 MHz, 6660.00 MHz, Grant Date: 03/11/2008, Expiration Date: 04/04/2018, Cancellation Date: 02/05/2016, Certifier: Steven T Campbell, Registrant: Holland & Knight LLP, 800 17th Street, N.W., Suite #1100, Washington, DC 20006-3906, Phone: (202) 955-3000, Fax: (202) 955-5564, Email:
GOLD HILL NC2, 281 Nc 68 (Lat: 36.278722 Lon: -79.940139), Type: Mast, Structure height: 52.1 m, Overall height: 54.9 m, Call Sign: WQIJ699, Assigned Frequencies: 6063.80 MHz, Grant Date: 02/28/2008, Expiration Date: 02/28/2018, Cancellation Date: 08/28/2009, Certifier: William Chastain, Registrant: Radio Dynamics Corporation, 774 Mays Blvd., #10-465, Silver Spring, MD 20914, Phone: (301) 493-5171, Fax: (301) 576-4553, Email:
Sta 157 Pine Needle, 8001 Haw River Rd (Lat: 36.213833 Lon: -79.970056), Type: Ltower, Structure height: 50.3 m, Overall height: 51.8 m, Call Sign: WRCY864, Assigned Frequencies: 6197.24 MHz, 6256.54 MHz, Grant Date: 02/28/2019, Expiration Date: 02/28/2029, Certifier: Michael Masa, Registrant: Williams - Engineering & Integration, 295 Chipeta Way, Salt Lake City, UT 84108, Phone: (801) 584-6068, Fax: (713) 215-2266, Email:
5GB0389A, Sr 1104 And Sr 1102 (092635 / Troublesome Creek) (Lat: 36.270806 Lon: -79.944722), Type: Gtower, Structure height: 73.1 m, Overall height: 76.2 m, Call Sign: WRDZ470, Assigned Frequencies: 11265.0 MHz, 11265.0 MHz, 11265.0 MHz, 11265.0 MHz, 11265.0 MHz, 11265.0 MHz, 11265.0 MHz, 11265.0 MHz, Grant Date: 08/27/2019, Expiration Date: 08/27/2029, Cancellation Date: 08/25/2020, Certifier: David Werblow, Registrant: T-Mobile Usa, Inc., 12920 Se 38th Street, Bellevue, WA 98006, Phone: (425) 383-8401, Fax: (425) 383-4040, Email:
CLRDU00408A, 9578 Nc 65 (Lat: 36.261389 Lon: -79.935833), Type: Mast, Structure height: 57.9 m, Call Sign: WRXC778, Assigned Frequencies: 11225.0 MHz, 11225.0 MHz, 11225.0 MHz, 11225.0 MHz, 11225.0 MHz, 11225.0 MHz, 11225.0 MHz, 11225.0 MHz, 11225.0 MHz, 11225.0 MHz, 11225.0 MHz, 11225.0 MHz, Grant Date: 04/26/2023, Expiration Date: 04/26/2033, Certifier: Alison A Minea, Registrant: Dish Wireless L.L.C., 9601 S Meridan Blvd, Englewood, CO 80112, Phone: (202) 463-3709, Email:
TROUBLESOME, 3 Miles Ne Of (Lat: 36.270667 Lon: -79.944750), Overall height: 75.6 m, Call Sign: WLB392, Assigned Frequencies: 3710.00 MHz, 3730.00 MHz, 3710.00 MHz, 3730.00 MHz, 3790.00 MHz, 3810.00 MHz, 3790.00 MHz, 3810.00 MHz, 3870.00 MHz, 3890.00 MHz... (+14 more), Grant Date: 02/27/2001, Expiration Date: 02/01/2011, Cancellation Date: 12/06/2001, Registrant: Mci Worldcom Network Services, Inc, 2270 Lakeside Blvd 2865/642, Richardson, TX 75082, Phone: (972) 656-5287, Fax: (972) 656-1622, Email:
FCC Registered Amateur Radio Licenses: 38 (
See the full list of FCC Registered Amateur Radio Licenses in Stokesdale )
FAA Registered Aircraft: 10 (
See the full list of FAA Registered Aircraft in Stokesdale )
Home Mortgage Disclosure Act Aggregated Statistics For Year 2009(Based on 1 partial tract) A) FHA, FSA/RHS & VA B) Conventional C) Refinancings D) Home Improvement Loans F) Non-occupant Loans on G) Loans On Manufactured Number Average Value Number Average Value Number Average Value Number Average Value Number Average Value Number Average Value
LOANS ORIGINATED 21 $173,272 42 $257,834 201 $220,061 5 $67,256 5 $209,028 4 $109,345 APPLICATIONS APPROVED, NOT ACCEPTED 1 $94,400 2 $268,965 18 $188,558 2 $48,600 1 $92,170 1 $68,150 APPLICATIONS DENIED 2 $115,350 6 $200,910 40 $228,537 3 $34,633 1 $283,770 2 $80,995 APPLICATIONS WITHDRAWN 2 $113,955 6 $284,978 40 $189,016 2 $78,205 2 $140,210 2 $74,295 FILES CLOSED FOR INCOMPLETENESS 0 $0 0 $0 13 $226,104 1 $188,250 0 $0 1 $81,560
Aggregated Statistics For Year 2008(Based on 1 partial tract) A) FHA, FSA/RHS & VA B) Conventional C) Refinancings D) Home Improvement Loans F) Non-occupant Loans on G) Loans On Manufactured Number Average Value Number Average Value Number Average Value Number Average Value Number Average Value Number Average Value
LOANS ORIGINATED 12 $155,802 61 $214,585 88 $181,685 7 $98,793 8 $176,448 4 $101,665 APPLICATIONS APPROVED, NOT ACCEPTED 2 $139,370 4 $152,498 14 $159,401 1 $33,520 1 $136,860 2 $106,970 APPLICATIONS DENIED 4 $158,642 8 $308,486 45 $166,028 7 $71,820 1 $131,830 4 $78,902 APPLICATIONS WITHDRAWN 2 $155,570 11 $256,042 32 $196,330 4 $98,872 1 $175,400 2 $55,580 FILES CLOSED FOR INCOMPLETENESS 1 $118,980 2 $134,900 3 $198,490 1 $11,170 1 $130,150 0 $0
Aggregated Statistics For Year 2007(Based on 1 partial tract) A) FHA, FSA/RHS & VA B) Conventional C) Refinancings D) Home Improvement Loans E) Loans on Dwellings For 5+ Families F) Non-occupant Loans on G) Loans On Manufactured Number Average Value Number Average Value Number Average Value Number Average Value Number Average Value Number Average Value Number Average Value
LOANS ORIGINATED 5 $146,464 128 $199,665 79 $229,691 12 $66,241 1 $86,020 9 $163,483 7 $71,980 APPLICATIONS APPROVED, NOT ACCEPTED 1 $52,510 9 $150,573 19 $128,272 3 $25,697 0 $0 3 $67,777 3 $49,900 APPLICATIONS DENIED 2 $309,465 14 $190,363 52 $139,070 8 $39,171 0 $0 4 $117,865 8 $88,678 APPLICATIONS WITHDRAWN 2 $154,175 13 $180,772 31 $171,635 2 $121,215 0 $0 3 $132,573 1 $78,200 FILES CLOSED FOR INCOMPLETENESS 0 $0 1 $110,040 6 $190,297 1 $59,210 0 $0 0 $0 0 $0
Aggregated Statistics For Year 2006(Based on 1 partial tract) A) FHA, FSA/RHS & VA B) Conventional C) Refinancings D) Home Improvement Loans F) Non-occupant Loans on G) Loans On Manufactured Number Average Value Number Average Value Number Average Value Number Average Value Number Average Value Number Average Value
LOANS ORIGINATED 9 $164,973 153 $185,908 97 $159,287 13 $42,926 16 $120,204 6 $98,593 APPLICATIONS APPROVED, NOT ACCEPTED 0 $0 14 $177,116 23 $118,957 1 $1,120 2 $111,720 2 $54,185 APPLICATIONS DENIED 0 $0 25 $167,267 77 $152,229 7 $40,219 5 $155,626 11 $59,872 APPLICATIONS WITHDRAWN 1 $62,560 14 $208,398 25 $208,894 2 $60,330 2 $140,765 1 $97,750 FILES CLOSED FOR INCOMPLETENESS 0 $0 2 $279,580 12 $201,049 1 $96,640 0 $0 1 $86,580
Aggregated Statistics For Year 2005(Based on 1 partial tract) A) FHA, FSA/RHS & VA B) Conventional C) Refinancings D) Home Improvement Loans F) Non-occupant Loans on G) Loans On Manufactured Number Average Value Number Average Value Number Average Value Number Average Value Number Average Value Number Average Value
LOANS ORIGINATED 11 $166,666 153 $181,490 103 $132,687 15 $96,228 14 $121,016 5 $75,858 APPLICATIONS APPROVED, NOT ACCEPTED 0 $0 14 $128,239 27 $119,582 1 $25,700 1 $209,470 3 $106,507 APPLICATIONS DENIED 2 $212,545 20 $142,443 75 $141,996 10 $101,274 2 $241,035 12 $104,784 APPLICATIONS WITHDRAWN 0 $0 13 $143,517 52 $147,406 4 $133,925 2 $186,570 6 $72,805 FILES CLOSED FOR INCOMPLETENESS 0 $0 1 $183,780 11 $183,678 1 $90,490 0 $0 0 $0
Aggregated Statistics For Year 2004(Based on 1 partial tract) A) FHA, FSA/RHS & VA B) Conventional C) Refinancings D) Home Improvement Loans F) Non-occupant Loans on G) Loans On Manufactured Number Average Value Number Average Value Number Average Value Number Average Value Number Average Value Number Average Value
LOANS ORIGINATED 9 $144,491 109 $193,219 105 $138,432 9 $50,522 9 $123,637 3 $65,543 APPLICATIONS APPROVED, NOT ACCEPTED 1 $45,250 6 $190,390 11 $117,103 1 $43,570 0 $0 1 $53,630 APPLICATIONS DENIED 1 $94,400 11 $120,861 64 $120,614 9 $44,440 4 $175,680 9 $91,238 APPLICATIONS WITHDRAWN 1 $214,500 13 $197,186 50 $153,168 3 $145,237 1 $237,410 1 $99,430 FILES CLOSED FOR INCOMPLETENESS 0 $0 2 $190,205 10 $133,450 0 $0 1 $59,210 1 $49,160
Aggregated Statistics For Year 2003(Based on 1 partial tract) A) FHA, FSA/RHS & VA B) Conventional C) Refinancings D) Home Improvement Loans F) Non-occupant Loans on Number Average Value Number Average Value Number Average Value Number Average Value Number Average Value
LOANS ORIGINATED 12 $158,317 101 $163,310 296 $144,391 8 $58,444 9 $118,858 APPLICATIONS APPROVED, NOT ACCEPTED 0 $0 6 $164,693 27 $151,711 2 $17,875 1 $29,050 APPLICATIONS DENIED 1 $18,430 15 $109,151 60 $129,800 6 $80,067 1 $151,380 APPLICATIONS WITHDRAWN 1 $140,210 11 $150,924 35 $139,219 0 $0 1 $151,940 FILES CLOSED FOR INCOMPLETENESS 0 $0 1 $145,240 9 $159,014 1 $33,520 1 $31,840
Aggregated Statistics For Year 2002(Based on 1 partial tract) A) FHA, FSA/RHS & VA B) Conventional C) Refinancings D) Home Improvement Loans F) Non-occupant Loans on Number Average Value Number Average Value Number Average Value Number Average Value Number Average Value
LOANS ORIGINATED 15 $129,893 70 $151,804 155 $145,885 6 $34,168 6 $156,128 APPLICATIONS APPROVED, NOT ACCEPTED 2 $169,815 15 $96,340 21 $144,385 2 $13,405 1 $58,090 APPLICATIONS DENIED 0 $0 13 $96,810 50 $112,089 3 $13,593 1 $98,310 APPLICATIONS WITHDRAWN 2 $141,045 7 $174,203 23 $139,213 0 $0 1 $65,910 FILES CLOSED FOR INCOMPLETENESS 0 $0 2 $90,215 4 $191,040 1 $49,160 0 $0
Aggregated Statistics For Year 2001(Based on 1 partial tract) A) FHA, FSA/RHS & VA B) Conventional C) Refinancings D) Home Improvement Loans F) Non-occupant Loans on Number Average Value Number Average Value Number Average Value Number Average Value Number Average Value
LOANS ORIGINATED 8 $127,850 72 $149,185 116 $139,746 9 $18,558 6 $89,748 APPLICATIONS APPROVED, NOT ACCEPTED 0 $0 11 $108,368 12 $92,960 2 $5,585 1 $98,310 APPLICATIONS DENIED 1 $141,880 14 $78,802 40 $116,636 7 $16,759 0 $0 APPLICATIONS WITHDRAWN 1 $80,440 4 $140,070 20 $146,437 2 $33,795 1 $144,680 FILES CLOSED FOR INCOMPLETENESS 0 $0 0 $0 3 $92,913 0 $0 0 $0
Aggregated Statistics For Year 2000(Based on 1 partial tract) A) FHA, FSA/RHS & VA B) Conventional C) Refinancings D) Home Improvement Loans F) Non-occupant Loans on Number Average Value Number Average Value Number Average Value Number Average Value Number Average Value
LOANS ORIGINATED 8 $109,835 77 $145,185 34 $96,457 8 $22,204 4 $83,650 APPLICATIONS APPROVED, NOT ACCEPTED 5 $54,072 11 $72,923 10 $80,997 5 $31,952 0 $0 APPLICATIONS DENIED 3 $38,917 15 $77,422 26 $73,434 4 $13,408 1 $11,170 APPLICATIONS WITHDRAWN 1 $103,900 6 $94,683 11 $106,591 0 $0 1 $43,010 FILES CLOSED FOR INCOMPLETENESS 0 $0 1 $202,770 8 $100,968 0 $0 0 $0
Aggregated Statistics For Year 1999(Based on 1 partial tract) A) FHA, FSA/RHS & VA B) Conventional C) Refinancings D) Home Improvement Loans F) Non-occupant Loans on Number Average Value Number Average Value Number Average Value Number Average Value Number Average Value
LOANS ORIGINATED 11 $119,354 94 $135,785 79 $99,727 12 $20,439 11 $65,276 APPLICATIONS APPROVED, NOT ACCEPTED 1 $63,810 12 $62,981 14 $86,129 3 $7,030 1 $98,220 APPLICATIONS DENIED 1 $98,770 34 $55,425 43 $88,177 12 $11,838 3 $61,040 APPLICATIONS WITHDRAWN 1 $149,820 4 $155,510 31 $88,193 2 $49,940 1 $97,110 FILES CLOSED FOR INCOMPLETENESS 0 $0 4 $129,570 9 $62,333 0 $0 0 $0
Detailed HMDA statistics for the following Tracts:
0159.00
Private Mortgage Insurance Companies Aggregated Statistics For Year 2009(Based on 1 partial tract) A) Conventional B) Refinancings Number Average Value Number Average Value
LOANS ORIGINATED 8 $221,974 9 $263,846 APPLICATIONS APPROVED, NOT ACCEPTED 0 $0 1 $122,330 APPLICATIONS DENIED 1 $211,150 0 $0 APPLICATIONS WITHDRAWN 1 $202,770 1 $200,540 FILES CLOSED FOR INCOMPLETENESS 0 $0 1 $200,540
Aggregated Statistics For Year 2008(Based on 1 partial tract) A) Conventional B) Refinancings C) Non-occupant Loans on Number Average Value Number Average Value Number Average Value
LOANS ORIGINATED 12 $210,499 7 $222,721 2 $143,000 APPLICATIONS APPROVED, NOT ACCEPTED 2 $262,820 4 $152,218 0 $0 APPLICATIONS DENIED 1 $205,560 1 $89,380 1 $205,560 APPLICATIONS WITHDRAWN 1 $201,100 0 $0 0 $0 FILES CLOSED FOR INCOMPLETENESS 1 $72,620 1 $202,770 0 $0
Aggregated Statistics For Year 2007(Based on 1 partial tract) A) Conventional B) Refinancings C) Non-occupant Loans on D) Loans On Manufactured Number Average Value Number Average Value Number Average Value Number Average Value
LOANS ORIGINATED 31 $192,825 11 $204,753 3 $89,750 1 $58,650 APPLICATIONS APPROVED, NOT ACCEPTED 2 $232,100 2 $261,705 0 $0 0 $0 APPLICATIONS DENIED 0 $0 0 $0 0 $0 0 $0 APPLICATIONS WITHDRAWN 1 $325,110 1 $170,370 0 $0 0 $0 FILES CLOSED FOR INCOMPLETENESS 0 $0 0 $0 0 $0 0 $0
Aggregated Statistics For Year 2006(Based on 1 partial tract) A) Conventional B) Refinancings C) Non-occupant Loans on Number Average Value Number Average Value Number Average Value
LOANS ORIGINATED 18 $213,758 3 $202,400 2 $124,845 APPLICATIONS APPROVED, NOT ACCEPTED 1 $214,500 1 $106,130 1 $156,970 APPLICATIONS DENIED 1 $346,890 0 $0 0 $0 APPLICATIONS WITHDRAWN 2 $396,605 1 $226,230 0 $0 FILES CLOSED FOR INCOMPLETENESS 0 $0 0 $0 0 $0
Aggregated Statistics For Year 2005(Based on 1 partial tract) A) Conventional B) Refinancings Number Average Value Number Average Value
LOANS ORIGINATED 16 $174,807 12 $172,235 APPLICATIONS APPROVED, NOT ACCEPTED 4 $156,408 3 $161,620 APPLICATIONS DENIED 1 $49,720 0 $0 APPLICATIONS WITHDRAWN 1 $210,030 1 $59,210 FILES CLOSED FOR INCOMPLETENESS 0 $0 0 $0
Aggregated Statistics For Year 2004(Based on 1 partial tract) A) Conventional B) Refinancings C) Non-occupant Loans on D) Loans On Manufactured Number Average Value Number Average Value Number Average Value Number Average Value
LOANS ORIGINATED 20 $184,562 12 $191,274 1 $36,310 1 $102,780 APPLICATIONS APPROVED, NOT ACCEPTED 2 $228,465 5 $170,150 1 $56,980 0 $0 APPLICATIONS DENIED 0 $0 1 $55,300 0 $0 0 $0 APPLICATIONS WITHDRAWN 1 $154,730 1 $151,940 0 $0 0 $0 FILES CLOSED FOR INCOMPLETENESS 0 $0 1 $60,890 0 $0 0 $0
Aggregated Statistics For Year 2003(Based on 1 partial tract) A) Conventional B) Refinancings C) Non-occupant Loans on Number Average Value Number Average Value Number Average Value
LOANS ORIGINATED 23 $183,293 45 $162,850 1 $56,980 APPLICATIONS APPROVED, NOT ACCEPTED 2 $186,850 15 $153,057 0 $0 APPLICATIONS DENIED 0 $0 1 $92,170 0 $0 APPLICATIONS WITHDRAWN 1 $75,970 2 $110,880 0 $0 FILES CLOSED FOR INCOMPLETENESS 0 $0 0 $0 0 $0
Aggregated Statistics For Year 2002(Based on 1 partial tract) A) Conventional B) Refinancings C) Non-occupant Loans on Number Average Value Number Average Value Number Average Value
LOANS ORIGINATED 17 $155,422 21 $153,881 1 $83,230 APPLICATIONS APPROVED, NOT ACCEPTED 3 $176,147 5 $161,212 0 $0 APPLICATIONS DENIED 0 $0 1 $69,270 0 $0 APPLICATIONS WITHDRAWN 1 $78,760 2 $84,070 0 $0 FILES CLOSED FOR INCOMPLETENESS 0 $0 1 $48,040 0 $0
Aggregated Statistics For Year 2001(Based on 1 partial tract) A) Conventional B) Refinancings C) Non-occupant Loans on Number Average Value Number Average Value Number Average Value
LOANS ORIGINATED 18 $172,669 20 $144,146 1 $56,420 APPLICATIONS APPROVED, NOT ACCEPTED 4 $178,055 4 $136,998 0 $0 APPLICATIONS DENIED 0 $0 2 $137,135 0 $0 APPLICATIONS WITHDRAWN 1 $72,060 2 $95,240 0 $0 FILES CLOSED FOR INCOMPLETENESS 0 $0 1 $87,140 0 $0
Aggregated Statistics For Year 2000(Based on 1 partial tract) A) Conventional B) Refinancings C) Non-occupant Loans on Number Average Value Number Average Value Number Average Value
LOANS ORIGINATED 16 $158,189 3 $121,403 1 $63,120 APPLICATIONS APPROVED, NOT ACCEPTED 2 $147,470 1 $200,540 0 $0 APPLICATIONS DENIED 1 $46,920 0 $0 0 $0 APPLICATIONS WITHDRAWN 0 $0 0 $0 0 $0 FILES CLOSED FOR INCOMPLETENESS 0 $0 0 $0 0 $0
Aggregated Statistics For Year 1999(Based on 1 partial tract) A) Conventional B) Refinancings C) Non-occupant Loans on Number Average Value Number Average Value Number Average Value
LOANS ORIGINATED 19 $161,125 7 $114,310 1 $42,730 APPLICATIONS APPROVED, NOT ACCEPTED 1 $208,640 1 $151,490 0 $0 APPLICATIONS DENIED 0 $0 1 $93,220 0 $0 APPLICATIONS WITHDRAWN 1 $85,450 0 $0 0 $0 FILES CLOSED FOR INCOMPLETENESS 1 $97,110 0 $0 0 $0
Detailed PMIC statistics for the following Tracts:
0159.00
Most common first names in Stokesdale, NC among deceased individuals Name Count Lived (average)
William 49 73.5 years James 43 71.2 years John 33 72.6 years Robert 29 70.1 years Mary 25 72.9 years Thomas 16 69.8 years Annie 13 81.1 years Charles 13 68.6 years Ruby 13 82.1 years David 11 67.4 years
Most common last names in Stokesdale, NC among deceased individuals Last name Count Lived (average)
Angel 21 77.2 years Neal 19 73.6 years Pegram 19 77.4 years Wilson 19 75.1 years Smith 17 79.5 years Williams 16 81.8 years Moore 16 71.9 years Southern 16 70.5 years Southard 15 75.4 years Friddle 13 80.1 years
Stokesdale compared to North Carolina state average:
Median household income above state average. Unemployed percentage significantly below state average. Median age below state average. Foreign-born population percentage above state average. Renting percentage below state average. Length of stay since moving in above state average. Number of rooms per house above state average. House age below state average. Number of college students above state average. Percentage of population with a bachelor's degree or higher above state average. Stokesdale on our top lists :
#49 on the list of "Top 101 cities with largest percentage of females in occupations: construction and extraction occupations (population 5,000+)"
#87 on the list of "Top 101 cities with the most residents born in Argentina (population 500+)"
#16 on the list of "Top 101 counties with the highest number of infant deaths per 1000 residents 2007-2013 (pop. 50,000+)"
#31 on the list of "Top 101 counties with the lowest percentage of residents that drank alcohol in the past 30 days"
#34 on the list of "Top 101 counties with the most Mainline Protestant congregations"
#35 on the list of "Top 101 counties with the most Mainline Protestant adherents"
#41 on the list of "Top 101 counties with the highest average weight of females"
Top Patent Applicants
Jerry Wayne Marshall (18)
James Leroy Daniels (9)
Roger E. Gordon (4)
James Daniels (4)
Bryan Scott Puckett (3)
David C. Dening (3)
Darrell Wayne Craig (2)
Dan Clevenger (2)
Benjamin T. Siler (2)
James L. Daniels (2)
Total of 68 patent applications in 2008-2024.
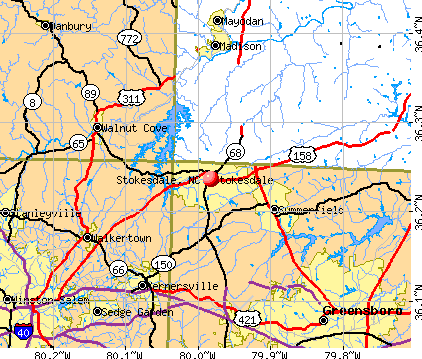


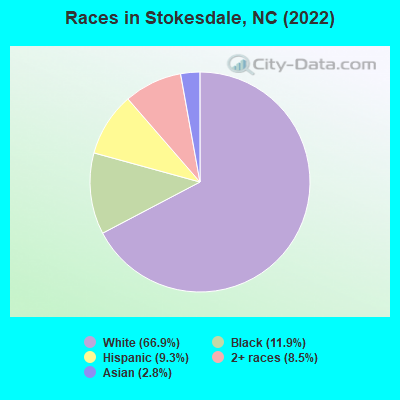
 Recent articles from our blog. Our writers, many of them Ph.D. graduates or candidates, create easy-to-read articles on a wide variety of topics.

 (14.1 miles
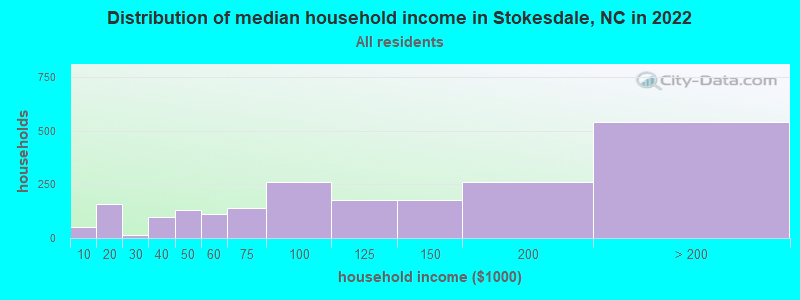
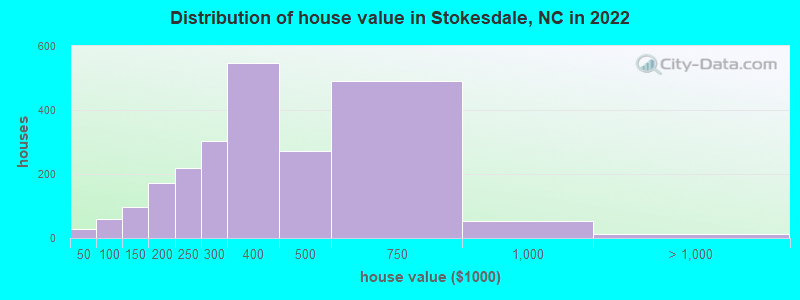

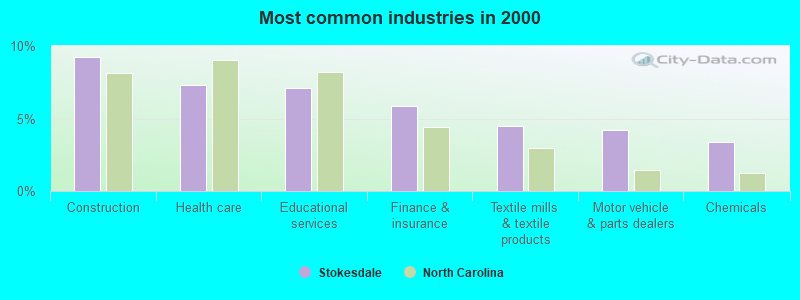
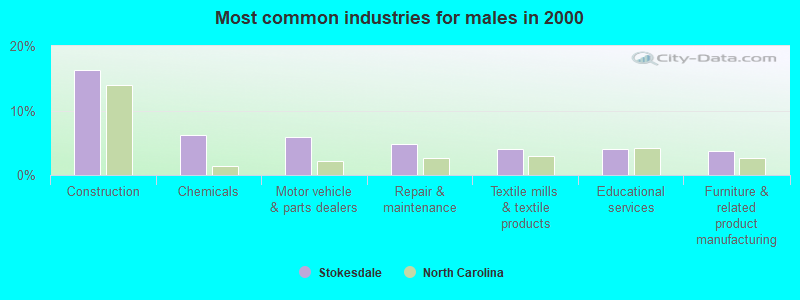
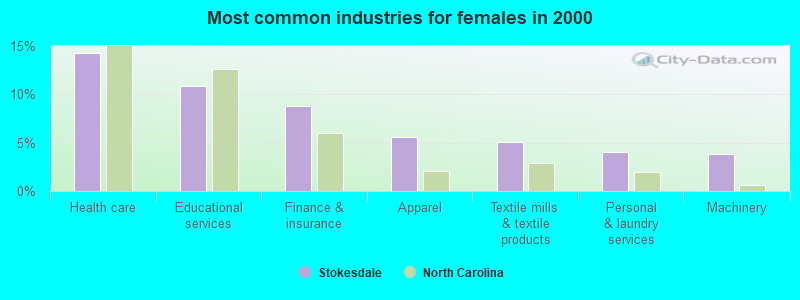
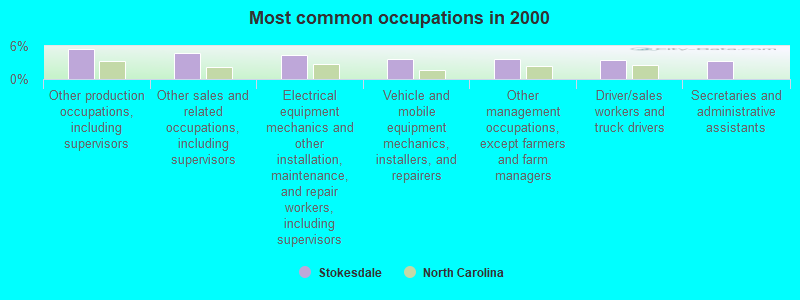
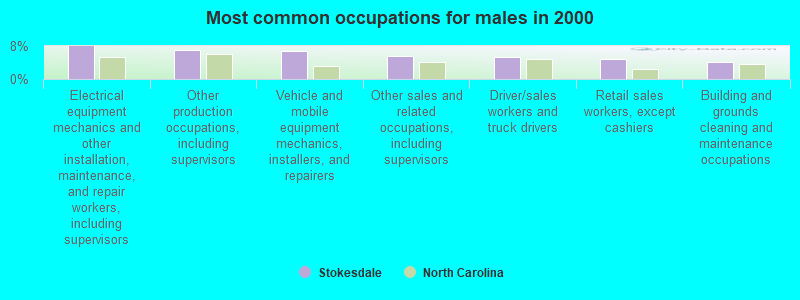
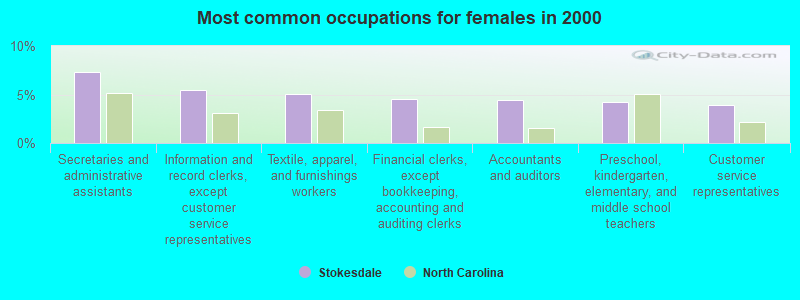


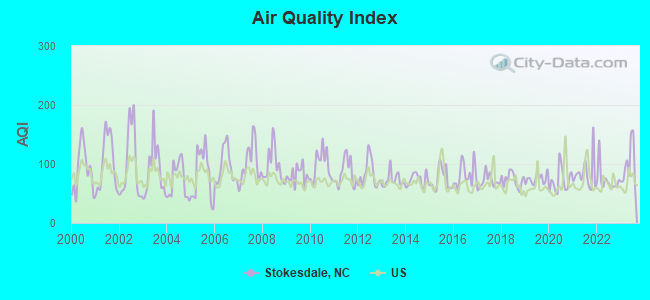
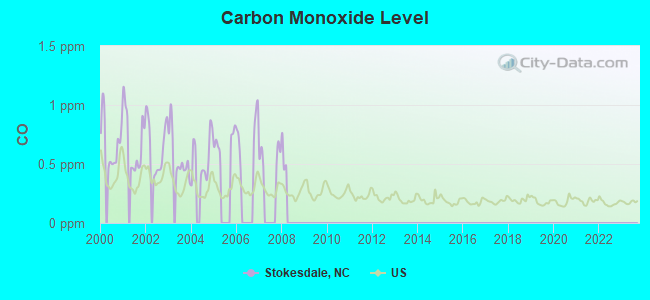
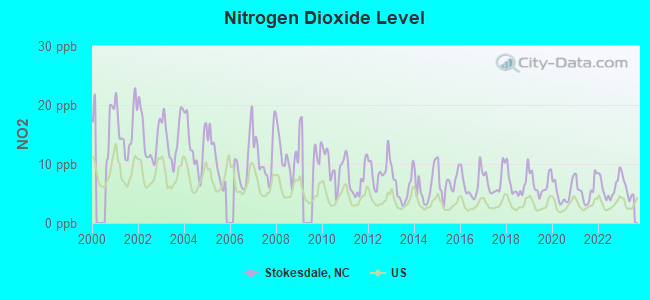
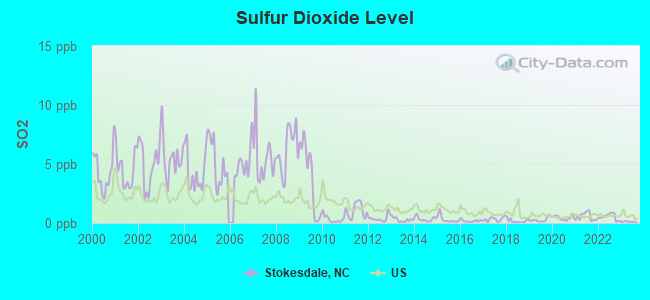
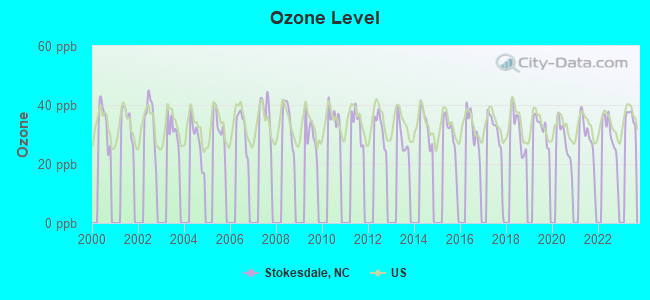
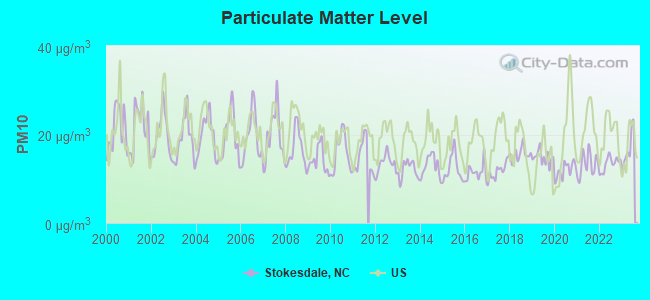
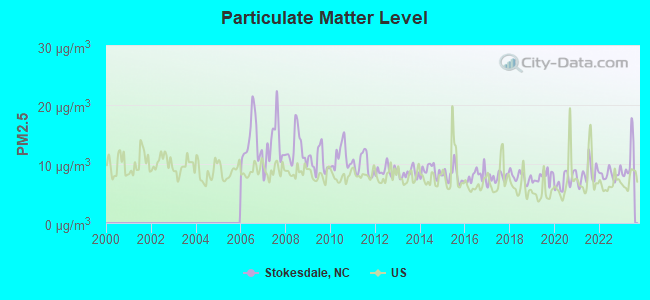

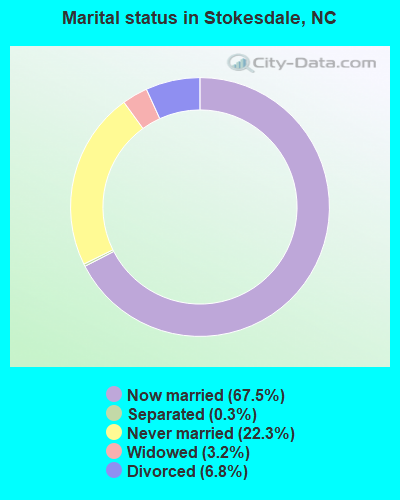
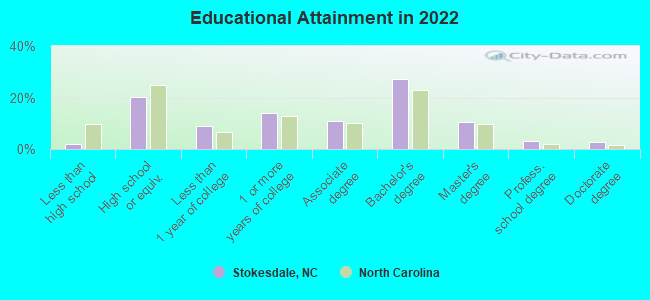
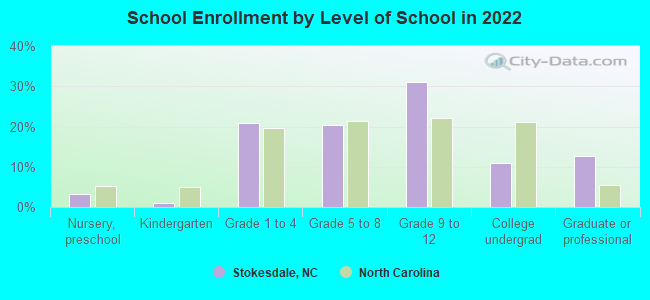
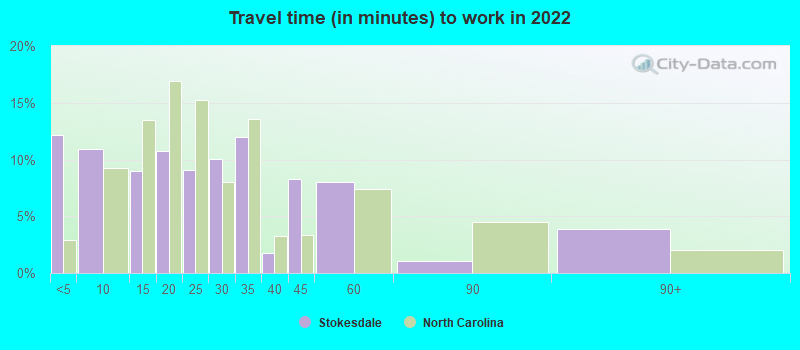
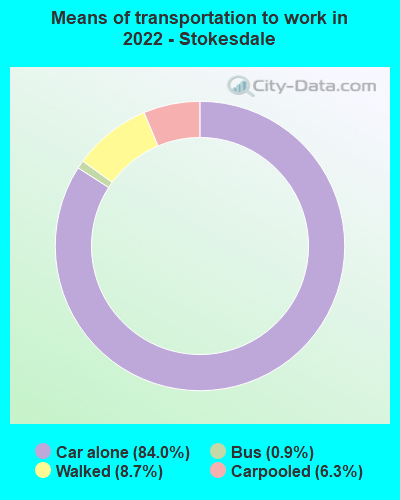
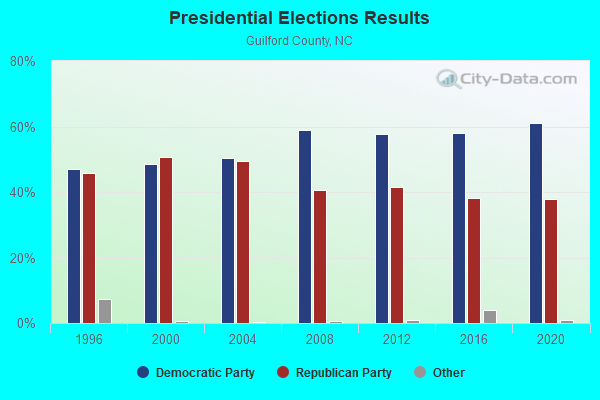
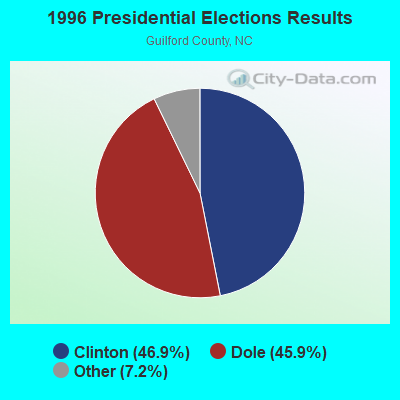
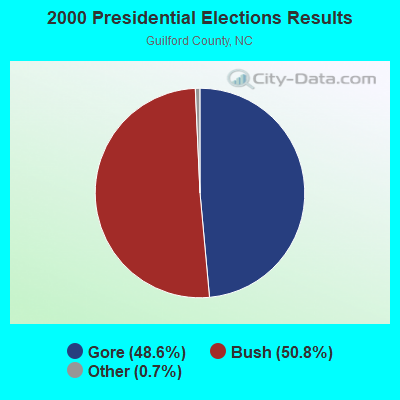
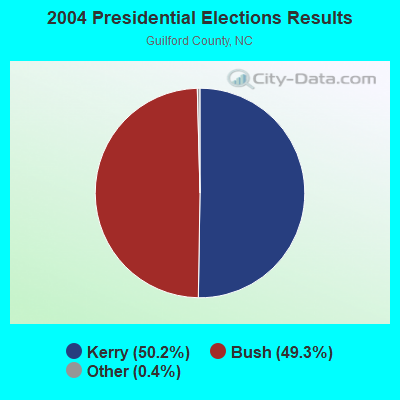
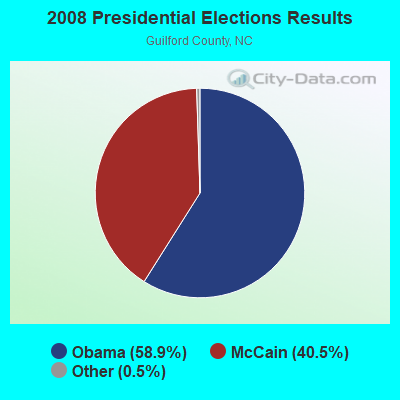
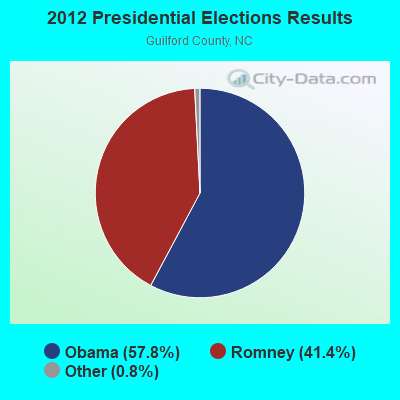
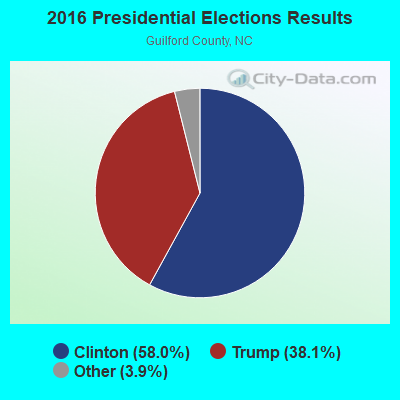
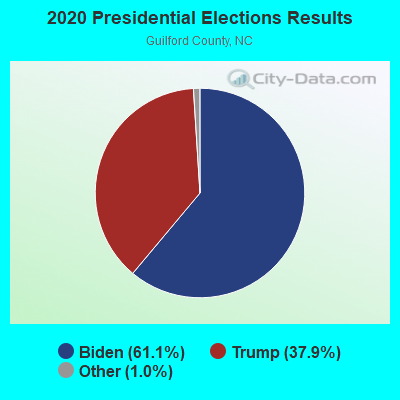
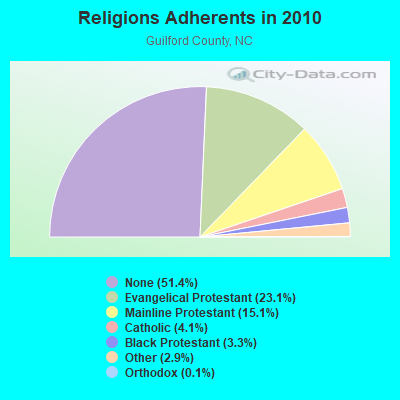
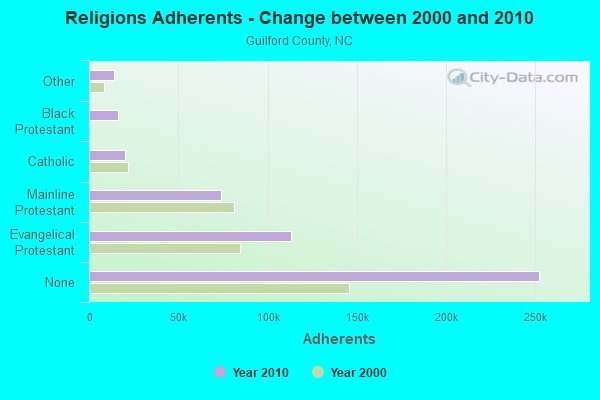
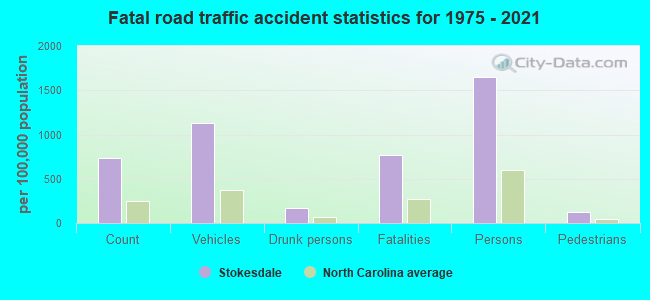
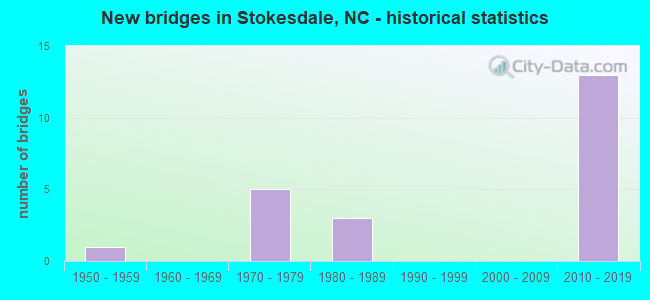
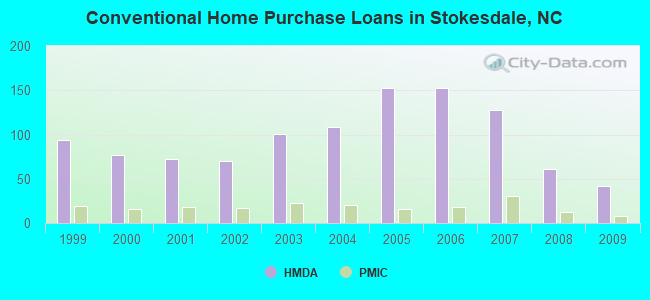
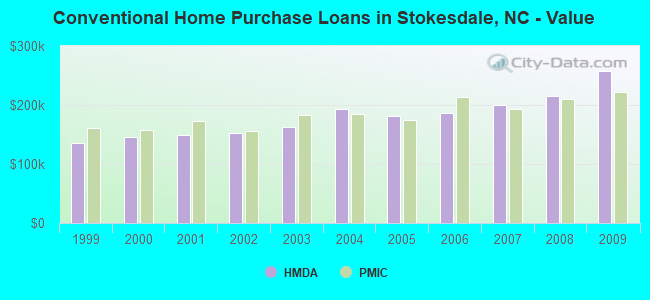
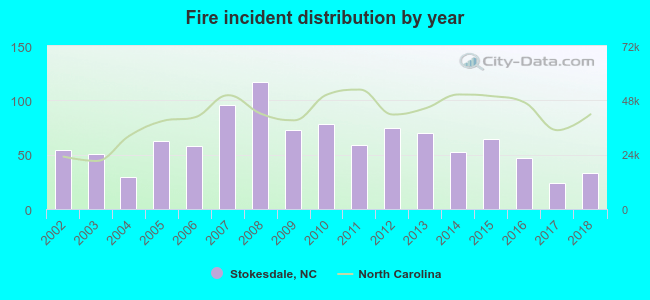 According to the data from the years 2002 - 2018 the average number of fires per year is 61. The highest number of fires - 117 took place in 2008, and the least - 24 in 2017. The data has a declining trend.
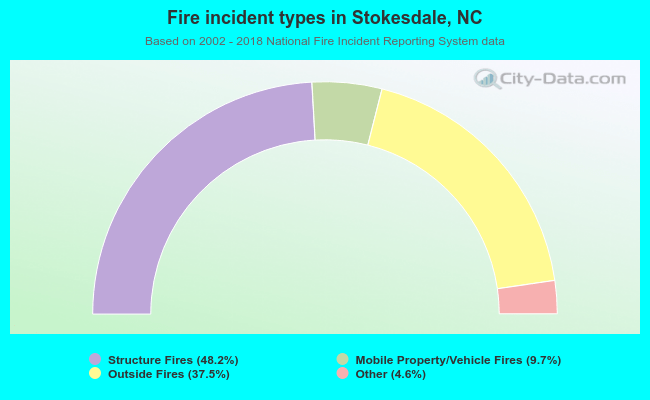 When looking into fire subcategories, the most reports belonged to: Structure Fires (48.2%), and Outside Fires (37.5%).