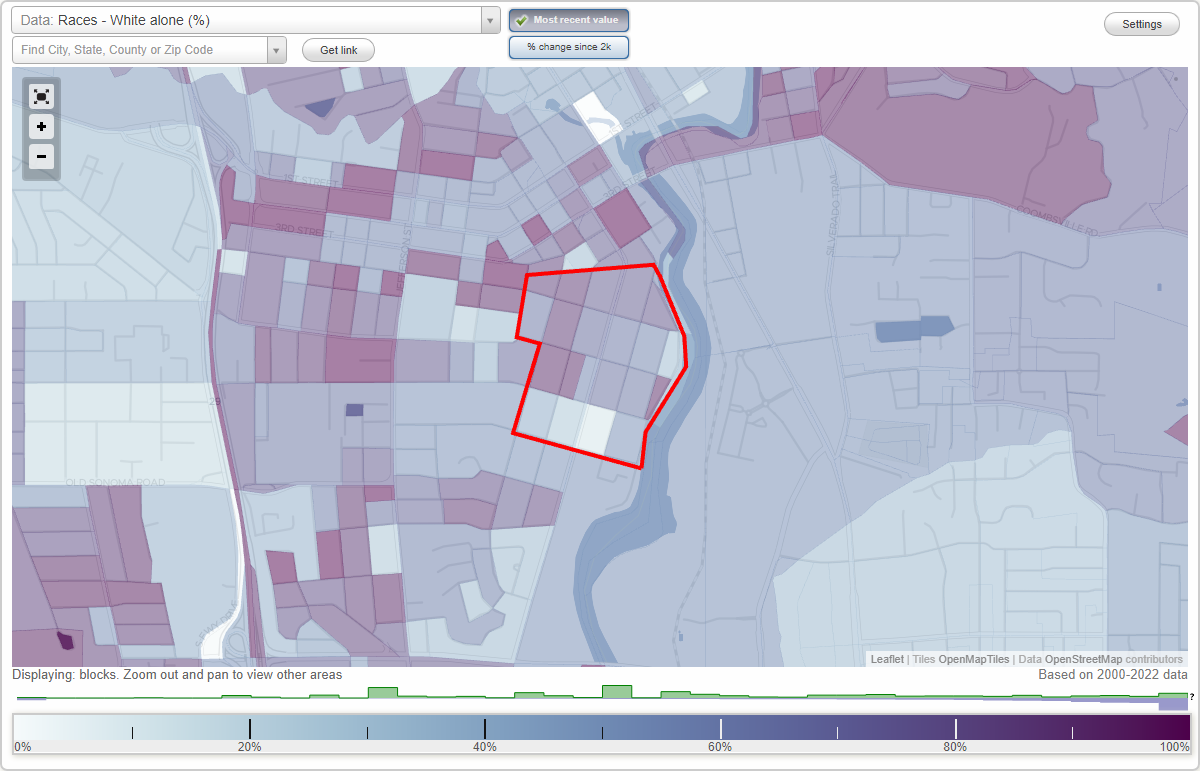
Abajo (Napa Abajo) neighborhood in Napa, California (CA), 94559 detailed profile
Settings
X

Business Search - 14 Million verified businesses
Area: 0.142 square miles
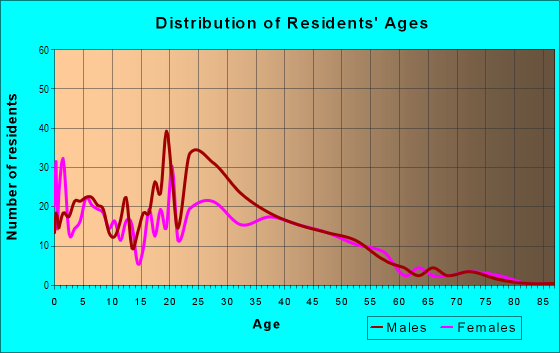
Population: 1,206
Population density:
| Abajo (Napa Abajo): | 8,466 people per square mile |
| Napa: | 4,425 people per square mile |

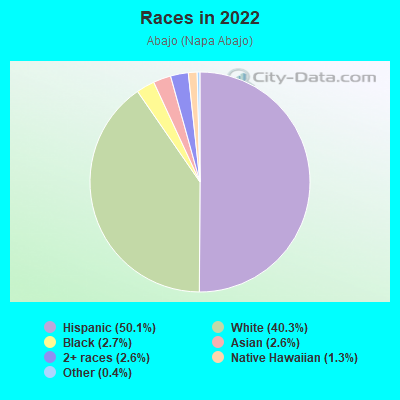
- 63350.1%Hispanic or Latino
- 50940.3%White
- 342.7%Black
- 332.6%Asian
- 332.6%Two or more races
- 171.3%Native Hawaiian and Other
Pacific Islander - 50.4%Some other race
Median household income in 2022:
| Abajo (Napa Abajo): | $79,563 |
| Napa: | $94,248 |
Distribution of median household income
![Distribution of median household income]()
- 31Less than $10,000
- 43$10,000 to $19,999
- 39$20,000 to $29,999
- 50$30,000 to $39,999
- 120$40,000 to $49,999
- 30$50,000 to $59,999
- 47$60,000 to $74,999
- 72$75,000 to $99,999
- 74$100,000 to $124,999
- 30$125,000 to $149,999
- 60$150,000 to $199,999
- 47$200,000 or more

Distribution of owner-occupied house/condo value
![Distribution of owner-occupied house/condo value]()
- 14Less than $50,000
- 10$50,000 to $99,999
- 14$100,000 to $149,999
- 13$400,000 to $499,999
- 76$500,000 to $749,999
- 56$750,000 to $999,999
- 63$1,000,000 or more

Distribution of rent paid by renters
![Distribution of rent paid by renters]()
- 10$100 to $199
- 44$200 to $299
- 13$400 to $499
- 19$500 to $599
- 43$600 to $699
- 21$1,000 to $1,249
- 87$1,250 to $1,499
- 153$1,500 to $1,999
- 86$2,000 or more

Median rent in 2022:
| Abajo (Napa Abajo): | $1,701 |
| Napa: | $1,913 |
| Males: | 579 |
| Females: | 626 |
Males:
| This neighborhood: | 37.4 years |
| Whole city: | 41.0 years |
| This neighborhood: | 38.8 years |
| Whole city: | 41.5 years |
Average household size:
| Abajo (Napa Abajo): | 2.3 people |
| Napa: | 2.5 people |
Percentage of family households:
| Abajo (Napa Abajo): | 42.1% |
| Napa: | 46.8% |
| Here: | 37.4% |
| Napa: | 46.9% |
Percentage of married-couple families with children (among all households):
| Abajo (Napa Abajo): | 34.2% |
| Napa: | 30.7% |
Percentage of single-mother households (among all households):
| Abajo (Napa Abajo): | 9.0% |
| Napa: | 6.0% |
Percentage of never married males 15 years old and over:
Percentage of never married females 15 years old and over:
| Abajo (Napa Abajo): | 18.2% |
| Napa: | 20.7% |
Percentage of never married females 15 years old and over:
| Abajo (Napa Abajo): | 19.0% |
| city: | 14.7% |
Percentage of people that speak English not well or not at all:
| Abajo (Napa Abajo): | 9.4% |
| Napa: | 8.8% |
Percentage of people born in this state:
Percentage of people born in another U.S. state:
Percentage of native residents but born outside the U.S.:
Percentage of foreign born residents:
| Here: | 57.3% |
| Napa: | 61.4% |
Percentage of people born in another U.S. state:
| Abajo (Napa Abajo): | 17.9% |
| Napa: | 16.1% |
Percentage of native residents but born outside the U.S.:
| Here: | 4.4% |
| city: | 1.0% |
Percentage of foreign born residents:
| Here: | 20.4% |
| Napa: | 21.5% |
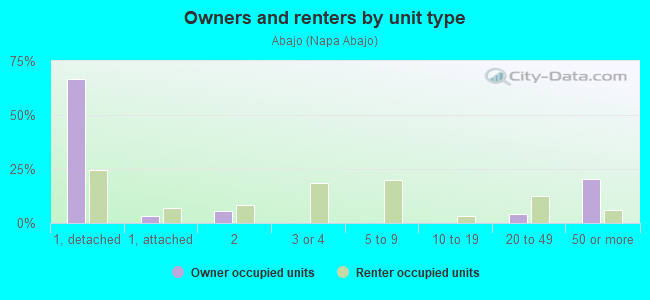
Owner-occupied
Renter-occupied

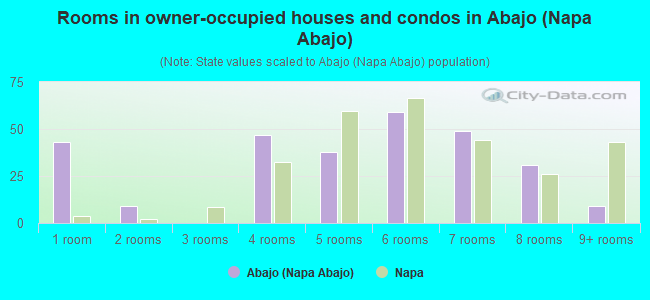
- Rooms in owner-occupied houses and condos in Abajo <
> - 431 room
- 92 rooms
- 03 rooms
- 474 rooms
- 385 rooms
- 596 rooms
- 497 rooms
- 318 rooms
- 99+ rooms
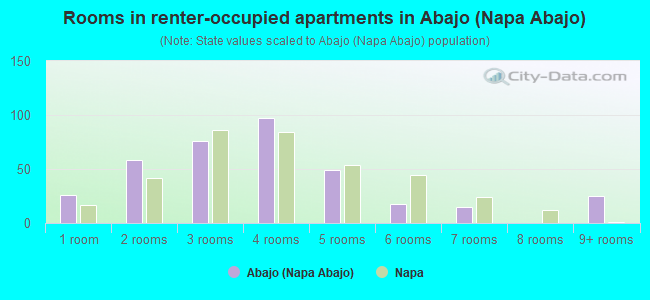
- Rooms in renter-occupied apartments in Abajo <
> - 261 room
- 582 rooms
- 763 rooms
- 974 rooms
- 495 rooms
- 186 rooms
- 157 rooms
- 08 rooms
- 259+ rooms
Owner-occupied
Renter-occupied
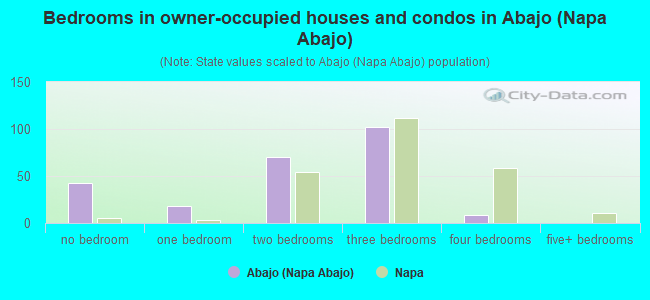
- Bedrooms in owner-occupied houses and condos in Abajo <
> - 43no bedroom
- 181 bedroom
- 702 bedrooms
- 1023 bedrooms
- 94 bedrooms
- 05+ bedrooms
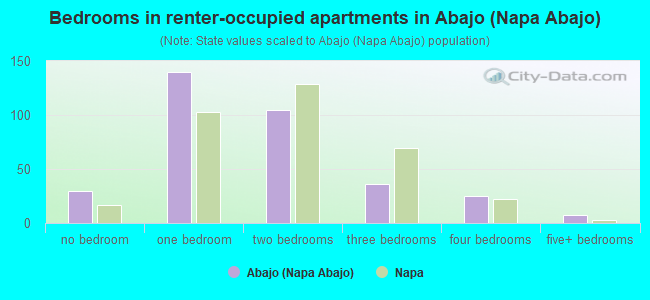
- Bedrooms in renter-occupied apartments in Abajo <
> - 30no bedroom
- 1401 bedroom
- 1052 bedrooms
- 363 bedrooms
- 254 bedrooms
- 75+ bedrooms
Average number of cars or other vehicles available in houses/condos:
Average number of cars or other vehicles available in apartments:
| This neighborhood: | 1.8 |
| Napa: | 2.2 |
Average number of cars or other vehicles available in apartments:
| Here: | 1.7 |
| city: | 1.8 |
Percentage of units with a mortgage:
| Abajo (Napa Abajo): | 62.9% |
| Napa: | 67.0% |
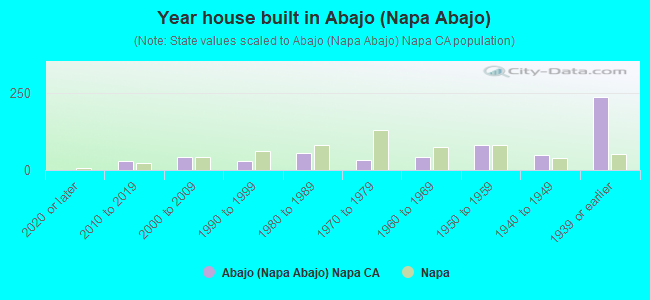
- Year house built in Abajo <
> - 02020 or later
- 282010 to 2019
- 412000 to 2009
- 281990 to 1999
- 541980 to 1989
- 321970 to 1979
- 411960 to 1969
- 831950 to 1959
- 491940 to 1949
- 2371939 or earlier
City-data.com crime index for city in 2020 (higher means more crime):
| City: | 193.0 |
| U.S. average: | 219.5 |
Travel time to work (commute)
![Travel time to work (commute)]()
- 10Less than 5 minutes
- 435 to 9 minutes
- 5610 to 14 minutes
- 7715 to 19 minutes
- 5520 to 24 minutes
- 2825 to 29 minutes
- 7230 to 34 minutes
- 735 to 39 minutes
- 2540 to 44 minutes
- 6145 to 59 minutes
- 1760 to 89 minutes
- 1490 or more minutes

Means of transportation to work
![Means of transportation to work]()
- 76.2%464Drove a car alone
- 6.1%37Carpooled
- 3.1%19Bus
- 1.0%6Ferryboat
- 3.4%21Bicycle
- 4.9%30Walked
- 4.1%25Other means
- 14.1%86Worked at home

Time leaving home to go to work
![Time leaving home to go to work]()
- 3112:00 a.m. to 4:59 a.m.
- 285:00 a.m. to 5:29 a.m.
- 305:30 a.m. to 5:59 a.m.
- 166:00 a.m. to 6:29 a.m.
- 336:30 a.m. to 6:59 a.m.
- 727:00 a.m. to 7:29 a.m.
- 737:30 a.m. to 7:59 a.m.
- 578:00 a.m. to 8:29 a.m.
- 148:30 a.m. to 8:59 a.m.
- 269:00 a.m. to 9:59 a.m.
- 1710:00 a.m. to 10:59 a.m.
- 2311:00 a.m. to 11:59 a.m.
- 8212:00 p.m. to 3:59 p.m.
- 84:00 p.m. to 11:59 p.m.

Occupations of males:
- Percentage of males in management occupations (except farmers):
Here: 9.4% city: 14.5%
- Percentage of males in business and financial operations occupations:
Here: 4.2% city: 4.1%
- Percentage of males in computer and mathematical occupations:
Here: 2.9% city: 2.6%
- Percentage of males in architecture and engineering occupations:
Here: 2.0% city: 2.5%
- Percentage of males in healthcare practitioners and technical occupations:
Here: 2.4% city: 1.9%
- Percentage of males in service occupations:
Here: 31.4% city: 18.1%
- Percentage of males in sales and office occupations:
Here: 9.2% city: 12.9%
- Percentage of males in farming, fishing, and forestry occupations:
Here: 1.5% city: 5.3%
- Percentage of males in construction, extraction, and maintenance occupations:
Here: 9.4% city: 8.4%
- Percentage of males in production occupations:
Here: 14.3% city: 8.6%
- Percentage of males in transportation occupations:
Here: 1.7% city: 4.5%
- Percentage of males in material moving occupations:
Here: 1.8% city: 3.8%
Occupations of females:
- Percentage of females in management occupations (except farmers):
Here: 10.5% city: 12.6%
- Percentage of females in business and financial operations occupations:
Here: 13.3% city: 6.6%
- Percentage of females in architecture and engineering occupations:
Here: 1.8% city: 0.4%
- Percentage of females in life, physical, and social science occupations:
Here: 1.2% city: 0.9%
- Percentage of females in legal occupations:
Here: 1.4% city: 0.6%
- Percentage of females in education, training, and library occupations:
Here: 7.5% city: 7.3%
- Percentage of females in healthcare practitioners and technical occupations:
Here: 10.2% city: 8.5%
- Percentage of females in service occupations:
Here: 18.5% city: 23.7%
- Percentage of females in sales and office occupations:
Here: 24.2% city: 25.5%
- Percentage of females in farming, fishing, and forestry occupations:
Here: 5.7% city: 2.5%
- Percentage of females in production occupations:
Here: 3.9% city: 3.1%
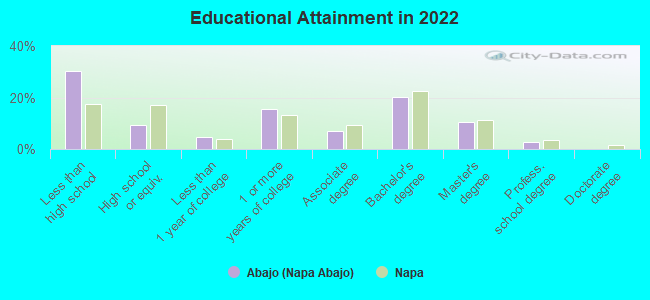
Education in this neighborhood (subdivision or community):
- Percentage of people 3 years and older in K-12 schools:
Abajo (Napa Abajo): 14.8% Napa: 14.8%
- Percentage of people 3 years and older in undergraduate colleges:
Abajo (Napa Abajo): 5.5% Napa: 4.5%
- Percentage of people 3 years and older in grad. or professional schools:
Abajo (Napa Abajo): 1.6% Napa: 1.2%
- Percentage of students K-12 enrolled in private schools:
Abajo (Napa Abajo): 23.4% Napa: 17.2%
Percentage of population below poverty level:
| Abajo (Napa Abajo): | 17.5% |
| Napa: | 9.1% |
Median year renter moved in (as recorded in 2022):
| Abajo (Napa Abajo): | 2016 |
| Napa: | 2018 |
Percentage of married-couple families with both working:
| Abajo (Napa Abajo): | 64.4% |
| Napa: | 71.9% |
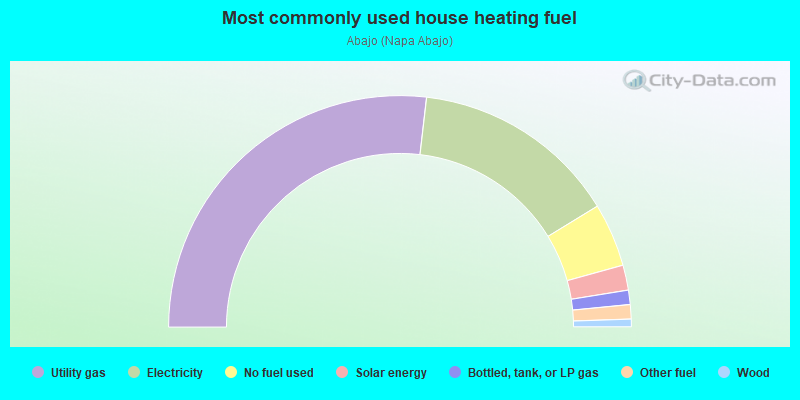
- 53.8%Utility gas
- 28.9%Electricity
- 8.9%No fuel used
- 3.5%Solar energy
- 2.0%Bottled, tank, or LP gas
- 2.0%Other fuel
- 1.1%Wood
Roads and streets:
Riverside Dr
Length: 0.49 miles
Directions: E-W, N-S, SE-NW, SW-NE
Address range: 201 to 599
Directions: E-W, N-S, SE-NW, SW-NE
Address range: 201 to 599
Brown St
Length: 0.43 miles
Directions: N-S, SW-NE
Address range: 200 to 564
Directions: N-S, SW-NE
Address range: 200 to 564
Laurel St
Length: 0.39 miles
Direction: E-W
Address range: 900 to 1399
Direction: E-W
Address range: 900 to 1399
Oak St
Length: 0.38 miles
Direction: E-W
Address range: 900 to 1399
Direction: E-W
Address range: 900 to 1399
Pine St
Length: 0.36 miles
Direction: E-W
Address range: 1000 to 1399
Direction: E-W
Address range: 1000 to 1399
Elm St
Length: 0.36 miles
Direction: E-W
Address range: 1000 to 1399
Direction: E-W
Address range: 1000 to 1399
Randolph St
Length: 0.33 miles
Direction: N-S
Address range: 200 to 499
Direction: N-S
Address range: 200 to 499
Coombs St
Length: 0.33 miles
Direction: N-S
Address range: 200 to 499
Direction: N-S
Address range: 200 to 499
Franklin St
Length: 0.22 miles
Direction: N-S
Address range: 200 to 499
Direction: N-S
Address range: 200 to 499
Cross St
Length: 0.22 miles
Directions: N-S, SW-NE
Address range: 300 to 499
Directions: N-S, SW-NE
Address range: 300 to 499