Alma neighborhood in San Jose, California (CA), 95110, 95125 detailed profile
Settings
X

Business Search - 14 Million verified businesses
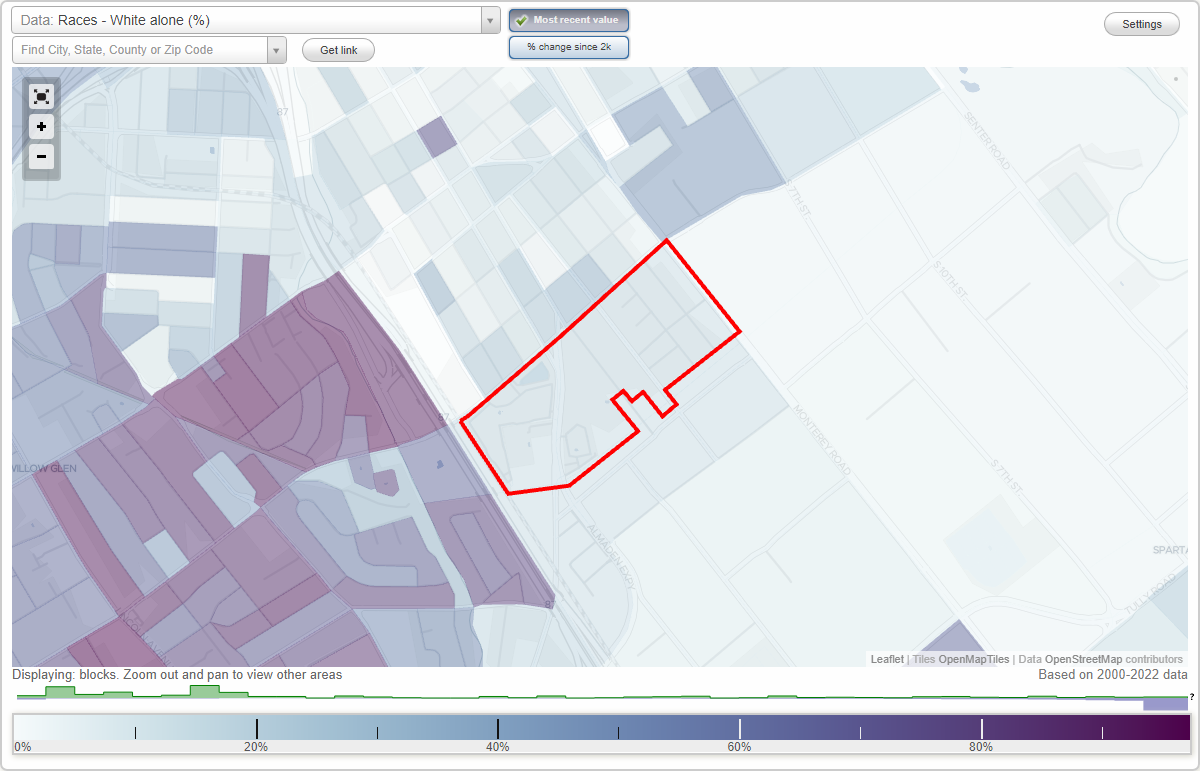
Area: 0.174 square miles
Population: 660
Population density:
| Alma: | 3,790 people per square mile |
| San Jose: | 5,554 people per square mile |

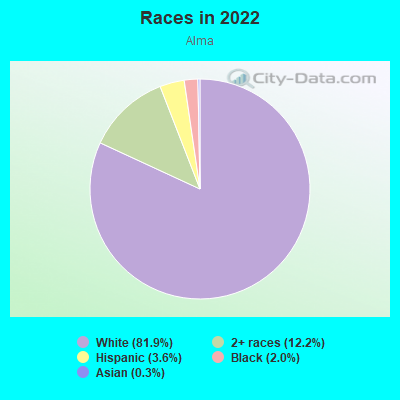
- 62981.9%White
- 9412.2%Two or more races
- 283.6%Hispanic or Latino
- 152.0%Black
- 20.3%Asian
Median household income in 2022:
| Alma: | $204,667 |
| San Jose: | $133,835 |
Distribution of median household income
![Distribution of median household income]()
- 37Less than $10,000
- 20$10,000 to $19,999
- 3$20,000 to $29,999
- 29$30,000 to $39,999
- 22$40,000 to $49,999
- 22$50,000 to $59,999
- 14$60,000 to $74,999
- 25$75,000 to $99,999
- 37$100,000 to $124,999
- 12$125,000 to $149,999
- 33$150,000 to $199,999
- 129$200,000 or more

Distribution of owner-occupied house/condo value
![Distribution of owner-occupied house/condo value]()
- 7Less than $50,000
- 3$50,000 to $99,999
- 9$150,000 to $199,999
- 2$400,000 to $499,999
- 5$500,000 to $749,999
- 11$750,000 to $999,999
- 172$1,000,000 or more

Distribution of rent paid by renters
![Distribution of rent paid by renters]()
- 3$300 to $399
- 7$900 to $999
- 19$1,000 to $1,249
- 3$1,250 to $1,499
- 19$1,500 to $1,999
- 106$2,000 or more

Median rent in 2022:
| Alma: | $3,501 |
| San Jose: | $2,001 |
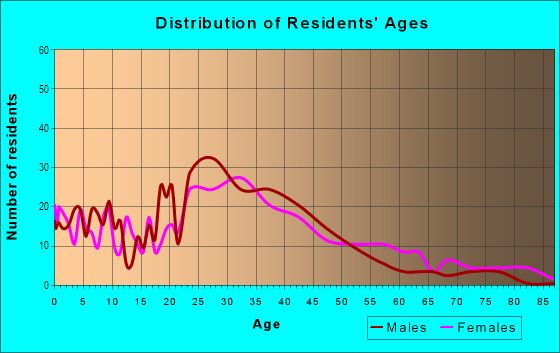
| Males: | 255 |
| Females: | 404 |
Males:
| This neighborhood: | 53.9 years |
| Whole city: | 37.6 years |
| This neighborhood: | 50.0 years |
| Whole city: | 39.1 years |
Average household size:
| Alma: | 2.8 people |
| San Jose: | 2.9 people |
Percentage of family households:
| Alma: | 55.8% |
| San Jose: | 49.9% |
| Here: | 51.2% |
| San Jose: | 53.0% |
Percentage of married-couple families with children (among all households):
| Alma: | 36.0% |
| San Jose: | 25.8% |
Percentage of single-mother households (among all households):
| Alma: | 21.2% |
| San Jose: | 5.2% |
Percentage of never married males 15 years old and over:
Percentage of never married females 15 years old and over:
| Alma: | 16.7% |
| San Jose: | 20.9% |
Percentage of never married females 15 years old and over:
| Alma: | 29.6% |
| city: | 16.7% |
Percentage of people born in this state:
Percentage of people born in another U.S. state:
Percentage of native residents but born outside the U.S.:
Percentage of foreign born residents:
| Here: | 57.3% |
| San Jose: | 46.1% |
Percentage of people born in another U.S. state:
| Alma: | 19.1% |
| San Jose: | 10.4% |
Percentage of native residents but born outside the U.S.:
| Here: | 1.7% |
| city: | 1.7% |
Percentage of foreign born residents:
| Here: | 21.9% |
| San Jose: | 41.8% |
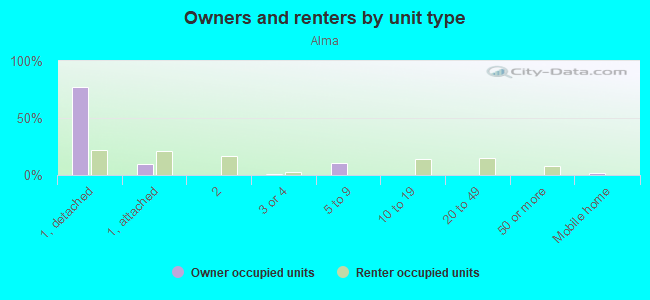
Owner-occupied
Renter-occupied

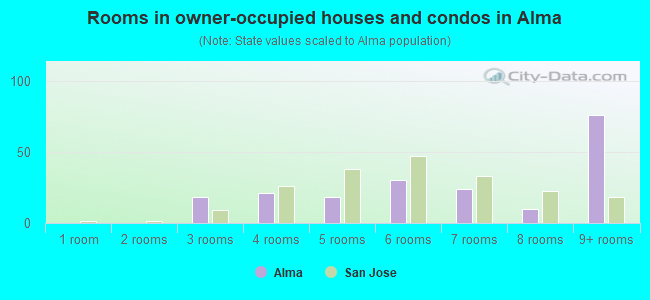
- Rooms in owner-occupied houses and condos in Alma
- 01 room
- 02 rooms
- 183 rooms
- 214 rooms
- 185 rooms
- 306 rooms
- 247 rooms
- 108 rooms
- 769+ rooms
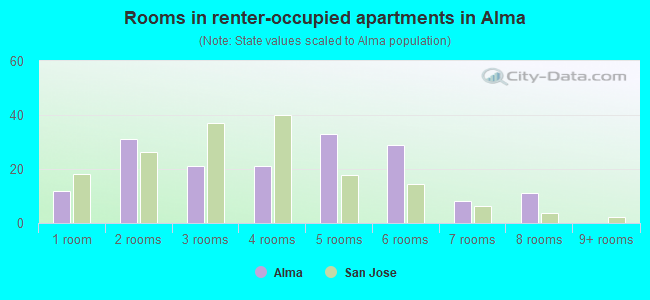
- Rooms in renter-occupied apartments in Alma
- 121 room
- 312 rooms
- 213 rooms
- 214 rooms
- 335 rooms
- 296 rooms
- 87 rooms
- 118 rooms
- 09+ rooms
Owner-occupied
Renter-occupied
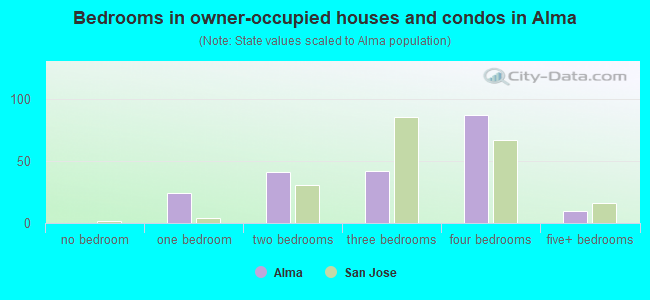
- Bedrooms in owner-occupied houses and condos in Alma
- 0no bedroom
- 241 bedroom
- 412 bedrooms
- 423 bedrooms
- 874 bedrooms
- 105+ bedrooms
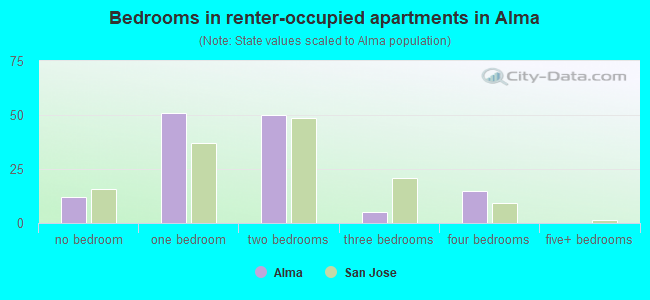
- Bedrooms in renter-occupied apartments in Alma
- 12no bedroom
- 511 bedroom
- 502 bedrooms
- 53 bedrooms
- 154 bedrooms
- 05+ bedrooms
Average number of cars or other vehicles available in houses/condos:
Average number of cars or other vehicles available in apartments:
| This neighborhood: | 2.2 |
| San Jose: | 2.3 |
Average number of cars or other vehicles available in apartments:
| Here: | 2.0 |
| city: | 1.6 |
Percentage of units with a mortgage:
| Alma: | 82.4% |
| San Jose: | 66.9% |
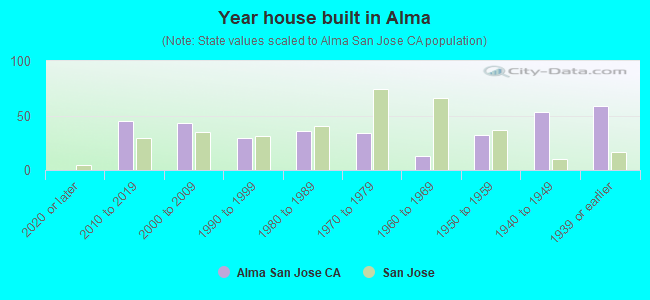
- Year house built in Alma
- 02020 or later
- 452010 to 2019
- 432000 to 2009
- 291990 to 1999
- 361980 to 1989
- 341970 to 1979
- 131960 to 1969
- 321950 to 1959
- 531940 to 1949
- 591939 or earlier
City-data.com crime index for city in 2020 (higher means more crime):
| City: | 268.4 |
| U.S. average: | 219.5 |
Travel time to work (commute)
![Travel time to work (commute)]()
- 8Less than 5 minutes
- 545 to 9 minutes
- 7010 to 14 minutes
- 15915 to 19 minutes
- 4220 to 24 minutes
- 1825 to 29 minutes
- 7730 to 34 minutes
- 1535 to 39 minutes
- 1740 to 44 minutes
- 6245 to 59 minutes
- 960 to 89 minutes
- 590 or more minutes

Means of transportation to work
![Means of transportation to work]()
- 65.9%335Drove a car alone
- 4.1%21Carpooled
- 0.8%4Bus
- 1.0%5Long-distance train or commuter rail
- 0.4%2Light rail, streetcar or trolley
- 2.9%15Bicycle
- 2.6%13Walked
- 4.1%21Other means
- 22.2%113Worked at home

Time leaving home to go to work
![Time leaving home to go to work]()
- 235:00 a.m. to 5:29 a.m.
- 145:30 a.m. to 5:59 a.m.
- 476:00 a.m. to 6:29 a.m.
- 316:30 a.m. to 6:59 a.m.
- 677:00 a.m. to 7:29 a.m.
- 497:30 a.m. to 7:59 a.m.
- 748:00 a.m. to 8:29 a.m.
- 458:30 a.m. to 8:59 a.m.
- 969:00 a.m. to 9:59 a.m.
- 2610:00 a.m. to 10:59 a.m.
- 2011:00 a.m. to 11:59 a.m.
- 1312:00 p.m. to 3:59 p.m.
- 594:00 p.m. to 11:59 p.m.

Occupations of males:
- Percentage of males in management occupations (except farmers):
Here: 21.6% city: 13.0%
- Percentage of males in business and financial operations occupations:
Here: 4.4% city: 4.6%
- Percentage of males in computer and mathematical occupations:
Here: 17.9% city: 13.6%
- Percentage of males in architecture and engineering occupations:
Here: 10.5% city: 10.2%
- Percentage of males in life, physical, and social science occupations:
Here: 6.1% city: 1.1%
- Percentage of males in community and social services occupations:
Here: 1.7% city: 0.8%
- Percentage of males in legal occupations:
Here: 11.6% city: 0.8%
- Percentage of males in education, training, and library occupations:
Here: 4.1% city: 2.8%
- Percentage of males in arts, design, entertainment, sports, and media occupations:
Here: 13.3% city: 1.8%
- Percentage of males in healthcare practitioners and technical occupations:
Here: 2.1% city: 2.0%
- Percentage of males in service occupations:
Here: 18.7% city: 12.7%
- Percentage of males in sales and office occupations:
Here: 56.5% city: 12.8%
- Percentage of males in construction, extraction, and maintenance occupations:
Here: 2.5% city: 7.8%
- Percentage of males in production occupations:
Here: 5.1% city: 5.5%
- Percentage of males in transportation occupations:
Here: 5.4% city: 3.6%
- Percentage of males in material moving occupations:
Here: 1.9% city: 3.1%
Occupations of females:
- Percentage of females in management occupations (except farmers):
Here: 8.0% city: 11.0%
- Percentage of females in business and financial operations occupations:
Here: 12.5% city: 8.6%
- Percentage of females in computer and mathematical occupations:
Here: 8.1% city: 5.4%
- Percentage of females in life, physical, and social science occupations:
Here: 17.6% city: 1.7%
- Percentage of females in community and social services occupations:
Here: 3.6% city: 1.8%
- Percentage of females in legal occupations:
Here: 4.0% city: 1.3%
- Percentage of females in education, training, and library occupations:
Here: 8.0% city: 8.1%
- Percentage of females in arts, design, entertainment, sports, and media occupations:
Here: 4.0% city: 2.0%
- Percentage of females in healthcare practitioners and technical occupations:
Here: 4.9% city: 6.8%
- Percentage of females in service occupations:
Here: 8.3% city: 21.7%
- Percentage of females in sales and office occupations:
Here: 45.9% city: 22.0%
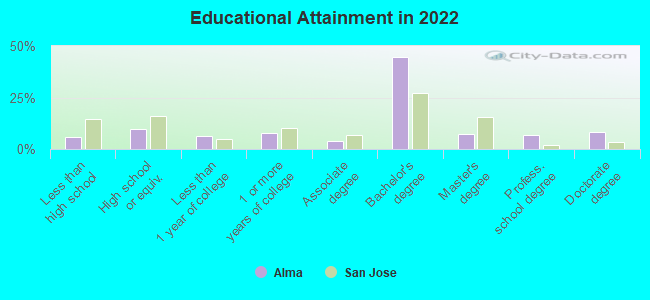
Education in this neighborhood (subdivision or community):
- Percentage of people 3 years and older in K-12 schools:
Alma: 38.6% San Jose: 16.1%
- Percentage of people 3 years and older in undergraduate colleges:
Alma: 3.7% San Jose: 6.5%
- Percentage of people 3 years and older in grad. or professional schools:
Alma: 6.2% San Jose: 2.0%
- Percentage of students K-12 enrolled in private schools:
Alma: 74.5% San Jose: 14.9%
Percentage of population below poverty level:
| Alma: | 5.4% |
| San Jose: | 9.0% |
Median year owner moved in (as recorded in 2022):
Median year renter moved in (as recorded in 2022):
| Alma: | 2013 |
| San Jose: | 2008 |
Median year renter moved in (as recorded in 2022):
| Alma: | 2017 |
| San Jose: | 2020 |
Percentage of married-couple families with both working:
| Alma: | 204.7% |
| San Jose: | 72.5% |
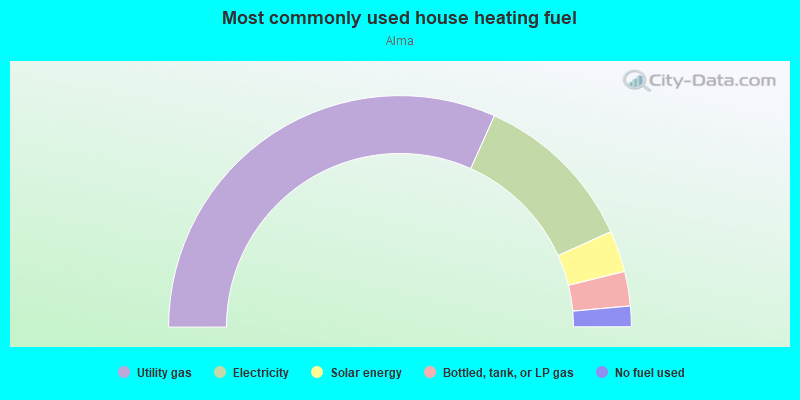
- 63.4%Utility gas
- 23.1%Electricity
- 5.8%Solar energy
- 4.8%Bottled, tank, or LP gas
- 2.9%No fuel used
Limited-access highways (interstate or state) in this neighborhood:
Almaden Expy (Co Hwy G8)
Length: 0.10 miles
Directions: N-S, SE-NW
Address range: 1494 to 1499
Directions: N-S, SE-NW
Address range: 1494 to 1499
Highways in this neighborhood:
Monterey Hwy (State Hwy 82)
Length: 0.12 miles
Direction: SE-NW
Address range: 1500 to 1599
Direction: SE-NW
Address range: 1500 to 1599
Roads and streets:
la Rossa Cir
Length: 0.37 miles
Directions: E-W, N-S, SE-NW, SW-NE
Address range: 1500 to 1699
Directions: E-W, N-S, SE-NW, SW-NE
Address range: 1500 to 1699
Shadow Run Dr
Length: 0.34 miles
Directions: E-W, N-S, SE-NW, SW-NE
Address range: 200 to 398
Directions: E-W, N-S, SE-NW, SW-NE
Address range: 200 to 398
W Shadowgraph Dr
Length: 0.30 miles
Directions: E-W, N-S, SE-NW, SW-NE
Address range: 400 to 615
Directions: E-W, N-S, SE-NW, SW-NE
Address range: 400 to 615
Shadow Dance Dr
Length: 0.27 miles
Directions: E-W, N-S, SE-NW, SW-NE
Address range: 200 to 699
Directions: E-W, N-S, SE-NW, SW-NE
Address range: 200 to 699
Bellevue Ave
Length: 0.26 miles
Direction: SW-NE
Address range: 1 to 199
Direction: SW-NE
Address range: 1 to 199
Cottage Grove Ave
Length: 0.26 miles
Direction: SW-NE
Address range: 1 to 199
Direction: SW-NE
Address range: 1 to 199
Sanborn Ave
Length: 0.24 miles
Direction: SE-NW
Address range: 1432 to 1599
Direction: SE-NW
Address range: 1432 to 1599
Stonegate Cir
Length: 0.22 miles
Directions: E-W, N-S, SE-NW, SW-NE
Address range: 200 to 315
Directions: E-W, N-S, SE-NW, SW-NE
Address range: 200 to 315
Pomona Ave
Length: 0.14 miles
Direction: SE-NW
Address range: 1500 to 1618
Direction: SE-NW
Address range: 1500 to 1618
Ford Ave
Length: 0.12 miles
Direction: SE-NW
Address range: 1500 to 1599
Direction: SE-NW
Address range: 1500 to 1599
Darby Ct
Length: 0.11 miles
Direction: SW-NE
Address range: 100 to 199
Direction: SW-NE
Address range: 100 to 199
Almaden Rd
Length: 0.08 miles
Directions: N-S, SW-NE
Address range: 1438 to 1599
Directions: N-S, SW-NE
Address range: 1438 to 1599
Austin Ct
Length: 0.06 miles
Direction: SW-NE
Address range: 100 to 199
Direction: SW-NE
Address range: 100 to 199
Roberts Ct
Length: 0.06 miles
Direction: SW-NE
Address range: 1 to 199
Direction: SW-NE
Address range: 1 to 199
la Rossa Ct
Length: 0.04 miles
Direction: E-W
Address range: 200 to 299
Direction: E-W
Address range: 200 to 299
Railroad features:
Union Pacific RR
Length: 0.08 miles
Directions: E-W, SW-NE
Directions: E-W, SW-NE