Alta Mira neighborhood in Tempe, Arizona (AZ), 85284 detailed profile
Settings
X


Business Search - 14 Million verified businesses
Area: 0.259 square miles
Population: 635
Population density:
| Alta Mira: | 2,449 people per square mile |
| Tempe: | 4,641 people per square mile |

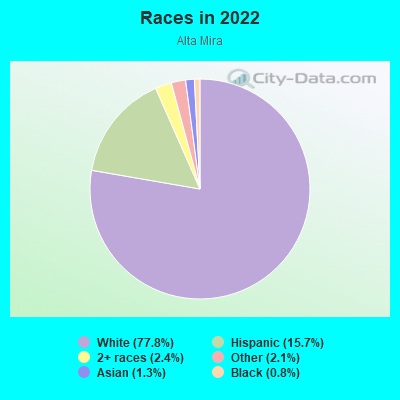
- 49277.8%White
- 9915.7%Hispanic or Latino
- 152.4%Two or more races
- 132.1%Some other race
- 81.3%Asian
- 50.8%Black
Median household income in 2022:
| Alta Mira: | $140,896 |
| Tempe: | $76,007 |
Distribution of median household income
![Distribution of median household income]()
- 10Less than $10,000
- 2$10,000 to $19,999
- 4$20,000 to $29,999
- 13$30,000 to $39,999
- 7$40,000 to $49,999
- 11$50,000 to $59,999
- 6$60,000 to $74,999
- 33$75,000 to $99,999
- 34$100,000 to $124,999
- 41$125,000 to $149,999
- 43$150,000 to $199,999
- 70$200,000 or more

Distribution of owner-occupied house/condo value
![Distribution of owner-occupied house/condo value]()
- 3Less than $50,000
- 2$50,000 to $99,999
- 6$200,000 to $249,999
- 12$250,000 to $299,999
- 29$300,000 to $399,999
- 69$400,000 to $499,999
- 120$500,000 to $749,999
- 14$750,000 to $999,999

Distribution of rent paid by renters
![Distribution of rent paid by renters]()
- 3$900 to $999
- 2$1,000 to $1,249
- 2$1,250 to $1,499
- 9$1,500 to $1,999
- 5$2,000 or more

Median rent in 2022:
| Alta Mira: | $1,742 |
| Tempe: | $1,566 |
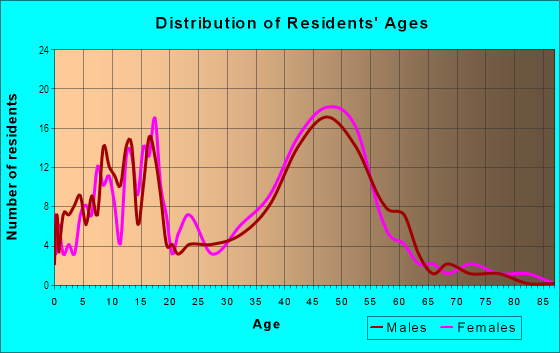
| Males: | 305 |
| Females: | 329 |
Males:
| This neighborhood: | 53.4 years |
| Whole city: | 28.9 years |
| This neighborhood: | 48.7 years |
| Whole city: | 30.5 years |
Average household size:
| Alta Mira: | 2.3 people |
| Tempe: | 2.3 people |
Percentage of family households:
| Alta Mira: | 46.0% |
| Tempe: | 36.3% |
| Here: | 61.0% |
| Tempe: | 32.6% |
Percentage of married-couple families with children (among all households):
| Alta Mira: | 34.6% |
| Tempe: | 26.9% |
Percentage of single-mother households (among all households):
| Alta Mira: | 6.2% |
| Tempe: | 8.3% |
Percentage of never married males 15 years old and over:
Percentage of never married females 15 years old and over:
| Alta Mira: | 13.8% |
| Tempe: | 32.9% |
Percentage of never married females 15 years old and over:
| Alta Mira: | 12.3% |
| city: | 21.7% |
Percentage of people born in this state:
Percentage of people born in another U.S. state:
Percentage of native residents but born outside the U.S.:
Percentage of foreign born residents:
| Here: | 33.0% |
| Tempe: | 39.3% |
Percentage of people born in another U.S. state:
| Alta Mira: | 57.0% |
| Tempe: | 46.0% |
Percentage of native residents but born outside the U.S.:
| Here: | 3.8% |
| city: | 1.8% |
Percentage of foreign born residents:
| Here: | 6.2% |
| Tempe: | 12.9% |
Owner-occupied
Renter-occupied

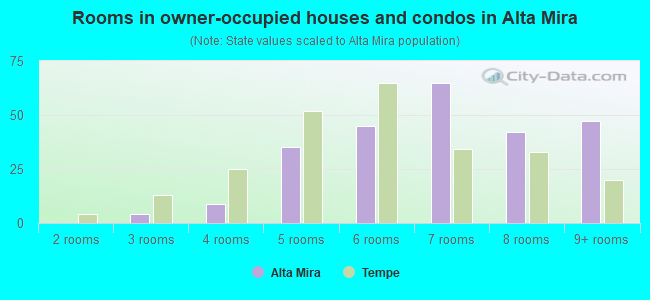
- Rooms in owner-occupied houses and condos in Alta Mira
- 01 room
- 02 rooms
- 43 rooms
- 94 rooms
- 355 rooms
- 456 rooms
- 657 rooms
- 428 rooms
- 479+ rooms
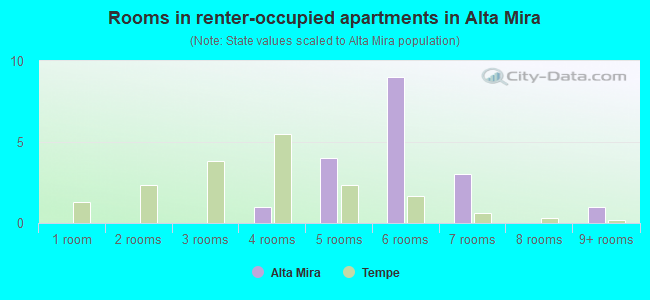
- Rooms in renter-occupied apartments in Alta Mira
- 01 room
- 02 rooms
- 03 rooms
- 14 rooms
- 45 rooms
- 96 rooms
- 37 rooms
- 08 rooms
- 19+ rooms
Owner-occupied
Renter-occupied
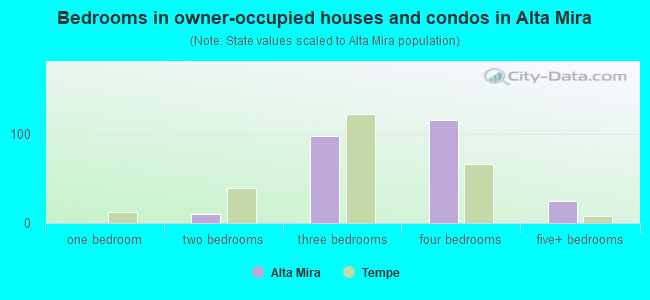
- Bedrooms in owner-occupied houses and condos in Alta Mira
- 0no bedroom
- 01 bedroom
- 102 bedrooms
- 983 bedrooms
- 1164 bedrooms
- 255+ bedrooms
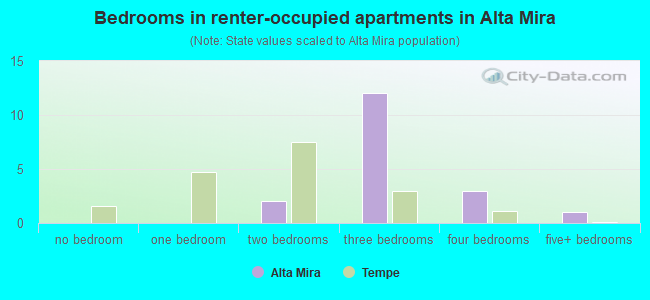
- Bedrooms in renter-occupied apartments in Alta Mira
- 0no bedroom
- 01 bedroom
- 22 bedrooms
- 123 bedrooms
- 34 bedrooms
- 15+ bedrooms
Average number of cars or other vehicles available in houses/condos:
Average number of cars or other vehicles available in apartments:
| This neighborhood: | 2.2 |
| Tempe: | 2.0 |
Average number of cars or other vehicles available in apartments:
| Here: | 1.7 |
| city: | 1.6 |
Percentage of units with a mortgage:
| Alta Mira: | 63.9% |
| Tempe: | 69.2% |
Housing prices:
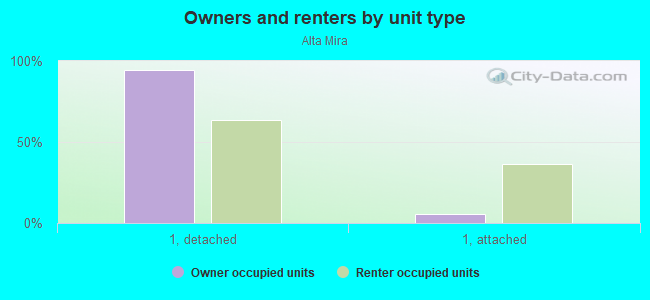
- Average estimated value of detached houses in 2022 (89.5% of all units):
Alta Mira: $511,654 Tempe: $535,475
- Average estimated value of townhouses or other attached units in 2022 (8.7% of all units):
This neighborhood: $283,151 city: $325,212
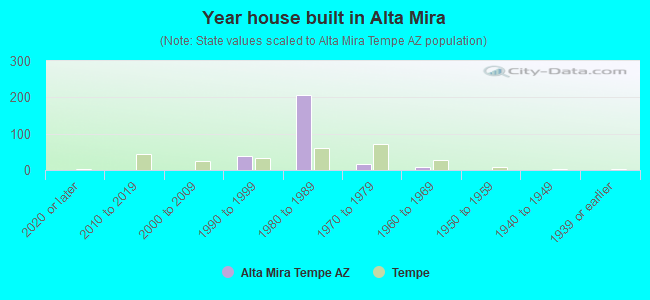
- Year house built in Alta Mira
- 02020 or later
- 02010 to 2019
- 12000 to 2009
- 391990 to 1999
- 2071980 to 1989
- 171970 to 1979
- 91960 to 1969
- 11950 to 1959
- 01940 to 1949
- 11939 or earlier
City-data.com crime index for city in 2020 (higher means more crime):
| City: | 347.1 |
| U.S. average: | 219.5 |
Travel time to work (commute)
![Travel time to work (commute)]()
- 3Less than 5 minutes
- 195 to 9 minutes
- 3510 to 14 minutes
- 6815 to 19 minutes
- 9320 to 24 minutes
- 2425 to 29 minutes
- 4830 to 34 minutes
- 835 to 39 minutes
- 1140 to 44 minutes
- 2445 to 59 minutes
- 760 to 89 minutes
- 190 or more minutes

Means of transportation to work
![Means of transportation to work]()
- 69.9%273Drove a car alone
- 4.6%18Carpooled
- 0.3%1Subway or elevated rail
- 0.8%3Other means
- 23.8%93Worked at home

Time leaving home to go to work
![Time leaving home to go to work]()
- 112:00 a.m. to 4:59 a.m.
- 165:00 a.m. to 5:29 a.m.
- 225:30 a.m. to 5:59 a.m.
- 276:00 a.m. to 6:29 a.m.
- 266:30 a.m. to 6:59 a.m.
- 487:00 a.m. to 7:29 a.m.
- 527:30 a.m. to 7:59 a.m.
- 488:00 a.m. to 8:29 a.m.
- 68:30 a.m. to 8:59 a.m.
- 359:00 a.m. to 9:59 a.m.
- 1510:00 a.m. to 10:59 a.m.
- 1911:00 a.m. to 11:59 a.m.
- 1612:00 p.m. to 3:59 p.m.
- 154:00 p.m. to 11:59 p.m.

Occupations of males:
- Percentage of males in management occupations (except farmers):
Here: 14.0% city: 10.2%
- Percentage of males in business and financial operations occupations:
Here: 10.8% city: 6.5%
- Percentage of males in computer and mathematical occupations:
Here: 15.6% city: 8.4%
- Percentage of males in architecture and engineering occupations:
Here: 5.5% city: 5.0%
- Percentage of males in community and social services occupations:
Here: 1.5% city: 1.1%
- Percentage of males in legal occupations:
Here: 1.5% city: 1.1%
- Percentage of males in education, training, and library occupations:
Here: 7.3% city: 6.1%
- Percentage of males in arts, design, entertainment, sports, and media occupations:
Here: 1.5% city: 2.8%
- Percentage of males in healthcare practitioners and technical occupations:
Here: 2.9% city: 2.8%
- Percentage of males in service occupations:
Here: 11.2% city: 14.4%
- Percentage of males in sales and office occupations:
Here: 16.7% city: 19.0%
- Percentage of males in construction, extraction, and maintenance occupations:
Here: 4.2% city: 5.1%
- Percentage of males in transportation occupations:
Here: 1.0% city: 3.9%
- Percentage of males in material moving occupations:
Here: 1.8% city: 3.5%
Occupations of females:
- Percentage of females in management occupations (except farmers):
Here: 16.8% city: 7.5%
- Percentage of females in business and financial operations occupations:
Here: 8.1% city: 9.3%
- Percentage of females in computer and mathematical occupations:
Here: 1.8% city: 3.3%
- Percentage of females in architecture and engineering occupations:
Here: 1.7% city: 0.9%
- Percentage of females in community and social services occupations:
Here: 1.2% city: 3.4%
- Percentage of females in legal occupations:
Here: 3.8% city: 1.4%
- Percentage of females in education, training, and library occupations:
Here: 14.8% city: 12.0%
- Percentage of females in arts, design, entertainment, sports, and media occupations:
Here: 3.5% city: 3.1%
- Percentage of females in healthcare practitioners and technical occupations:
Here: 10.2% city: 7.4%
- Percentage of females in service occupations:
Here: 7.9% city: 18.9%
- Percentage of females in sales and office occupations:
Here: 22.8% city: 26.9%
- Percentage of females in farming, fishing, and forestry occupations:
Here: 3.5% city: 0.2%
- Percentage of females in transportation occupations:
Here: 3.1% city: 0.9%
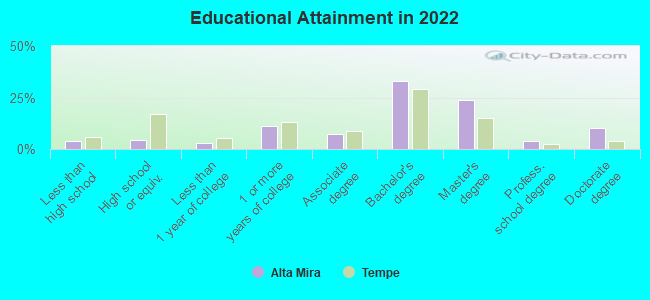
Education in this neighborhood (subdivision or community):
- Percentage of people 3 years and older in K-12 schools:
Alta Mira: 13.8% Tempe: 12.5%
- Percentage of people 3 years and older in undergraduate colleges:
Alta Mira: 4.1% Tempe: 15.4%
- Percentage of people 3 years and older in grad. or professional schools:
Alta Mira: 1.3% Tempe: 6.3%
- Percentage of students K-12 enrolled in private schools:
Alta Mira: 3.4% Tempe: 9.2%
Percentage of population below poverty level:
| Alta Mira: | 2.7% |
| Tempe: | 15.0% |
Median year owner moved in (as recorded in 2022):
Median year renter moved in (as recorded in 2022):
| Alta Mira: | 2007 |
| Tempe: | 2013 |
Median year renter moved in (as recorded in 2022):
| Alta Mira: | 2018 |
| Tempe: | 2022 |
Percentage of married-couple families with both working:
| Alta Mira: | 89.8% |
| Tempe: | 77.6% |
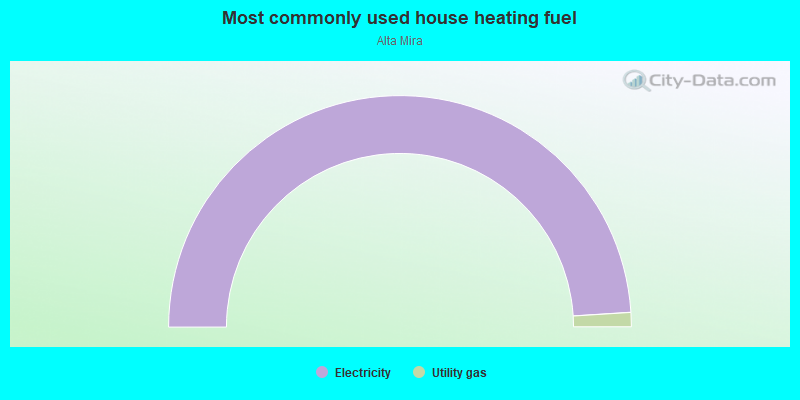
- 98.0%Electricity
- 2.0%Utility gas
Roads and streets:
E Caroline Ln
Length: 0.53 miles
Directions: E-W, SE-NW, SW-NE
Address range: 1810 to 1953
Directions: E-W, SE-NW, SW-NE
Address range: 1810 to 1953
E la Vieve Ln
Length: 0.53 miles
Directions: E-W, SE-NW, SW-NE
Address range: 1810 to 1999
Directions: E-W, SE-NW, SW-NE
Address range: 1810 to 1999
E Ranch Rd
Length: 0.46 miles
Directions: E-W, SE-NW
Address range: 1800 to 1999
Directions: E-W, SE-NW
Address range: 1800 to 1999
E Jeanine Dr
Length: 0.44 miles
Directions: E-W, SW-NE
Address range: 1800 to 9349
Directions: E-W, SW-NE
Address range: 1800 to 9349
E Cll de Arcos
Length: 0.38 miles
Directions: E-W, N-S, SE-NW, SW-NE
Address range: 1800 to 1999
Directions: E-W, N-S, SE-NW, SW-NE
Address range: 1800 to 1999
E Greentree Dr
Length: 0.36 miles
Directions: E-W, SW-NE
Address range: 1800 to 1999
Directions: E-W, SW-NE
Address range: 1800 to 1999
S Heather Dr
Length: 0.34 miles
Directions: E-W, N-S, SE-NW
Address range: 8800 to 9299
Directions: E-W, N-S, SE-NW
Address range: 8800 to 9299
S Kenwood Ln
Length: 0.33 miles
Directions: N-S, SW-NE
Address range: 8806 to 9199
Directions: N-S, SW-NE
Address range: 8806 to 9199
S Kachina Dr
Length: 0.31 miles
Directions: N-S, SE-NW, SW-NE
Address range: 1900 to 9299
Directions: N-S, SE-NW, SW-NE
Address range: 1900 to 9299
E Myrna Ln
Length: 0.27 miles
Directions: E-W, SE-NW
Address range: 1900 to 1999
Directions: E-W, SE-NW
Address range: 1900 to 1999
S Hazelton Ln
Length: 0.26 miles
Directions: N-S, SW-NE
Address range: 9200 to 9399
Directions: N-S, SW-NE
Address range: 9200 to 9399
S Los Feliz Dr
Length: 0.23 miles
Direction: N-S
Address range: 8808 to 9099
Direction: N-S
Address range: 8808 to 9099
S Taylor Dr
Length: 0.22 miles
Directions: N-S, SW-NE
Address range: 8804 to 9312
Directions: N-S, SW-NE
Address range: 8804 to 9312
E Dawn Dr
Length: 0.20 miles
Directions: E-W, N-S, SW-NE
Address range: 1900 to 1999
Directions: E-W, N-S, SW-NE
Address range: 1900 to 1999
E Sarah Ln
Length: 0.11 miles
Directions: E-W, N-S, SE-NW, SW-NE
Address range: 1800 to 1909
Directions: E-W, N-S, SE-NW, SW-NE
Address range: 1800 to 1909
E Rhea Rd
Length: 0.10 miles
Directions: E-W, SE-NW, SW-NE
Address range: 1800 to 1999
Directions: E-W, SE-NW, SW-NE
Address range: 1800 to 1999
S Jeanine Dr
Length: 0.05 miles
Direction: N-S
Direction: N-S
S la Vieve Ln
Length: 0.02 miles
Direction: SE-NW
Address range: 1850 to 1869
Direction: SE-NW
Address range: 1850 to 1869