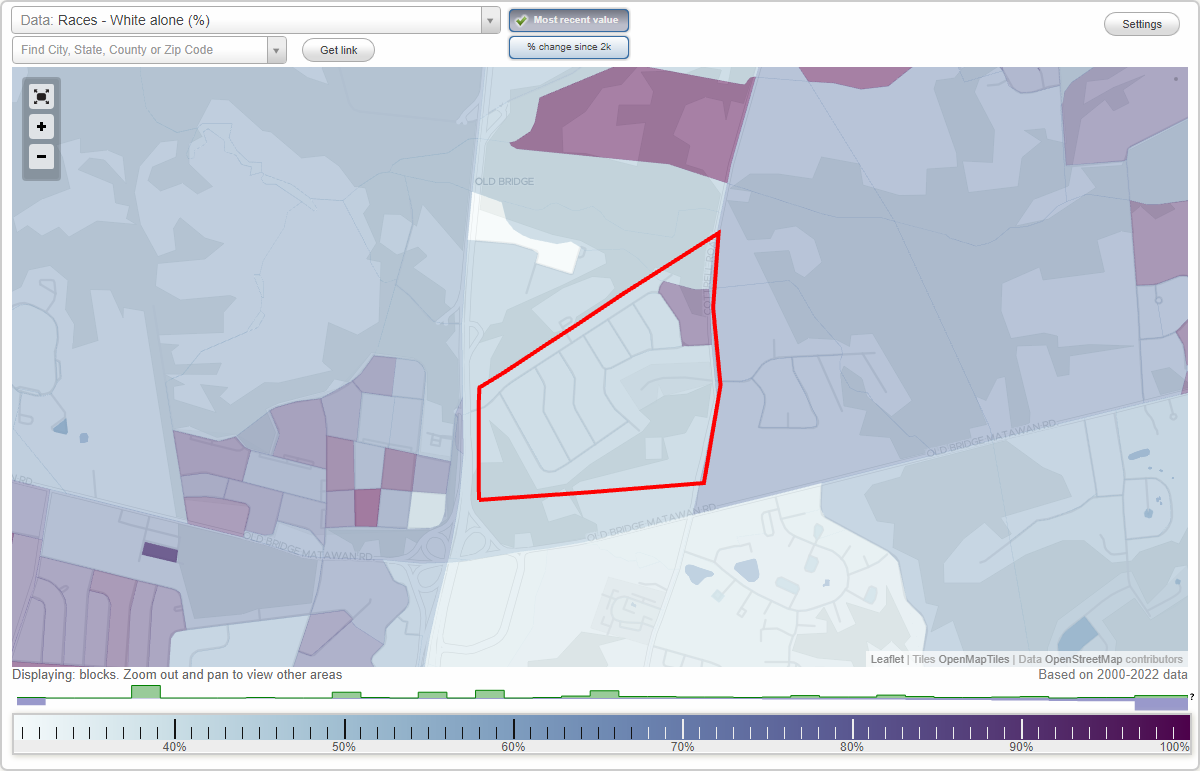
Arbors neighborhood in Old Bridge, New Jersey (NJ), 08857 detailed profile
Settings
X

Business Search - 14 Million verified businesses
Area: 0.216 square miles
Population: 643
Population density:
| Arbors: | 2,975 people per square mile |
| Old Bridge: | 3,985 people per square mile |

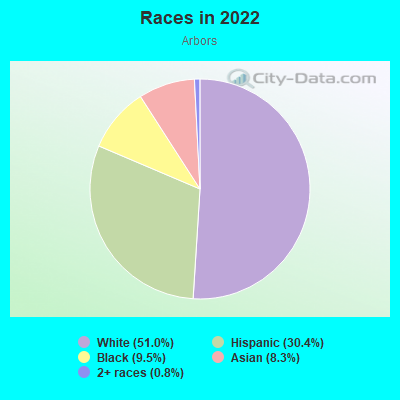
- 32751.0%White
- 19530.4%Hispanic or Latino
- 619.5%Black
- 538.3%Asian
- 50.8%Two or more races
Median household income in 2022:
| Arbors: | $104,533 |
| Old Bridge: | $104,712 |
Distribution of median household income
![Distribution of median household income]()
- 4Less than $10,000
- 12$10,000 to $19,999
- 37$20,000 to $29,999
- 11$30,000 to $39,999
- 18$40,000 to $49,999
- 18$50,000 to $59,999
- 33$60,000 to $74,999
- 32$75,000 to $99,999
- 39$100,000 to $124,999
- 9$125,000 to $149,999
- 23$150,000 to $199,999
- 38$200,000 or more

Distribution of owner-occupied house/condo value
![Distribution of owner-occupied house/condo value]()
- 2$200,000 to $249,999
- 7$250,000 to $299,999
- 24$300,000 to $399,999
- 27$400,000 to $499,999
- 40$500,000 to $749,999
- 4$750,000 to $999,999
- 2$1,000,000 or more

Distribution of rent paid by renters
![Distribution of rent paid by renters]()
- 6Less than $100
- 39$1,000 to $1,249
- 36$1,250 to $1,499
- 103$1,500 to $1,999
- 8$2,000 or more

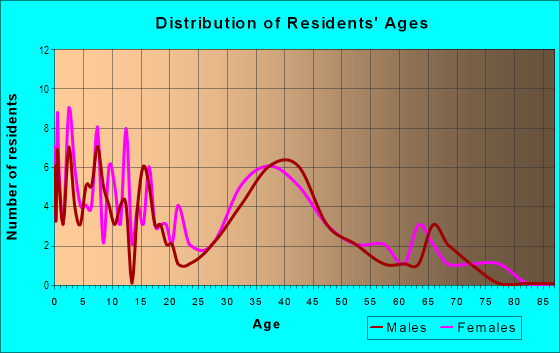
| Males: | 300 |
| Females: | 343 |
Males:
| This neighborhood: | 37.6 years |
| Whole city: | 41.8 years |
| This neighborhood: | 45.3 years |
| Whole city: | 44.0 years |
Average household size:
| Arbors: | 2.5 people |
| Old Bridge: | 2.7 people |
Percentage of family households:
| Arbors: | 55.4% |
| Old Bridge: | 48.8% |
| Here: | 37.4% |
| Old Bridge: | 59.8% |
Percentage of married-couple families with children (among all households):
| Arbors: | 18.7% |
| Old Bridge: | 32.1% |
Percentage of single-mother households (among all households):
| Arbors: | 16.4% |
| Old Bridge: | 3.8% |
Percentage of never married males 15 years old and over:
Percentage of never married females 15 years old and over:
| Arbors: | 20.1% |
| Old Bridge: | 15.6% |
Percentage of never married females 15 years old and over:
| Arbors: | 23.1% |
| place: | 14.5% |
Percentage of people that speak English not well or not at all:
| Arbors: | 6.3% |
| Old Bridge: | 4.2% |
Percentage of people born in this state:
Percentage of people born in another U.S. state:
Percentage of native residents but born outside the U.S.:
Percentage of foreign born residents:
| Here: | 48.0% |
| Old Bridge: | 42.9% |
Percentage of people born in another U.S. state:
| Arbors: | 27.3% |
| Old Bridge: | 32.8% |
Percentage of native residents but born outside the U.S.:
| Here: | 1.3% |
| place: | 1.6% |
Percentage of foreign born residents:
| Here: | 23.4% |
| Old Bridge: | 22.7% |
Owner-occupied
Renter-occupied

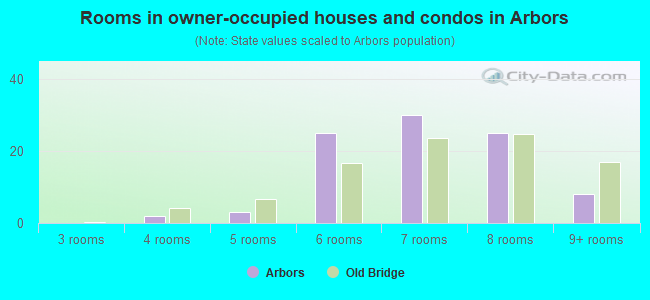
- Rooms in owner-occupied houses and condos in Arbors
- 01 room
- 02 rooms
- 03 rooms
- 24 rooms
- 35 rooms
- 256 rooms
- 307 rooms
- 258 rooms
- 89+ rooms
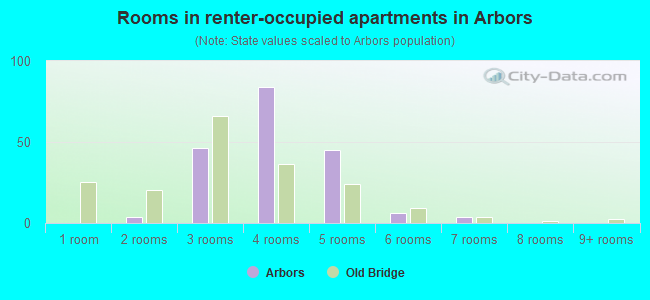
- Rooms in renter-occupied apartments in Arbors
- 01 room
- 42 rooms
- 463 rooms
- 844 rooms
- 455 rooms
- 66 rooms
- 47 rooms
- 08 rooms
- 09+ rooms
Owner-occupied
Renter-occupied
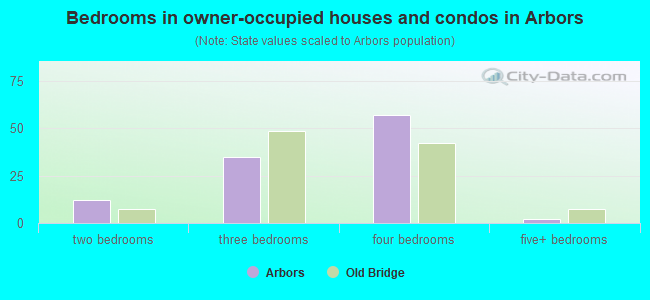
- Bedrooms in owner-occupied houses and condos in Arbors
- 0no bedroom
- 01 bedroom
- 122 bedrooms
- 353 bedrooms
- 574 bedrooms
- 25+ bedrooms
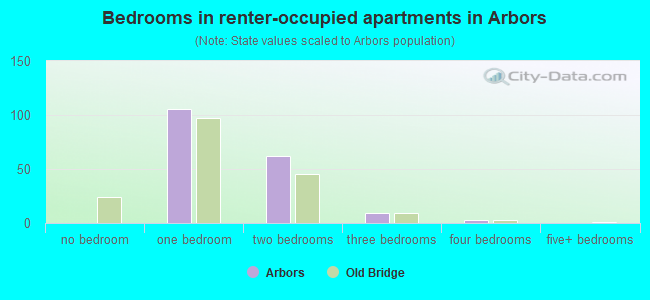
- Bedrooms in renter-occupied apartments in Arbors
- 0no bedroom
- 1061 bedroom
- 622 bedrooms
- 93 bedrooms
- 34 bedrooms
- 05+ bedrooms
Average number of cars or other vehicles available in houses/condos:
Average number of cars or other vehicles available in apartments:
| This neighborhood: | 2.2 |
| Old Bridge: | 2.3 |
Average number of cars or other vehicles available in apartments:
| Here: | 1.6 |
| place: | 1.1 |
Percentage of units with a mortgage:
| Arbors: | 66.9% |
| Old Bridge: | 66.5% |
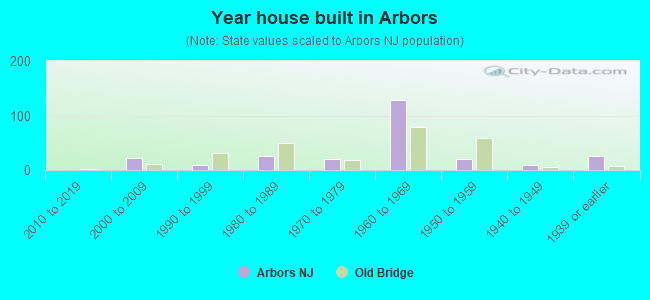
- Year house built in Arbors
- 02020 or later
- 02010 to 2019
- 222000 to 2009
- 91990 to 1999
- 261980 to 1989
- 211970 to 1979
- 1281960 to 1969
- 211950 to 1959
- 91940 to 1949
- 261939 or earlier
City-data.com crime index for place in 2020 (higher means more crime):
| City: | 38.4 |
| U.S. average: | 219.5 |
Travel time to work (commute)
![Travel time to work (commute)]()
- 1Less than 5 minutes
- 65 to 9 minutes
- 2110 to 14 minutes
- 1515 to 19 minutes
- 2920 to 24 minutes
- 1225 to 29 minutes
- 3630 to 34 minutes
- 935 to 39 minutes
- 840 to 44 minutes
- 2645 to 59 minutes
- 1560 to 89 minutes
- 1890 or more minutes

Means of transportation to work
![Means of transportation to work]()
- 73.0%274Drove a car alone
- 2.4%9Carpooled
- 7.5%28Bus
- 2.1%8Long-distance train or commuter rail
- 4.5%17Other means
- 10.4%39Worked at home

Time leaving home to go to work
![Time leaving home to go to work]()
- 812:00 a.m. to 4:59 a.m.
- 75:00 a.m. to 5:29 a.m.
- 65:30 a.m. to 5:59 a.m.
- 126:00 a.m. to 6:29 a.m.
- 176:30 a.m. to 6:59 a.m.
- 377:00 a.m. to 7:29 a.m.
- 217:30 a.m. to 7:59 a.m.
- 238:00 a.m. to 8:29 a.m.
- 128:30 a.m. to 8:59 a.m.
- 99:00 a.m. to 9:59 a.m.
- 1210:00 a.m. to 10:59 a.m.
- 111:00 a.m. to 11:59 a.m.
- 612:00 p.m. to 3:59 p.m.
- 134:00 p.m. to 11:59 p.m.

Occupations of males:
- Percentage of males in management occupations (except farmers):
Here: 7.0% place: 12.3%
- Percentage of males in business and financial operations occupations:
Here: 5.9% place: 12.1%
- Percentage of males in computer and mathematical occupations:
Here: 3.2% place: 5.9%
- Percentage of males in life, physical, and social science occupations:
Here: 1.6% place: 1.6%
- Percentage of males in legal occupations:
Here: 4.7% place: 0.3%
- Percentage of males in education, training, and library occupations:
Here: 1.2% place: 4.4%
- Percentage of males in arts, design, entertainment, sports, and media occupations:
Here: 2.9% place: 2.4%
- Percentage of males in healthcare practitioners and technical occupations:
Here: 1.3% place: 2.8%
- Percentage of males in service occupations:
Here: 24.5% place: 12.4%
- Percentage of males in sales and office occupations:
Here: 15.2% place: 13.2%
- Percentage of males in construction, extraction, and maintenance occupations:
Here: 11.8% place: 8.9%
- Percentage of males in production occupations:
Here: 1.6% place: 2.5%
- Percentage of males in transportation occupations:
Here: 7.8% place: 7.5%
- Percentage of males in material moving occupations:
Here: 7.4% place: 4.7%
Occupations of females:
- Percentage of females in management occupations (except farmers):
Here: 15.8% place: 8.8%
- Percentage of females in business and financial operations occupations:
Here: 3.9% place: 6.6%
- Percentage of females in computer and mathematical occupations:
Here: 1.3% place: 2.6%
- Percentage of females in architecture and engineering occupations:
Here: 1.8% place: 0.1%
- Percentage of females in community and social services occupations:
Here: 1.1% place: 1.7%
- Percentage of females in education, training, and library occupations:
Here: 5.0% place: 12.0%
- Percentage of females in healthcare practitioners and technical occupations:
Here: 10.2% place: 11.4%
- Percentage of females in service occupations:
Here: 15.5% place: 11.6%
- Percentage of females in sales and office occupations:
Here: 31.4% place: 33.9%
- Percentage of females in production occupations:
Here: 3.9% place: 0.9%
- Percentage of females in transportation occupations:
Here: 3.1% place: 0.8%
- Percentage of females in material moving occupations:
Here: 4.9% place: 2.6%
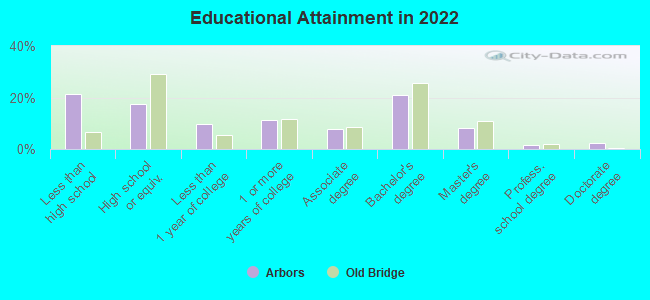
Education in this neighborhood (subdivision or community):
- Percentage of people 3 years and older in K-12 schools:
Arbors: 15.4% Old Bridge: 15.2%
- Percentage of people 3 years and older in undergraduate colleges:
Arbors: 4.3% Old Bridge: 6.1%
- Percentage of people 3 years and older in grad. or professional schools:
Arbors: 2.4% Old Bridge: 1.2%
- Percentage of students K-12 enrolled in private schools:
Arbors: 26.0% Old Bridge: 11.2%
Percentage of population below poverty level:
| Arbors: | 8.0% |
| Old Bridge: | 5.8% |
Median year owner moved in (as recorded in 2022):
| Arbors: | 2003 |
| Old Bridge: | 2001 |
Percentage of married-couple families with both working:
| Arbors: | 63.1% |
| Old Bridge: | 64.0% |
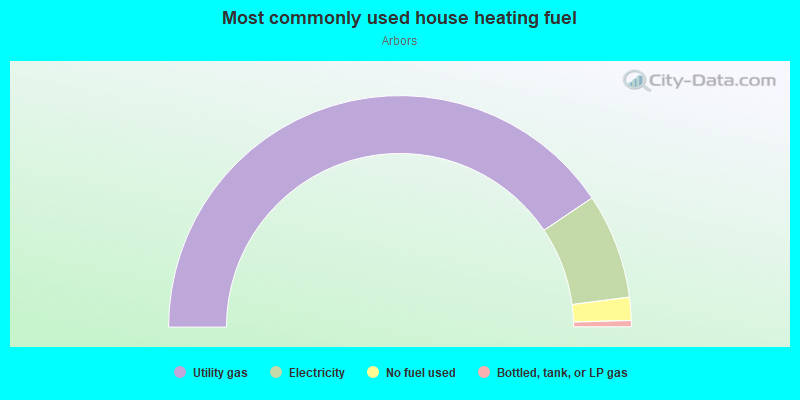
- 81.1%Utility gas
- 14.7%Electricity
- 3.2%No fuel used
- 0.9%Bottled, tank, or LP gas
Roads and streets:
Phillips Dr
Length: 0.76 miles
Directions: E-W, N-S, SE-NW, SW-NE
Address range: 19 to 141
Directions: E-W, N-S, SE-NW, SW-NE
Address range: 19 to 141
Rock Hill Rd
Length: 0.50 miles
Directions: E-W, SE-NW, SW-NE
Address range: 1 to 103
Directions: E-W, SE-NW, SW-NE
Address range: 1 to 103
Shadowlawn Dr
Length: 0.29 miles
Directions: N-S, SE-NW
Address range: 1 to 60
Directions: N-S, SE-NW
Address range: 1 to 60
Cedar Grove Pl
Length: 0.25 miles
Directions: N-S, SE-NW
Address range: 1 to 51
Directions: N-S, SE-NW
Address range: 1 to 51
Whitewood Pl
Length: 0.25 miles
Directions: N-S, SE-NW
Address range: 1 to 50
Directions: N-S, SE-NW
Address range: 1 to 50
Greenwood Rd
Length: 0.23 miles
Directions: E-W, SW-NE
Address range: 53 to 105
Directions: E-W, SW-NE
Address range: 53 to 105
Co Rd 687 (Cottrell Rd)
Length: 0.21 miles
Direction: N-S
Address range: 232 to 999
Direction: N-S
Address range: 232 to 999
Linwood Ter
Length: 0.12 miles
Directions: N-S, SE-NW
Address range: 1 to 22
Directions: N-S, SE-NW
Address range: 1 to 22
Appleton Ter
Length: 0.11 miles
Direction: SE-NW
Address range: 1 to 25
Direction: SE-NW
Address range: 1 to 25
Colonial Dr (Colonial Rd)
Length: 0.02 miles
Direction: N-S
Address range: 1 to 99
Direction: N-S
Address range: 1 to 99