Atlantic Times Square neighborhood in Monterey Park, California (CA), 91754, 91803 detailed profile
Settings
X


Business Search - 14 Million verified businesses
Area: 0.055 square miles
Population: 808
Population density:
| Atlantic Times Square: | 14,718 people per square mile |
| Monterey Park: | 7,913 people per square mile |

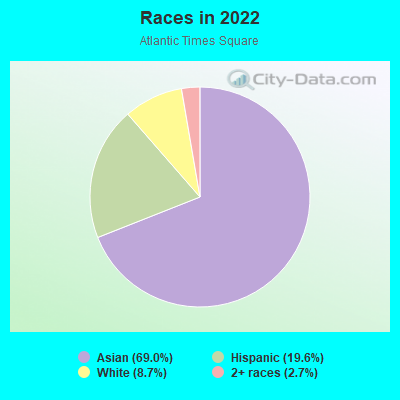
- 55669.0%Asian
- 15819.6%Hispanic or Latino
- 708.7%White
- 222.7%Two or more races
Median household income in 2022:
| Atlantic Times Square: | $73,180 |
| Monterey Park: | $76,892 |
Distribution of median household income
![Distribution of median household income]()
- 35Less than $10,000
- 33$10,000 to $19,999
- 21$20,000 to $29,999
- 22$30,000 to $39,999
- 17$40,000 to $49,999
- 48$50,000 to $59,999
- 24$60,000 to $74,999
- 20$75,000 to $99,999
- 21$100,000 to $124,999
- 18$125,000 to $149,999
- 20$150,000 to $199,999
- 72$200,000 or more

Distribution of owner-occupied house/condo value
![Distribution of owner-occupied house/condo value]()
- 3$50,000 to $99,999
- 16$300,000 to $399,999
- 3$400,000 to $499,999
- 90$500,000 to $749,999
- 47$750,000 to $999,999
- 13$1,000,000 or more

Distribution of rent paid by renters
![Distribution of rent paid by renters]()
- 2$300 to $399
- 9$400 to $499
- 6$500 to $599
- 2$700 to $799
- 10$900 to $999
- 48$1,000 to $1,249
- 29$1,250 to $1,499
- 58$1,500 to $1,999
- 53$2,000 or more

Median rent in 2022:
| Atlantic Times Square: | $1,854 |
| Monterey Park: | $1,680 |
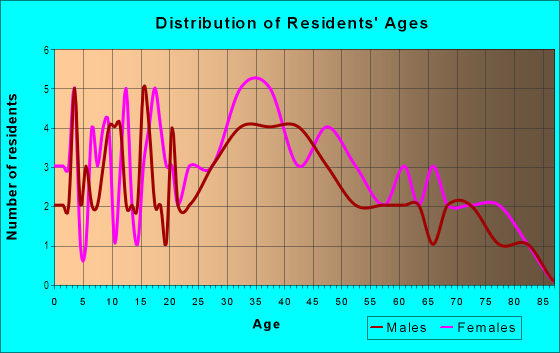
| Males: | 415 |
| Females: | 392 |
Males:
| This neighborhood: | 40.2 years |
| Whole city: | 43.5 years |
| This neighborhood: | 51.5 years |
| Whole city: | 45.7 years |
Average household size:
| Atlantic Times Square: | 2.7 people |
| Monterey Park: | 2.9 people |
Percentage of family households:
| Atlantic Times Square: | 42.9% |
| Monterey Park: | 43.7% |
| Here: | 56.4% |
| Monterey Park: | 50.8% |
Percentage of married-couple families with children (among all households):
| Atlantic Times Square: | 33.8% |
| Monterey Park: | 25.4% |
Percentage of single-mother households (among all households):
| Atlantic Times Square: | 3.9% |
| Monterey Park: | 6.4% |
Percentage of never married males 15 years old and over:
Percentage of never married females 15 years old and over:
| Atlantic Times Square: | 17.8% |
| Monterey Park: | 18.8% |
Percentage of never married females 15 years old and over:
| Atlantic Times Square: | 13.0% |
| city: | 16.4% |
Percentage of people that speak English not well or not at all:
| Atlantic Times Square: | 28.9% |
| Monterey Park: | 24.6% |
Percentage of people born in this state:
Percentage of people born in another U.S. state:
Percentage of native residents but born outside the U.S.:
Percentage of foreign born residents:
| Here: | 24.9% |
| Monterey Park: | 42.1% |
Percentage of people born in another U.S. state:
| Atlantic Times Square: | 5.6% |
| Monterey Park: | 5.2% |
Percentage of native residents but born outside the U.S.:
| Here: | 0.4% |
| city: | 1.1% |
Percentage of foreign born residents:
| Here: | 69.3% |
| Monterey Park: | 51.5% |
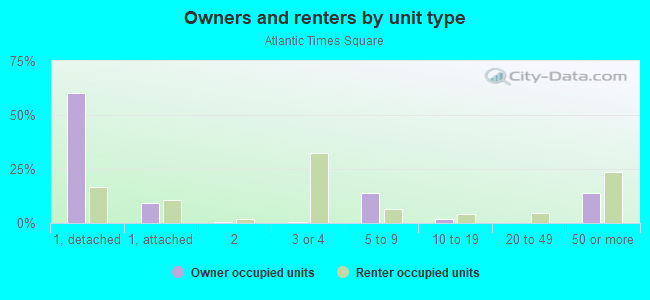
Owner-occupied
Renter-occupied

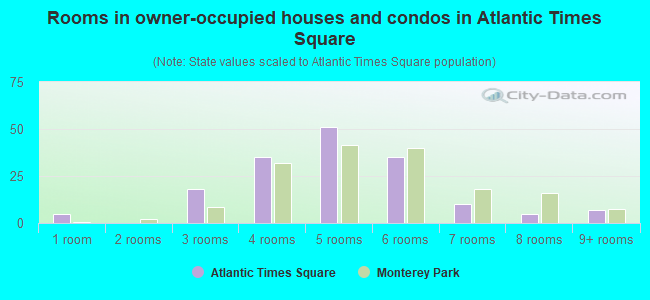
- Rooms in owner-occupied houses and condos in Atlantic Times Square
- 51 room
- 02 rooms
- 183 rooms
- 354 rooms
- 515 rooms
- 356 rooms
- 107 rooms
- 58 rooms
- 79+ rooms
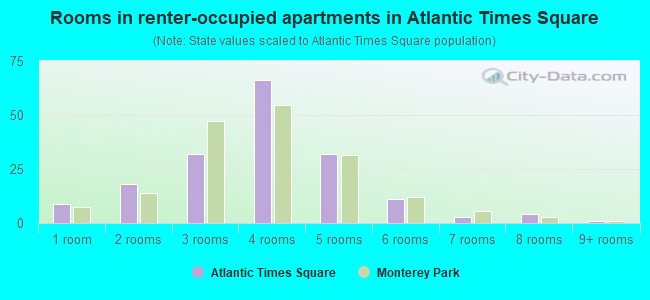
- Rooms in renter-occupied apartments in Atlantic Times Square
- 91 room
- 182 rooms
- 323 rooms
- 664 rooms
- 325 rooms
- 116 rooms
- 37 rooms
- 48 rooms
- 19+ rooms
Owner-occupied
Renter-occupied
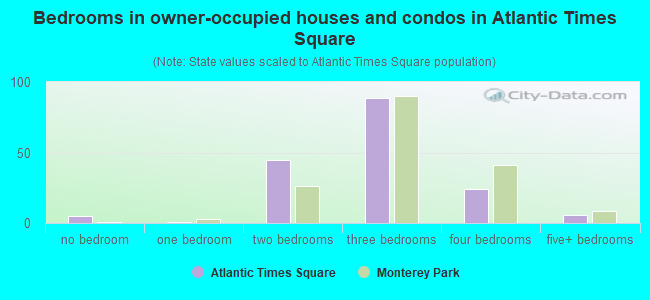
- Bedrooms in owner-occupied houses and condos in Atlantic Times Square
- 5no bedroom
- 11 bedroom
- 452 bedrooms
- 893 bedrooms
- 244 bedrooms
- 65+ bedrooms
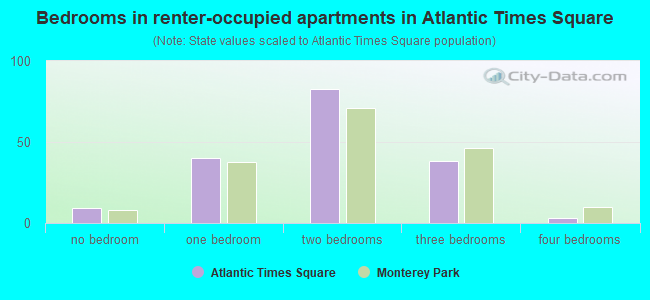
- Bedrooms in renter-occupied apartments in Atlantic Times Square
- 9no bedroom
- 401 bedroom
- 832 bedrooms
- 383 bedrooms
- 34 bedrooms
- 05+ bedrooms
Average number of cars or other vehicles available in houses/condos:
Average number of cars or other vehicles available in apartments:
| This neighborhood: | 2.0 |
| Monterey Park: | 2.1 |
Average number of cars or other vehicles available in apartments:
| Here: | 2.2 |
| city: | 1.7 |
Percentage of units with a mortgage:
| Atlantic Times Square: | 50.1% |
| Monterey Park: | 51.4% |
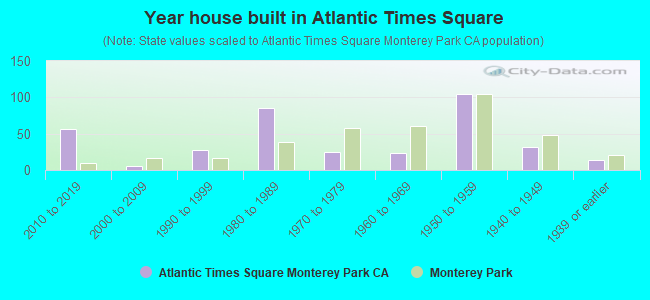
- Year house built in Atlantic Times Square
- 02020 or later
- 572010 to 2019
- 52000 to 2009
- 281990 to 1999
- 861980 to 1989
- 251970 to 1979
- 241960 to 1969
- 1051950 to 1959
- 321940 to 1949
- 141939 or earlier
City-data.com crime index for city in 2020 (higher means more crime):
| City: | 172.7 |
| U.S. average: | 219.5 |
Travel time to work (commute)
![Travel time to work (commute)]()
- 2Less than 5 minutes
- 295 to 9 minutes
- 4810 to 14 minutes
- 4115 to 19 minutes
- 3020 to 24 minutes
- 1225 to 29 minutes
- 8230 to 34 minutes
- 1135 to 39 minutes
- 1140 to 44 minutes
- 5945 to 59 minutes
- 1960 to 89 minutes
- 790 or more minutes

Means of transportation to work
![Means of transportation to work]()
- 69.3%302Drove a car alone
- 15.8%69Carpooled
- 1.1%5Bus
- 0.2%1Motorcycle
- 3.2%14Walked
- 2.1%9Other means
- 10.3%45Worked at home

Time leaving home to go to work
![Time leaving home to go to work]()
- 512:00 a.m. to 4:59 a.m.
- 125:00 a.m. to 5:29 a.m.
- 105:30 a.m. to 5:59 a.m.
- 256:00 a.m. to 6:29 a.m.
- 126:30 a.m. to 6:59 a.m.
- 157:00 a.m. to 7:29 a.m.
- 367:30 a.m. to 7:59 a.m.
- 548:00 a.m. to 8:29 a.m.
- 398:30 a.m. to 8:59 a.m.
- 599:00 a.m. to 9:59 a.m.
- 2010:00 a.m. to 10:59 a.m.
- 1111:00 a.m. to 11:59 a.m.
- 1512:00 p.m. to 3:59 p.m.
- 134:00 p.m. to 11:59 p.m.

Occupations of males:
- Percentage of males in management occupations (except farmers):
Here: 19.2% city: 8.8%
- Percentage of males in computer and mathematical occupations:
Here: 3.2% city: 6.8%
- Percentage of males in architecture and engineering occupations:
Here: 5.7% city: 3.1%
- Percentage of males in education, training, and library occupations:
Here: 2.9% city: 2.1%
- Percentage of males in arts, design, entertainment, sports, and media occupations:
Here: 6.0% city: 2.8%
- Percentage of males in healthcare practitioners and technical occupations:
Here: 1.3% city: 3.5%
- Percentage of males in service occupations:
Here: 25.6% city: 17.9%
- Percentage of males in sales and office occupations:
Here: 18.5% city: 20.0%
- Percentage of males in production occupations:
Here: 10.3% city: 4.5%
- Percentage of males in transportation occupations:
Here: 2.3% city: 9.5%
- Percentage of males in material moving occupations:
Here: 3.2% city: 3.8%
Occupations of females:
- Percentage of females in management occupations (except farmers):
Here: 8.2% city: 9.5%
- Percentage of females in business and financial operations occupations:
Here: 6.7% city: 6.7%
- Percentage of females in legal occupations:
Here: 1.0% city: 1.3%
- Percentage of females in education, training, and library occupations:
Here: 2.5% city: 7.7%
- Percentage of females in arts, design, entertainment, sports, and media occupations:
Here: 7.9% city: 2.3%
- Percentage of females in healthcare practitioners and technical occupations:
Here: 6.0% city: 8.3%
- Percentage of females in service occupations:
Here: 38.7% city: 27.4%
- Percentage of females in sales and office occupations:
Here: 24.8% city: 25.0%
- Percentage of females in farming, fishing, and forestry occupations:
Here: 4.3% city: 0.2%
- Percentage of females in production occupations:
Here: 4.2% city: 4.2%
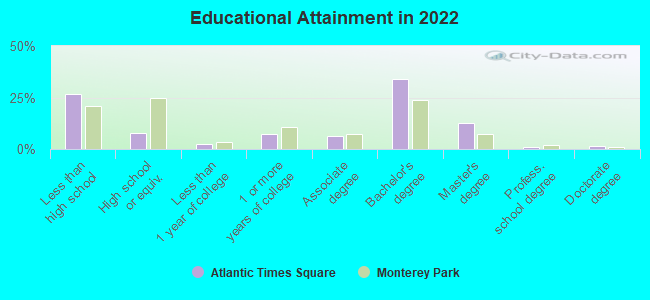
Education in this neighborhood (subdivision or community):
- Percentage of people 3 years and older in K-12 schools:
Atlantic Times Square: 11.3% Monterey Park: 13.2%
- Percentage of people 3 years and older in undergraduate colleges:
Atlantic Times Square: 8.5% Monterey Park: 6.2%
- Percentage of people 3 years and older in grad. or professional schools:
Atlantic Times Square: 2.4% Monterey Park: 1.4%
- Percentage of students K-12 enrolled in private schools:
Atlantic Times Square: 22.0% Monterey Park: 10.2%
Percentage of population below poverty level:
| Atlantic Times Square: | 15.1% |
| Monterey Park: | 12.0% |
Median year owner moved in (as recorded in 2022):
Median year renter moved in (as recorded in 2022):
| Atlantic Times Square: | 2005 |
| Monterey Park: | 2001 |
Median year renter moved in (as recorded in 2022):
| Atlantic Times Square: | 2015 |
| Monterey Park: | 2014 |
Percentage of married-couple families with both working:
| Atlantic Times Square: | 60.1% |
| Monterey Park: | 69.2% |
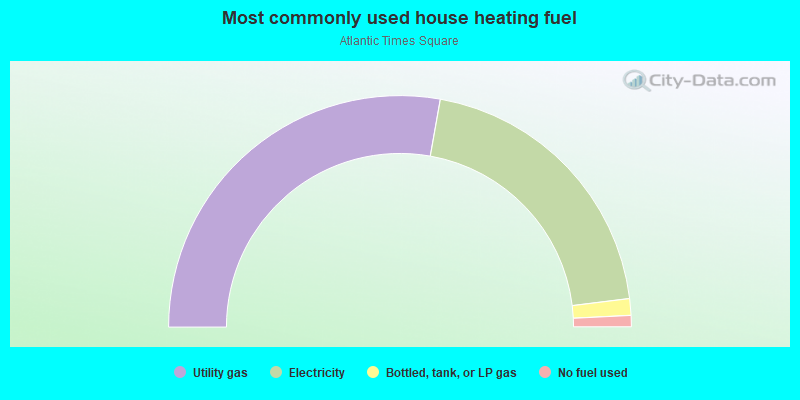
- 55.6%Utility gas
- 40.5%Electricity
- 2.3%Bottled, tank, or LP gas
- 1.6%No fuel used
Roads and streets:
W Hellman Ave
Length: 0.44 miles
Direction: E-W
Address range: 622 to 1399
Direction: E-W
Address range: 622 to 1399
S Atlantic Blvd
Length: 0.01 miles
Direction: N-S
Address range: 2080 to 2099
Direction: N-S
Address range: 2080 to 2099