Autoville neighborhood in College Park, Maryland (MD), 20740, 20742 detailed profile
Settings
X


Business Search - 14 Million verified businesses
Area: 0.400 square miles
Population: 1,487
Population density:
| Autoville: | 3,715 people per square mile |
| College Park: | 6,333 people per square mile |

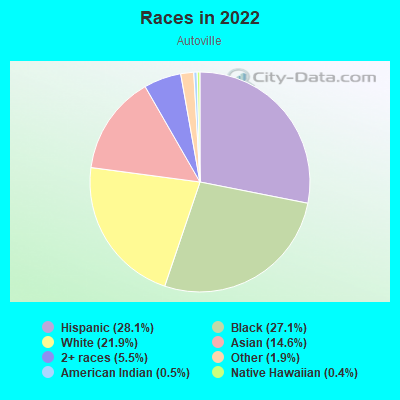
- 43028.1%Hispanic or Latino
- 41427.1%Black
- 33421.9%White
- 22314.6%Asian
- 845.5%Two or more races
- 291.9%Some other race
- 80.5%American Indian
- 60.4%Native Hawaiian and Other
Pacific Islander
Median household income in 2022:
| Autoville: | $95,300 |
| College Park: | $76,973 |
Distribution of median household income
![Distribution of median household income]()
- 72Less than $10,000
- 96$10,000 to $19,999
- 51$20,000 to $29,999
- 46$30,000 to $39,999
- 41$40,000 to $49,999
- 49$50,000 to $59,999
- 52$60,000 to $74,999
- 59$75,000 to $99,999
- 77$100,000 to $124,999
- 63$125,000 to $149,999
- 54$150,000 to $199,999
- 36$200,000 or more

Distribution of owner-occupied house/condo value
![Distribution of owner-occupied house/condo value]()
- 19Less than $50,000
- 17$100,000 to $149,999
- 94$200,000 to $249,999
- 14$250,000 to $299,999
- 66$300,000 to $399,999
- 71$400,000 to $499,999
- 32$500,000 to $749,999
- 18$1,000,000 or more

Distribution of rent paid by renters
![Distribution of rent paid by renters]()
- 15$100 to $199
- 157$200 to $299
- 41$300 to $399
- 2$400 to $499
- 3$500 to $599
- 72$600 to $699
- 17$700 to $799
- 29$800 to $899
- 9$900 to $999
- 170$1,000 to $1,249
- 67$1,250 to $1,499
- 130$1,500 to $1,999
- 166$2,000 or more

| Males: | 839 |
| Females: | 648 |
Males:
| This neighborhood: | 37.4 years |
| Whole city: | 22.0 years |
| This neighborhood: | 30.1 years |
| Whole city: | 21.2 years |
Average household size:
| Autoville: | 2.7 people |
| College Park: | 2.7 people |
Percentage of family households:
| Autoville: | 34.7% |
| College Park: | 30.6% |
| Here: | 24.6% |
| College Park: | 28.7% |
Percentage of married-couple families with children (among all households):
| Autoville: | 29.1% |
| College Park: | 20.4% |
Percentage of single-mother households (among all households):
| Autoville: | 18.1% |
| College Park: | 4.3% |
Percentage of never married males 15 years old and over:
Percentage of never married females 15 years old and over:
| Autoville: | 39.0% |
| College Park: | 38.3% |
Percentage of never married females 15 years old and over:
| Autoville: | 29.3% |
| city: | 36.3% |
Percentage of people that speak English not well or not at all:
| Autoville: | 21.7% |
| College Park: | 6.6% |
Percentage of people born in this state:
Percentage of people born in another U.S. state:
Percentage of native residents but born outside the U.S.:
Percentage of foreign born residents:
| Here: | 28.5% |
| College Park: | 34.2% |
Percentage of people born in another U.S. state:
| Autoville: | 34.7% |
| College Park: | 40.7% |
Percentage of native residents but born outside the U.S.:
| Here: | 2.4% |
| city: | 1.9% |
Percentage of foreign born residents:
| Here: | 34.3% |
| College Park: | 23.1% |
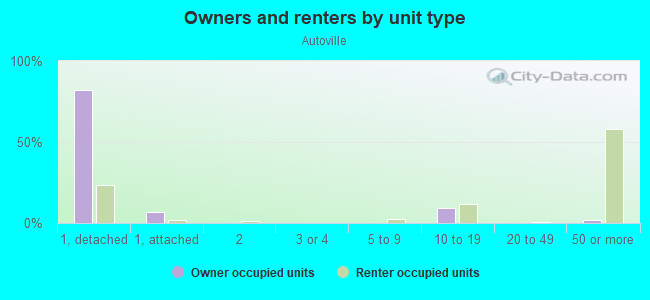
Owner-occupied
Renter-occupied

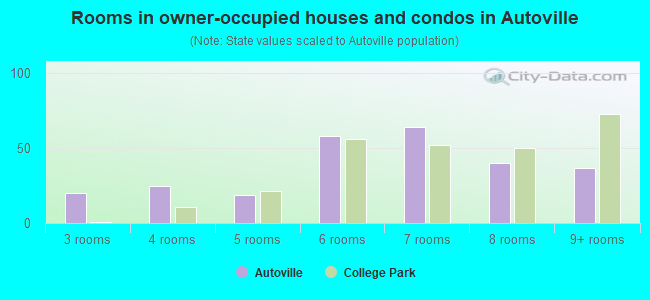
- Rooms in owner-occupied houses and condos in Autoville
- 01 room
- 02 rooms
- 203 rooms
- 254 rooms
- 195 rooms
- 586 rooms
- 647 rooms
- 408 rooms
- 379+ rooms
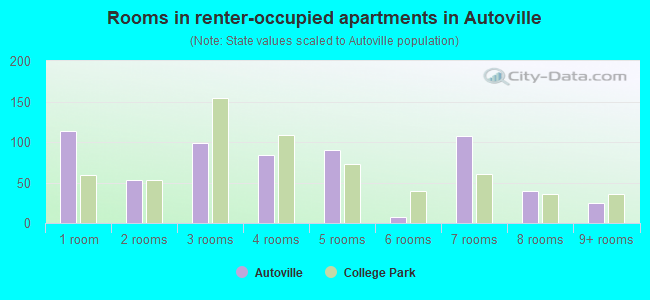
- Rooms in renter-occupied apartments in Autoville
- 1141 room
- 532 rooms
- 993 rooms
- 844 rooms
- 905 rooms
- 86 rooms
- 1087 rooms
- 398 rooms
- 259+ rooms
Owner-occupied
Renter-occupied
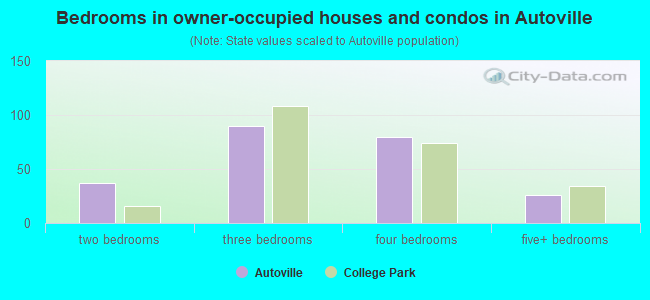
- Bedrooms in owner-occupied houses and condos in Autoville
- 0no bedroom
- 01 bedroom
- 372 bedrooms
- 903 bedrooms
- 804 bedrooms
- 265+ bedrooms
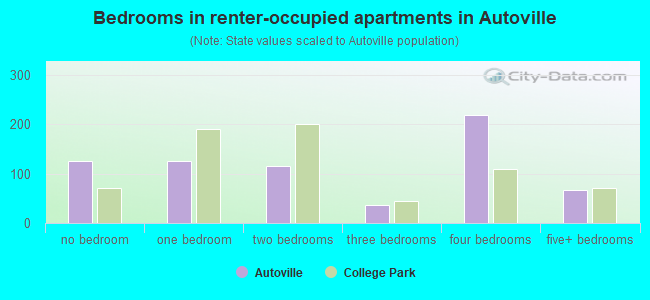
- Bedrooms in renter-occupied apartments in Autoville
- 125no bedroom
- 1251 bedroom
- 1152 bedrooms
- 373 bedrooms
- 2194 bedrooms
- 675+ bedrooms
Average number of cars or other vehicles available in houses/condos:
Average number of cars or other vehicles available in apartments:
| This neighborhood: | |
| College Park: |
Average number of cars or other vehicles available in apartments:
| Here: | 1.5 |
| city: | 1.4 |
Percentage of units with a mortgage:
| Autoville: | 63.5% |
| College Park: | 66.4% |
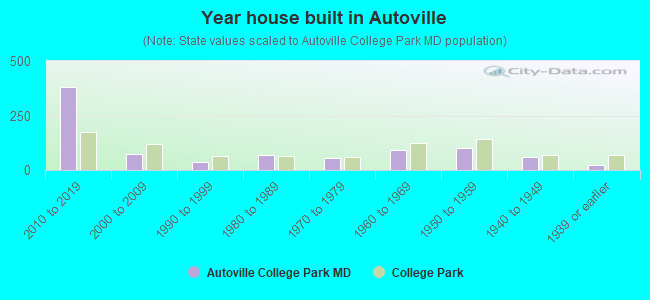
- Year house built in Autoville
- 02020 or later
- 3792010 to 2019
- 752000 to 2009
- 351990 to 1999
- 701980 to 1989
- 551970 to 1979
- 901960 to 1969
- 1011950 to 1959
- 591940 to 1949
- 221939 or earlier
Travel time to work (commute)
![Travel time to work (commute)]()
- 37Less than 5 minutes
- 435 to 9 minutes
- 15610 to 14 minutes
- 16315 to 19 minutes
- 18020 to 24 minutes
- 2825 to 29 minutes
- 10630 to 34 minutes
- 6235 to 39 minutes
- 7140 to 44 minutes
- 7145 to 59 minutes
- 10460 to 89 minutes
- 2690 or more minutes

Means of transportation to work
![Means of transportation to work]()
- 52.5%460Drove a car alone
- 24.3%213Carpooled
- 2.7%24Bus
- 2.1%18Subway or elevated rail
- 1.6%14Long-distance train or commuter rail
- 3.2%28Light rail, streetcar or trolley
- 0.7%6Taxi
- 2.1%18Motorcycle
- 5.8%51Bicycle
- 2.3%20Walked
- 1.4%12Other means
- 9.6%84Worked at home

Time leaving home to go to work
![Time leaving home to go to work]()
- 4112:00 a.m. to 4:59 a.m.
- 235:00 a.m. to 5:29 a.m.
- 305:30 a.m. to 5:59 a.m.
- 866:00 a.m. to 6:29 a.m.
- 446:30 a.m. to 6:59 a.m.
- 1167:00 a.m. to 7:29 a.m.
- 907:30 a.m. to 7:59 a.m.
- 2298:00 a.m. to 8:29 a.m.
- 778:30 a.m. to 8:59 a.m.
- 1229:00 a.m. to 9:59 a.m.
- 3610:00 a.m. to 10:59 a.m.
- 4411:00 a.m. to 11:59 a.m.
- 9212:00 p.m. to 3:59 p.m.
- 434:00 p.m. to 11:59 p.m.

Occupations of males:
- Percentage of males in management occupations (except farmers):
Here: 4.3% city: 6.2%
- Percentage of males in business and financial operations occupations:
Here: 1.0% city: 3.6%
- Percentage of males in computer and mathematical occupations:
Here: 8.4% city: 10.0%
- Percentage of males in architecture and engineering occupations:
Here: 5.0% city: 3.9%
- Percentage of males in life, physical, and social science occupations:
Here: 1.9% city: 4.2%
- Percentage of males in education, training, and library occupations:
Here: 14.6% city: 12.5%
- Percentage of males in arts, design, entertainment, sports, and media occupations:
Here: 3.3% city: 2.3%
- Percentage of males in healthcare practitioners and technical occupations:
Here: 1.3% city: 1.2%
- Percentage of males in service occupations:
Here: 4.5% city: 13.5%
- Percentage of males in sales and office occupations:
Here: 4.9% city: 11.3%
- Percentage of males in construction, extraction, and maintenance occupations:
Here: 45.2% city: 18.7%
- Percentage of males in transportation occupations:
Here: 1.5% city: 1.9%
- Percentage of males in material moving occupations:
Here: 3.0% city: 3.8%
Occupations of females:
- Percentage of females in management occupations (except farmers):
Here: 8.1% city: 7.6%
- Percentage of females in business and financial operations occupations:
Here: 5.5% city: 2.8%
- Percentage of females in computer and mathematical occupations:
Here: 3.5% city: 3.2%
- Percentage of females in architecture and engineering occupations:
Here: 1.9% city: 0.8%
- Percentage of females in community and social services occupations:
Here: 1.6% city: 2.0%
- Percentage of females in education, training, and library occupations:
Here: 18.9% city: 22.3%
- Percentage of females in healthcare practitioners and technical occupations:
Here: 8.1% city: 5.4%
- Percentage of females in service occupations:
Here: 17.5% city: 17.1%
- Percentage of females in sales and office occupations:
Here: 28.0% city: 25.5%
- Percentage of females in construction, extraction, and maintenance occupations:
Here: 3.6% city: 0.5%
- Percentage of females in production occupations:
Here: 1.1% city: 1.4%
Percentage of people 16-64 in Armed Forces:
| Autoville: | 0.3% |
| College Park: | 0.4% |
Education in this neighborhood (subdivision or community):
- Percentage of people 3 years and older in K-12 schools:
Autoville: 11.3% College Park: 5.2%
- Percentage of people 3 years and older in undergraduate colleges:
Autoville: 18.2% College Park: 48.1%
- Percentage of people 3 years and older in grad. or professional schools:
Autoville: 10.8% College Park: 4.6%
- Percentage of students K-12 enrolled in private schools:
Autoville: 58.3% College Park: 30.4%
Percentage of population below poverty level:
| Autoville: | 28.6% |
| College Park: | 27.8% |
Median year renter moved in (as recorded in 2022):
| Autoville: | 2017 |
| College Park: | 2019 |
Percentage of married-couple families with both working:
| Autoville: | 98.0% |
| College Park: | 74.3% |
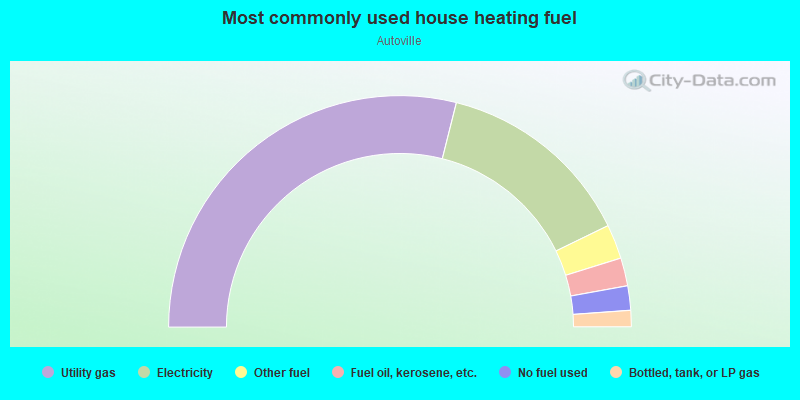
- 57.8%Utility gas
- 27.7%Electricity
- 4.8%Other fuel
- 3.9%Fuel oil, kerosene, etc.
- 3.4%No fuel used
- 2.3%Bottled, tank, or LP gas
Highways in this neighborhood:
US Hwy 1 (Baltimore Ave)
Length: 2.13 miles
Directions: N-S, SW-NE
Address range: 8500 to 9585
Directions: N-S, SW-NE
Address range: 8500 to 9585
State Hwy 193 (University Blvd)
Length: 0.67 miles
Direction: E-W
Address range: 4600 to 4698
Direction: E-W
Address range: 4600 to 4698
Roads and streets:
Autoville Dr
Length: 0.45 miles
Direction: N-S
Address range: 9000 to 9625
Direction: N-S
Address range: 9000 to 9625
Metzerott Rd
Length: 0.27 miles
Direction: E-W
Address range: 4215 to 4399
Direction: E-W
Address range: 4215 to 4399
Belvedere Ave
Length: 0.23 miles
Direction: N-S
Direction: N-S
Erie St
Length: 0.12 miles
Directions: E-W, SE-NW
Address range: 4600 to 4748
Directions: E-W, SE-NW
Address range: 4600 to 4748
Cherokee St
Length: 0.11 miles
Direction: E-W
Address range: 4600 to 4699
Direction: E-W
Address range: 4600 to 4699
Ada St
Length: 0.10 miles
Direction: E-W
Direction: E-W
Blackfoot Rd
Length: 0.05 miles
Direction: E-W
Address range: 4600 to 4799
Direction: E-W
Address range: 4600 to 4799
Other features:
Little Paint Br
Length: 0.76 miles
Directions: E-W, N-S, SE-NW, SW-NE
Directions: E-W, N-S, SE-NW, SW-NE