Baker Ranch neighborhood in Lake Forest, California (CA), 92610, 92630 detailed profile
Settings
X


Business Search - 14 Million verified businesses
Area: 1.059 square miles
Population: 1,035
Population density:
| Baker Ranch: | 978 people per square mile |
| Lake Forest: | 6,854 people per square mile |

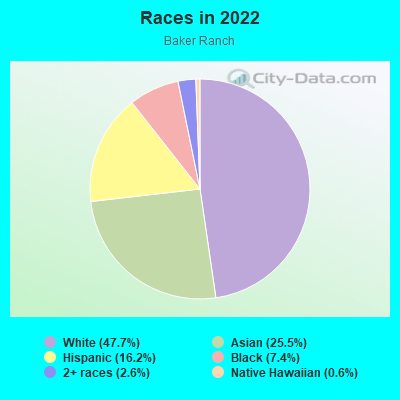
- 50647.7%White
- 27025.5%Asian
- 17216.2%Hispanic or Latino
- 787.4%Black
- 282.6%Two or more races
- 60.6%Native Hawaiian and Other
Pacific Islander
Median household income in 2022:
| Baker Ranch: | $132,679 |
| Lake Forest: | $128,033 |
Distribution of median household income
![Distribution of median household income]()
- 64Less than $10,000
- 45$10,000 to $19,999
- 42$20,000 to $29,999
- 29$30,000 to $39,999
- 90$40,000 to $49,999
- 15$50,000 to $59,999
- 23$60,000 to $74,999
- 10$75,000 to $99,999
- 42$100,000 to $124,999
- 27$125,000 to $149,999
- 60$150,000 to $199,999
- 114$200,000 or more

Distribution of owner-occupied house/condo value
![Distribution of owner-occupied house/condo value]()
- 8Less than $50,000
- 5$250,000 to $299,999
- 2$300,000 to $399,999
- 12$400,000 to $499,999
- 5$500,000 to $749,999
- 63$750,000 to $999,999
- 204$1,000,000 or more

Distribution of rent paid by renters
![Distribution of rent paid by renters]()
- 68$200 to $299
- 2$300 to $399
- 41$700 to $799
- 19$900 to $999
- 2$1,000 to $1,249
- 6$1,250 to $1,499
- 153$1,500 to $1,999
- 324$2,000 or more

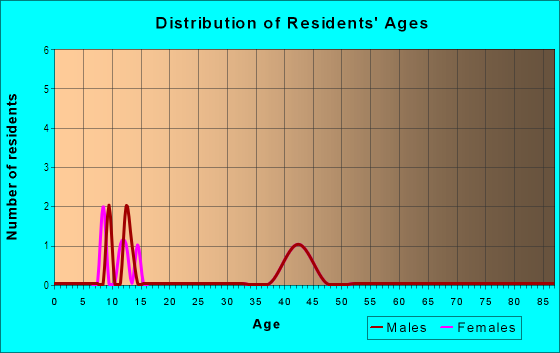
| Males: | 491 |
| Females: | 544 |
Males:
| This neighborhood: | 45.4 years |
| Whole city: | 38.6 years |
| This neighborhood: | 47.4 years |
| Whole city: | 42.8 years |
Average household size:
| Baker Ranch: | 2.6 people |
| Lake Forest: | 2.7 people |
Percentage of family households:
| Baker Ranch: | 47.9% |
| Lake Forest: | 46.6% |
| Here: | 60.2% |
| Lake Forest: | 57.3% |
Percentage of married-couple families with children (among all households):
| Baker Ranch: | 29.3% |
| Lake Forest: | 32.9% |
Percentage of single-mother households (among all households):
| Baker Ranch: | 24.4% |
| Lake Forest: | 3.5% |
Percentage of never married males 15 years old and over:
Percentage of never married females 15 years old and over:
| Baker Ranch: | 15.3% |
| Lake Forest: | 16.3% |
Percentage of never married females 15 years old and over:
| Baker Ranch: | 19.5% |
| city: | 13.9% |
Percentage of people that speak English not well or not at all:
| Baker Ranch: | 8.6% |
| Lake Forest: | 5.2% |
Percentage of people born in this state:
Percentage of people born in another U.S. state:
Percentage of native residents but born outside the U.S.:
Percentage of foreign born residents:
| Here: | 47.0% |
| Lake Forest: | 53.6% |
Percentage of people born in another U.S. state:
| Baker Ranch: | 18.8% |
| Lake Forest: | 15.5% |
Percentage of native residents but born outside the U.S.:
| Here: | 1.6% |
| city: | 1.5% |
Percentage of foreign born residents:
| Here: | 32.7% |
| Lake Forest: | 29.4% |
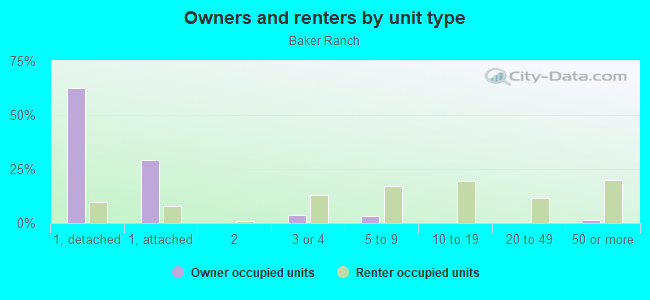
Owner-occupied
Renter-occupied

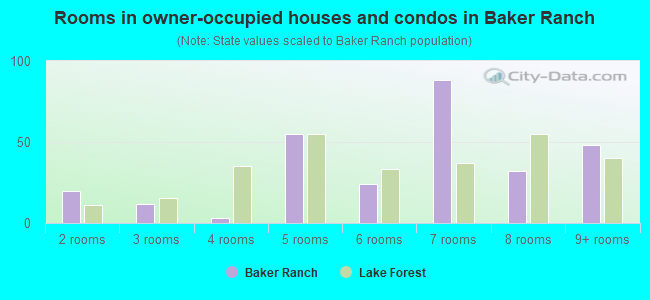
- Rooms in owner-occupied houses and condos in Baker Ranch
- 01 room
- 202 rooms
- 123 rooms
- 34 rooms
- 555 rooms
- 246 rooms
- 887 rooms
- 328 rooms
- 489+ rooms
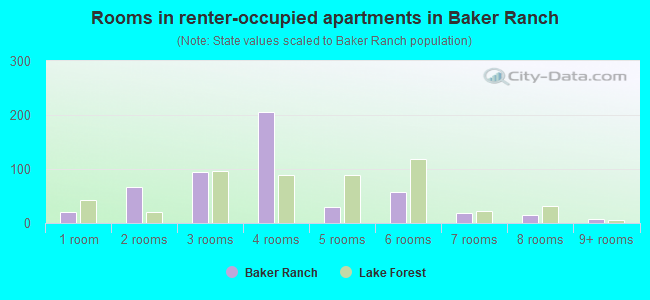
- Rooms in renter-occupied apartments in Baker Ranch
- 211 room
- 662 rooms
- 953 rooms
- 2054 rooms
- 295 rooms
- 586 rooms
- 187 rooms
- 158 rooms
- 79+ rooms
Owner-occupied
Renter-occupied
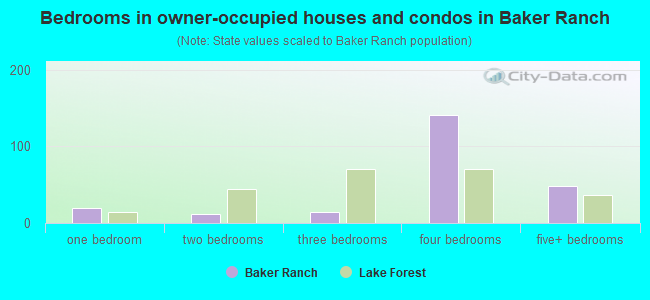
- Bedrooms in owner-occupied houses and condos in Baker Ranch
- 0no bedroom
- 201 bedroom
- 122 bedrooms
- 153 bedrooms
- 1414 bedrooms
- 485+ bedrooms
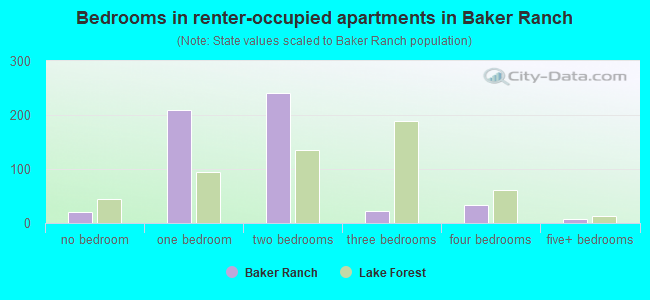
- Bedrooms in renter-occupied apartments in Baker Ranch
- 21no bedroom
- 2101 bedroom
- 2412 bedrooms
- 233 bedrooms
- 334 bedrooms
- 85+ bedrooms
Average number of cars or other vehicles available in houses/condos:
Average number of cars or other vehicles available in apartments:
| This neighborhood: | 2.8 |
| Lake Forest: | 2.2 |
Average number of cars or other vehicles available in apartments:
| Here: | 1.7 |
| city: | 1.8 |
Percentage of units with a mortgage:
| Baker Ranch: | 70.0% |
| Lake Forest: | 75.4% |
Average estimated value of detached houses in 2022 (68.1% of all units):
| Baker Ranch: | $1,237,401 |
| Lake Forest: | $1,141,582 |
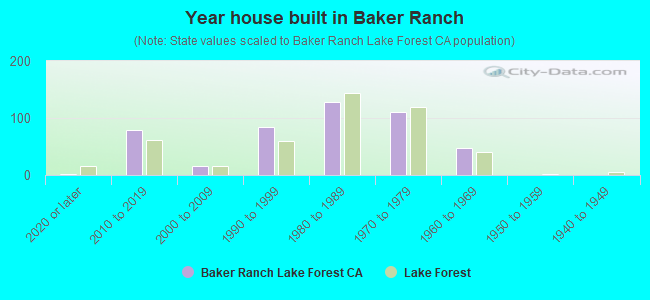
- Year house built in Baker Ranch
- 12020 or later
- 792010 to 2019
- 162000 to 2009
- 851990 to 1999
- 1281980 to 1989
- 1111970 to 1979
- 471960 to 1969
- 01950 to 1959
- 01940 to 1949
- 01939 or earlier
City-data.com crime index for city in 2020 (higher means more crime):
| City: | 85.7 |
| U.S. average: | 219.5 |
Travel time to work (commute)
![Travel time to work (commute)]()
- 7Less than 5 minutes
- 685 to 9 minutes
- 7410 to 14 minutes
- 13815 to 19 minutes
- 14420 to 24 minutes
- 6825 to 29 minutes
- 9730 to 34 minutes
- 1035 to 39 minutes
- 2840 to 44 minutes
- 3245 to 59 minutes
- 2660 to 89 minutes
- 790 or more minutes

Means of transportation to work
![Means of transportation to work]()
- 66.3%350Drove a car alone
- 9.8%52Carpooled
- 4.5%24Bus
- 0.4%2Subway or elevated rail
- 0.2%1Taxi
- 0.9%5Motorcycle
- 4.2%22Bicycle
- 17.4%92Walked
- 0.8%4Other means
- 17.8%94Worked at home

Time leaving home to go to work
![Time leaving home to go to work]()
- 1612:00 a.m. to 4:59 a.m.
- 35:00 a.m. to 5:29 a.m.
- 265:30 a.m. to 5:59 a.m.
- 426:00 a.m. to 6:29 a.m.
- 636:30 a.m. to 6:59 a.m.
- 937:00 a.m. to 7:29 a.m.
- 1147:30 a.m. to 7:59 a.m.
- 1098:00 a.m. to 8:29 a.m.
- 578:30 a.m. to 8:59 a.m.
- 639:00 a.m. to 9:59 a.m.
- 2910:00 a.m. to 10:59 a.m.
- 311:00 a.m. to 11:59 a.m.
- 6112:00 p.m. to 3:59 p.m.
- 324:00 p.m. to 11:59 p.m.

Occupations of males:
- Percentage of males in management occupations (except farmers):
Here: 29.3% city: 17.7%
- Percentage of males in business and financial operations occupations:
Here: 1.7% city: 8.1%
- Percentage of males in computer and mathematical occupations:
Here: 9.3% city: 8.8%
- Percentage of males in architecture and engineering occupations:
Here: 6.9% city: 6.9%
- Percentage of males in life, physical, and social science occupations:
Here: 4.1% city: 1.2%
- Percentage of males in community and social services occupations:
Here: 2.8% city: 1.0%
- Percentage of males in legal occupations:
Here: 1.4% city: 1.3%
- Percentage of males in education, training, and library occupations:
Here: 1.5% city: 2.1%
- Percentage of males in arts, design, entertainment, sports, and media occupations:
Here: 7.8% city: 3.1%
- Percentage of males in healthcare practitioners and technical occupations:
Here: 4.6% city: 2.1%
- Percentage of males in service occupations:
Here: 19.6% city: 12.6%
- Percentage of males in sales and office occupations:
Here: 15.0% city: 16.6%
- Percentage of males in construction, extraction, and maintenance occupations:
Here: 1.2% city: 4.3%
- Percentage of males in production occupations:
Here: 2.1% city: 3.9%
- Percentage of males in transportation occupations:
Here: 1.5% city: 4.4%
- Percentage of males in material moving occupations:
Here: 6.4% city: 3.1%
Occupations of females:
- Percentage of females in management occupations (except farmers):
Here: 6.1% city: 15.3%
- Percentage of females in business and financial operations occupations:
Here: 8.8% city: 11.0%
- Percentage of females in computer and mathematical occupations:
Here: 5.1% city: 1.9%
- Percentage of females in architecture and engineering occupations:
Here: 1.1% city: 1.3%
- Percentage of females in life, physical, and social science occupations:
Here: 2.0% city: 1.2%
- Percentage of females in community and social services occupations:
Here: 5.2% city: 3.0%
- Percentage of females in legal occupations:
Here: 4.5% city: 1.7%
- Percentage of females in education, training, and library occupations:
Here: 12.1% city: 6.9%
- Percentage of females in arts, design, entertainment, sports, and media occupations:
Here: 8.3% city: 2.3%
- Percentage of females in healthcare practitioners and technical occupations:
Here: 3.4% city: 6.7%
- Percentage of females in service occupations:
Here: 21.8% city: 17.1%
- Percentage of females in sales and office occupations:
Here: 31.8% city: 27.1%
- Percentage of females in production occupations:
Here: 2.0% city: 1.6%
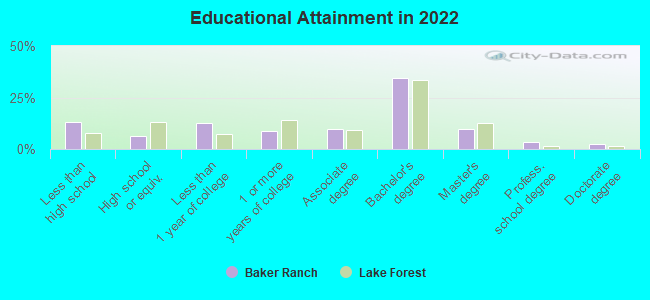
Education in this neighborhood (subdivision or community):
- Percentage of people 3 years and older in K-12 schools:
Baker Ranch: 21.4% Lake Forest: 14.5%
- Percentage of people 3 years and older in undergraduate colleges:
Baker Ranch: 9.4% Lake Forest: 7.6%
- Percentage of people 3 years and older in grad. or professional schools:
Baker Ranch: 3.7% Lake Forest: 1.2%
- Percentage of students K-12 enrolled in private schools:
Baker Ranch: 12.7% Lake Forest: 10.9%
Percentage of population below poverty level:
| Baker Ranch: | 5.8% |
| Lake Forest: | 8.5% |
Median year owner moved in (as recorded in 2022):
Median year renter moved in (as recorded in 2022):
| Baker Ranch: | 2012 |
| Lake Forest: | 2011 |
Median year renter moved in (as recorded in 2022):
| Baker Ranch: | 2017 |
| Lake Forest: | 2019 |
Percentage of married-couple families with both working:
| Baker Ranch: | 142.0% |
| Lake Forest: | 65.9% |
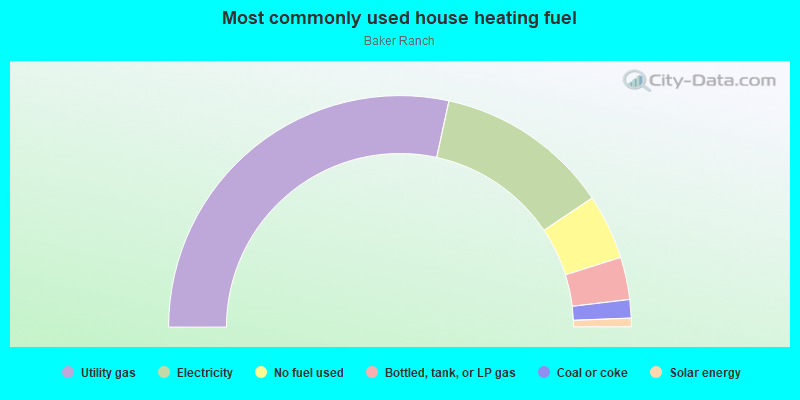
- 56.8%Utility gas
- 24.4%Electricity
- 9.1%No fuel used
- 5.9%Bottled, tank, or LP gas
- 2.6%Coal or coke
- 1.2%Solar energy
Roads and streets:
Rancho Pkwy
Length: 1.10 miles
Directions: E-W, N-S, SE-NW
Address range: 26700 to 26799
Directions: E-W, N-S, SE-NW
Address range: 26700 to 26799
Bake Pkwy
Length: 0.76 miles
Directions: E-W, SW-NE
Directions: E-W, SW-NE
Orchard Rd
Length: 0.30 miles
Directions: N-S, SE-NW, SW-NE
Directions: N-S, SE-NW, SW-NE
Hermana Cir
Length: 0.15 miles
Direction: SW-NE
Address range: 20300 to 20399
Direction: SW-NE
Address range: 20300 to 20399
Windrow Dr
Length: 0.15 miles
Directions: N-S, SW-NE
Address range: 20100 to 20333
Directions: N-S, SW-NE
Address range: 20100 to 20333
Portola Pkwy
Length: 0.11 miles
Direction: SW-NE
Direction: SW-NE
Alton Pkwy
Length: 0.08 miles
Direction: SW-NE
Direction: SW-NE
Lake Forest Dr
Length: 0.08 miles
Direction: N-S
Direction: N-S
Valencia Cir
Length: 0.07 miles
Directions: E-W, SW-NE
Address range: 20201 to 20399
Directions: E-W, SW-NE
Address range: 20201 to 20399
Fuerte Dr
Length: 0.06 miles
Direction: E-W
Direction: E-W
Other features:
Serrano Crk
Length: 0.02 miles
Direction: SW-NE
Direction: SW-NE