Barberdale neighborhood in Midland, Texas (TX), 79705 detailed profile
Settings
X


Business Search - 14 Million verified businesses
Area: 0.124 square miles
Population: 760
Population density:
| Barberdale: | 6,120 people per square mile |
| Midland: | 2,018 people per square mile |

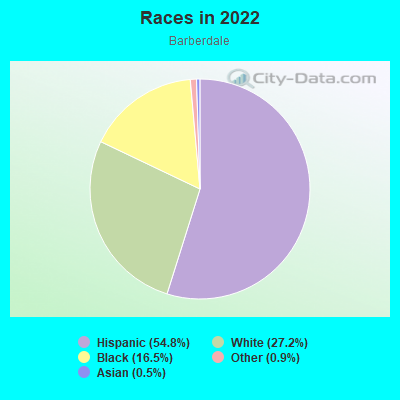
- 41554.8%Hispanic or Latino
- 20627.2%White
- 12516.5%Black
- 70.9%Some other race
- 40.5%Asian
Median household income in 2022:
| Barberdale: | $84,238 |
| Midland: | $80,235 |
Distribution of median household income
![Distribution of median household income]()
- 39Less than $10,000
- 21$10,000 to $19,999
- 23$20,000 to $29,999
- 5$30,000 to $39,999
- 11$40,000 to $49,999
- 15$50,000 to $59,999
- 12$60,000 to $74,999
- 43$75,000 to $99,999
- 20$100,000 to $124,999
- 45$125,000 to $149,999
- 33$150,000 to $199,999
- 28$200,000 or more

Distribution of owner-occupied house/condo value
![Distribution of owner-occupied house/condo value]()
- 22$50,000 to $99,999
- 27$100,000 to $149,999
- 51$150,000 to $199,999
- 18$200,000 to $249,999
- 65$250,000 to $299,999
- 24$300,000 to $399,999

Distribution of rent paid by renters
![Distribution of rent paid by renters]()
- 3$600 to $699
- 6$1,000 to $1,249
- 26$1,250 to $1,499
- 33$2,000 or more

Median rent in 2022:
| Barberdale: | $1,492 |
| Midland: | $1,135 |
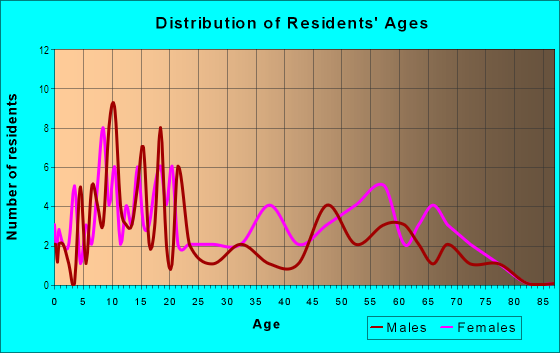
| Males: | 383 |
| Females: | 376 |
Males:
| This neighborhood: | 33.6 years |
| Whole city: | 32.3 years |
| This neighborhood: | 31.9 years |
| Whole city: | 33.3 years |
Average household size:
| Barberdale: | 2.6 people |
| Midland: | 2.4 people |
Percentage of family households:
| Barberdale: | 50.2% |
| Midland: | 52.0% |
| Here: | 45.1% |
| Midland: | 46.4% |
Percentage of married-couple families with children (among all households):
| Barberdale: | 29.3% |
| Midland: | 30.9% |
Percentage of single-mother households (among all households):
| Barberdale: | 4.0% |
| Midland: | 8.1% |
Percentage of never married males 15 years old and over:
Percentage of never married females 15 years old and over:
| Barberdale: | 14.0% |
| Midland: | 15.2% |
Percentage of never married females 15 years old and over:
| Barberdale: | 9.2% |
| city: | 14.9% |
Percentage of people that speak English not well or not at all:
| Barberdale: | 2.8% |
| Midland: | 5.7% |
Percentage of people born in this state:
Percentage of people born in another U.S. state:
Percentage of native residents but born outside the U.S.:
Percentage of foreign born residents:
| Here: | 74.3% |
| Midland: | 69.5% |
Percentage of people born in another U.S. state:
| Barberdale: | 13.9% |
| Midland: | 18.2% |
Percentage of native residents but born outside the U.S.:
| Here: | 0.4% |
| city: | 1.2% |
Percentage of foreign born residents:
| Here: | 11.4% |
| Midland: | 11.2% |
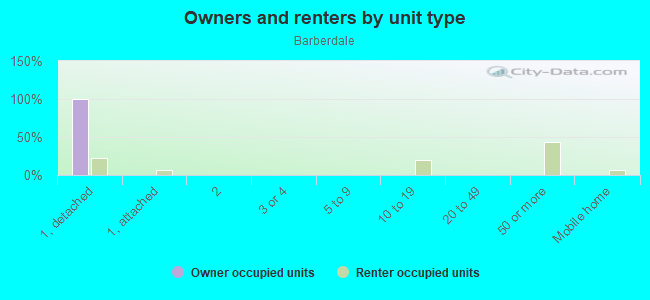
Owner-occupied
Renter-occupied

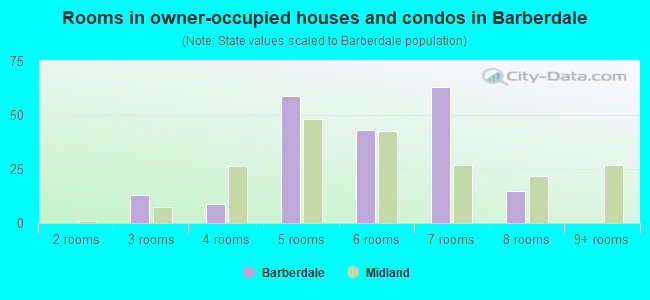
- Rooms in owner-occupied houses and condos in Barberdale
- 01 room
- 02 rooms
- 133 rooms
- 94 rooms
- 595 rooms
- 436 rooms
- 637 rooms
- 158 rooms
- 09+ rooms
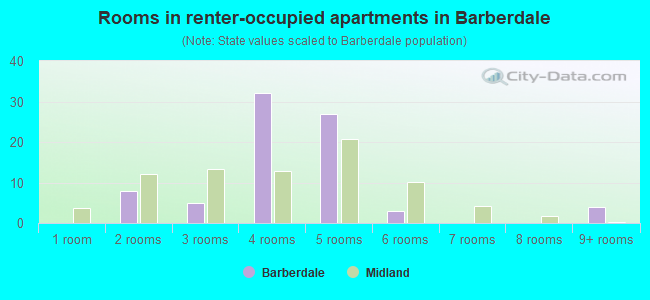
- Rooms in renter-occupied apartments in Barberdale
- 01 room
- 82 rooms
- 53 rooms
- 324 rooms
- 275 rooms
- 36 rooms
- 07 rooms
- 08 rooms
- 49+ rooms
Owner-occupied
Renter-occupied
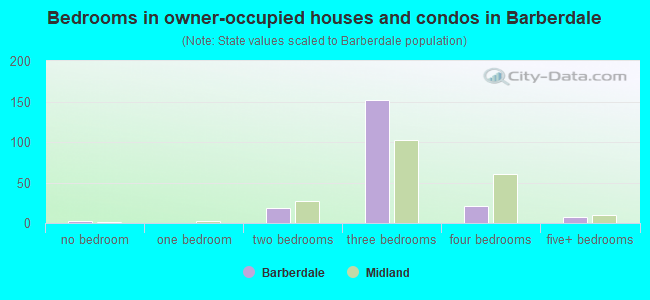
- Bedrooms in owner-occupied houses and condos in Barberdale
- 3no bedroom
- 01 bedroom
- 192 bedrooms
- 1523 bedrooms
- 214 bedrooms
- 85+ bedrooms
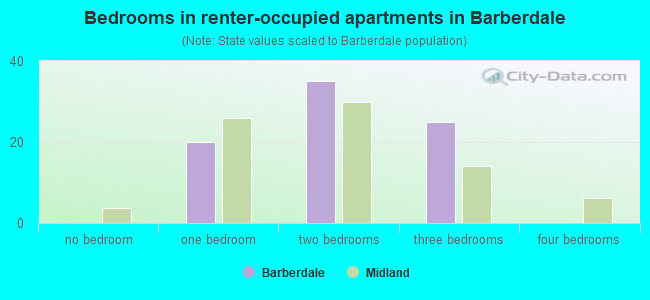
- Bedrooms in renter-occupied apartments in Barberdale
- 0no bedroom
- 201 bedroom
- 352 bedrooms
- 253 bedrooms
- 04 bedrooms
- 05+ bedrooms
Average number of cars or other vehicles available in houses/condos:
Average number of cars or other vehicles available in apartments:
| This neighborhood: | 2.0 |
| Midland: | 2.1 |
Average number of cars or other vehicles available in apartments:
| Here: | 1.8 |
| city: | 1.4 |
Percentage of units with a mortgage:
| Barberdale: | 44.2% |
| Midland: | 58.2% |
Average estimated value of detached houses in 2022 (74.3% of all units):
| Barberdale: | $214,539 |
| Texas: | $369,058 |
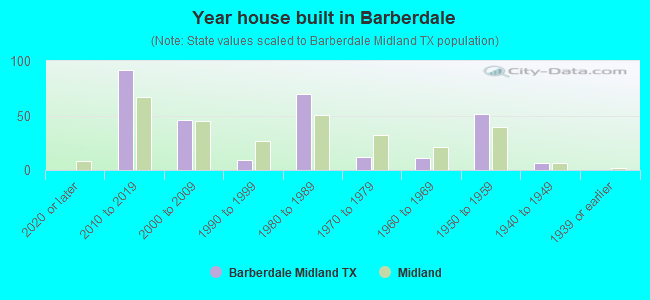
- Year house built in Barberdale
- 02020 or later
- 922010 to 2019
- 462000 to 2009
- 91990 to 1999
- 701980 to 1989
- 121970 to 1979
- 111960 to 1969
- 511950 to 1959
- 61940 to 1949
- 01939 or earlier
City-data.com crime index for city in 2020 (higher means more crime):
| City: | 223.8 |
| U.S. average: | 219.5 |
Travel time to work (commute)
![Travel time to work (commute)]()
- 575 to 9 minutes
- 5810 to 14 minutes
- 6915 to 19 minutes
- 1220 to 24 minutes
- 5930 to 34 minutes
- 2035 to 39 minutes
- 2545 to 59 minutes
- 2390 or more minutes

Means of transportation to work
![Means of transportation to work]()
- 86.5%286Drove a car alone
- 6.3%21Carpooled
- 4.8%16Walked
- 1.5%5Worked at home

Time leaving home to go to work
![Time leaving home to go to work]()
- 2612:00 a.m. to 4:59 a.m.
- 315:00 a.m. to 5:29 a.m.
- 306:00 a.m. to 6:29 a.m.
- 566:30 a.m. to 6:59 a.m.
- 497:00 a.m. to 7:29 a.m.
- 547:30 a.m. to 7:59 a.m.
- 78:00 a.m. to 8:29 a.m.
- 258:30 a.m. to 8:59 a.m.
- 269:00 a.m. to 9:59 a.m.
- 912:00 p.m. to 3:59 p.m.
- 74:00 p.m. to 11:59 p.m.

Occupations of males:
- Percentage of males in management occupations (except farmers):
Here: 5.3% city: 14.6%
- Percentage of males in business and financial operations occupations:
Here: 2.9% city: 3.8%
- Percentage of males in architecture and engineering occupations:
Here: 8.6% city: 7.5%
- Percentage of males in legal occupations:
Here: 8.6% city: 1.2%
- Percentage of males in education, training, and library occupations:
Here: 3.7% city: 2.5%
- Percentage of males in healthcare practitioners and technical occupations:
Here: 1.2% city: 1.2%
- Percentage of males in service occupations:
Here: 11.3% city: 9.5%
- Percentage of males in sales and office occupations:
Here: 8.6% city: 14.8%
- Percentage of males in construction, extraction, and maintenance occupations:
Here: 14.3% city: 15.1%
- Percentage of males in production occupations:
Here: 9.2% city: 7.5%
- Percentage of males in transportation occupations:
Here: 10.0% city: 5.1%
- Percentage of males in material moving occupations:
Here: 7.3% city: 4.8%
Occupations of females:
- Percentage of females in management occupations (except farmers):
Here: 5.6% city: 11.6%
- Percentage of females in business and financial operations occupations:
Here: 2.7% city: 6.9%
- Percentage of females in architecture and engineering occupations:
Here: 3.7% city: 1.8%
- Percentage of females in life, physical, and social science occupations:
Here: 1.2% city: 0.8%
- Percentage of females in education, training, and library occupations:
Here: 12.3% city: 11.2%
- Percentage of females in healthcare practitioners and technical occupations:
Here: 9.4% city: 6.8%
- Percentage of females in service occupations:
Here: 14.2% city: 16.8%
- Percentage of females in sales and office occupations:
Here: 44.8% city: 33.2%
- Percentage of females in production occupations:
Here: 6.1% city: 2.0%
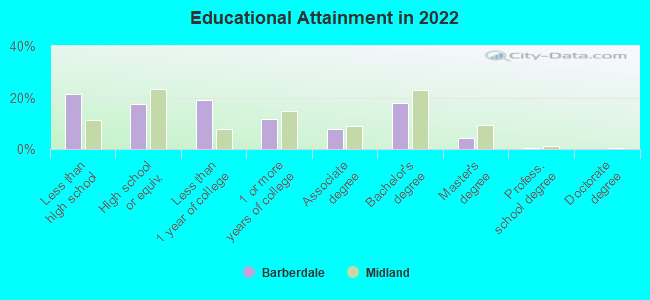
Education in this neighborhood (subdivision or community):
- Percentage of people 3 years and older in K-12 schools:
Barberdale: 22.3% Midland: 22.4%
- Percentage of people 3 years and older in undergraduate colleges:
Barberdale: 1.2% Midland: 3.0%
- Percentage of people 3 years and older in grad. or professional schools:
Barberdale: 0.0% Midland: 1.8%
- Percentage of students K-12 enrolled in private schools:
Barberdale: 0.0% Midland: 16.2%
Percentage of population below poverty level:
| Barberdale: | 13.8% |
| Midland: | 11.7% |
Median year owner moved in (as recorded in 2022):
Median year renter moved in (as recorded in 2022):
| Barberdale: | 2009 |
| Midland: | 2015 |
Median year renter moved in (as recorded in 2022):
| Barberdale: | 2018 |
| Midland: | 2022 |
Percentage of married-couple families with both working:
| Barberdale: | 50.7% |
| Midland: | 63.2% |
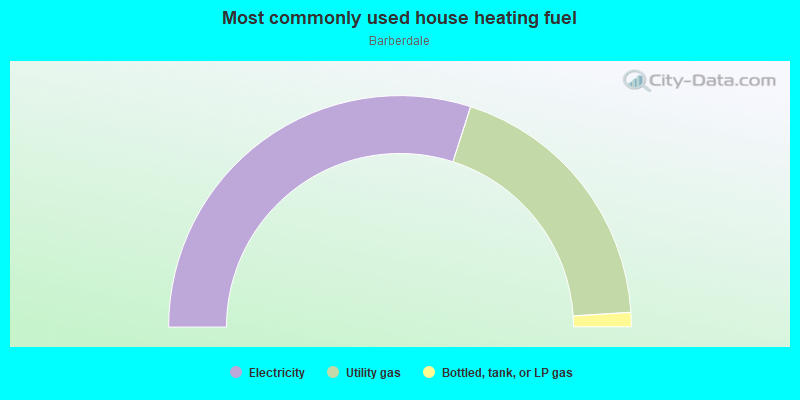
- 59.9%Electricity
- 38.1%Utility gas
- 2.0%Bottled, tank, or LP gas
Roads and streets:
E Shandon Ave
Length: 0.27 miles
Direction: E-W
Address range: 100 to 399
Direction: E-W
Address range: 100 to 399
E Dormard Ave
Length: 0.27 miles
Direction: E-W
Address range: 100 to 399
Direction: E-W
Address range: 100 to 399
E Dengar Ave
Length: 0.15 miles
Direction: E-W
Address range: 100 to 299
Direction: E-W
Address range: 100 to 299
N Main St
Length: 0.15 miles
Direction: N-S
Address range: 3000 to 3199
Direction: N-S
Address range: 3000 to 3199
Barber St
Length: 0.14 miles
Direction: N-S
Address range: 3000 to 3199
Direction: N-S
Address range: 3000 to 3199
N Edwards St
Length: 0.14 miles
Direction: N-S
Address range: 3000 to 3109
Direction: N-S
Address range: 3000 to 3109