Bart (Bart Station Area) neighborhood in Daly City, California (CA), 94014, 94015 detailed profile
Settings
X


Business Search - 14 Million verified businesses
Area: 0.220 square miles
Population: 1,743
Population density:
| Bart (Bart Station Area): | 7,929 people per square mile |
| Daly City: | 13,224 people per square mile |

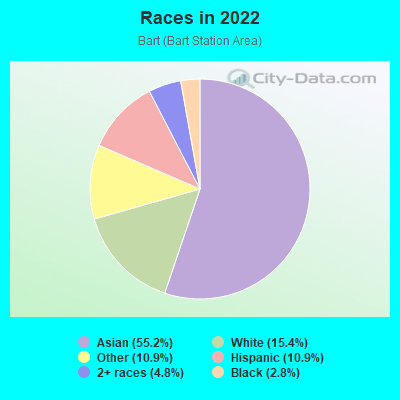
- 1,05755.2%Asian
- 29515.4%White
- 20910.9%Some other race
- 20810.9%Hispanic or Latino
- 924.8%Two or more races
- 542.8%Black

Median household income in 2022:
| Bart (Bart Station Area): | $112,042 |
| Daly City: | $109,227 |
Distribution of median household income
![Distribution of median household income]()
- 19Less than $10,000
- 40$10,000 to $19,999
- 41$20,000 to $29,999
- 14$30,000 to $39,999
- 14$40,000 to $49,999
- 64$50,000 to $59,999
- 60$60,000 to $74,999
- 51$75,000 to $99,999
- 45$100,000 to $124,999
- 70$125,000 to $149,999
- 98$150,000 to $199,999
- 99$200,000 or more

Distribution of owner-occupied house/condo value
![Distribution of owner-occupied house/condo value]()
- 2Less than $50,000
- 7$50,000 to $99,999
- 15$100,000 to $149,999
- 3$150,000 to $199,999
- 1$200,000 to $249,999
- 4$250,000 to $299,999
- 6$300,000 to $399,999
- 20$400,000 to $499,999
- 23$500,000 to $749,999
- 63$750,000 to $999,999
- 252$1,000,000 or more

Distribution of rent paid by renters
![Distribution of rent paid by renters]()
- 2$200 to $299
- 93$800 to $899
- 5$900 to $999
- 15$1,000 to $1,249
- 12$1,250 to $1,499
- 31$1,500 to $1,999
- 220$2,000 or more

Median rent in 2022:
| Bart (Bart Station Area): | $2,430 |
| Daly City: | $2,001 |
| Males: | 826 |
| Females: | 917 |
Males:
| This neighborhood: | 43.0 years |
| Whole city: | 40.9 years |
| This neighborhood: | 39.4 years |
| Whole city: | 44.8 years |
Average household size:
| Bart (Bart Station Area): | 3.0 people |
| Daly City: | 3.1 people |
Percentage of family households:
| Bart (Bart Station Area): | 45.5% |
| Daly City: | 40.3% |
| Here: | 57.2% |
| Daly City: | 50.3% |
Percentage of married-couple families with children (among all households):
| Bart (Bart Station Area): | 31.3% |
| Daly City: | 23.9% |
Percentage of single-mother households (among all households):
| Bart (Bart Station Area): | 1.4% |
| Daly City: | 5.7% |
Percentage of never married males 15 years old and over:
Percentage of never married females 15 years old and over:
| Bart (Bart Station Area): | 15.6% |
| Daly City: | 22.6% |
Percentage of never married females 15 years old and over:
| Bart (Bart Station Area): | 20.4% |
| city: | 17.9% |
Percentage of people that speak English not well or not at all:
| Bart (Bart Station Area): | 5.9% |
| Daly City: | 11.2% |
Percentage of people born in this state:
Percentage of people born in another U.S. state:
Percentage of native residents but born outside the U.S.:
Percentage of foreign born residents:
| Here: | 40.0% |
| Daly City: | 41.1% |
Percentage of people born in another U.S. state:
| Bart (Bart Station Area): | 6.7% |
| Daly City: | 5.1% |
Percentage of native residents but born outside the U.S.:
| Here: | 2.3% |
| city: | 1.8% |
Percentage of foreign born residents:
| Here: | 51.0% |
| Daly City: | 52.0% |
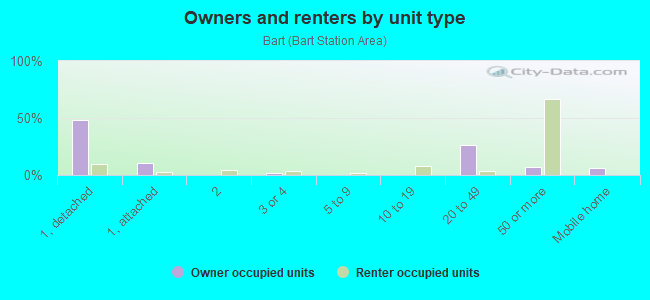
Owner-occupied
Renter-occupied

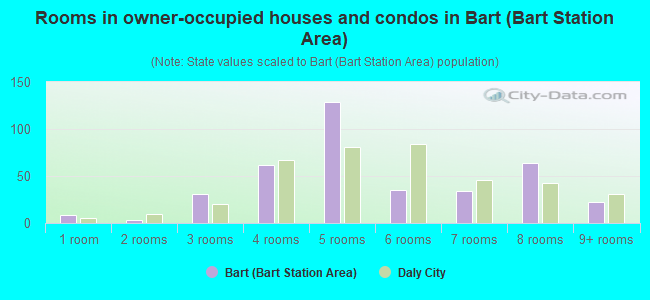
- Rooms in owner-occupied houses and condos in Bart <
> - 81 room
- 32 rooms
- 313 rooms
- 624 rooms
- 1295 rooms
- 356 rooms
- 347 rooms
- 648 rooms
- 229+ rooms
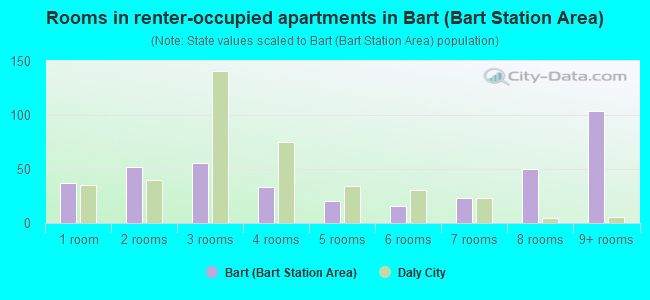
- Rooms in renter-occupied apartments in Bart <
> - 371 room
- 522 rooms
- 563 rooms
- 334 rooms
- 205 rooms
- 166 rooms
- 237 rooms
- 508 rooms
- 1049+ rooms
Owner-occupied
Renter-occupied
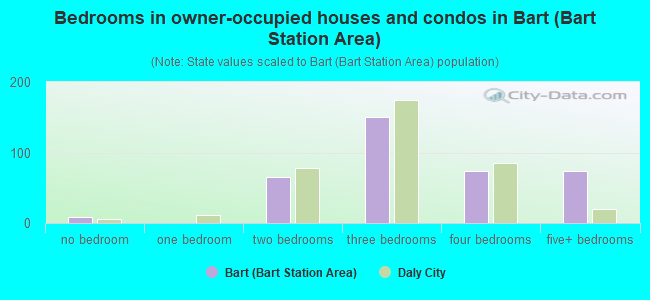
- Bedrooms in owner-occupied houses and condos in Bart <
> - 8no bedroom
- 01 bedroom
- 652 bedrooms
- 1513 bedrooms
- 744 bedrooms
- 745+ bedrooms
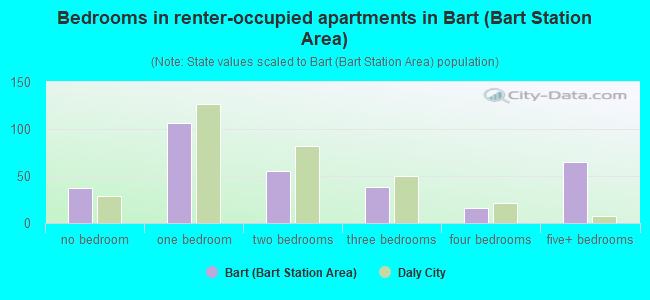
- Bedrooms in renter-occupied apartments in Bart <
> - 37no bedroom
- 1061 bedroom
- 552 bedrooms
- 383 bedrooms
- 164 bedrooms
- 655+ bedrooms
Average number of cars or other vehicles available in houses/condos:
Average number of cars or other vehicles available in apartments:
| This neighborhood: | 2.3 |
| Daly City: | 2.1 |
Average number of cars or other vehicles available in apartments:
| Here: | 1.9 |
| city: | 1.6 |
Percentage of units with a mortgage:
| Bart (Bart Station Area): | 64.9% |
| Daly City: | 61.0% |
Average estimated value of detached houses in 2022 (57.1% of all units):
| Bart (Bart Station Area): | $1,088,413 |
| California: | $988,808 |
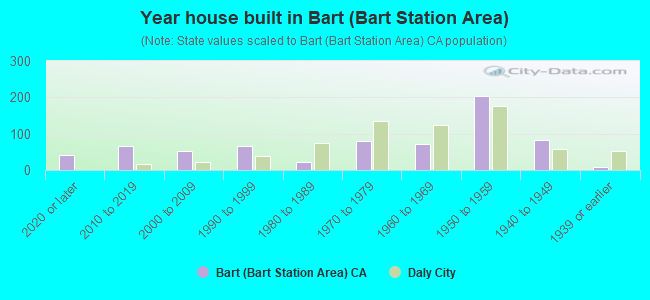
- Year house built in Bart <
> - 422020 or later
- 672010 to 2019
- 522000 to 2009
- 651990 to 1999
- 221980 to 1989
- 791970 to 1979
- 711960 to 1969
- 2051950 to 1959
- 831940 to 1949
- 81939 or earlier
City-data.com crime index for city in 2020 (higher means more crime):
| City: | 129.4 |
| U.S. average: | 219.5 |
Travel time to work (commute)
![Travel time to work (commute)]()
- 1Less than 5 minutes
- 555 to 9 minutes
- 7510 to 14 minutes
- 11415 to 19 minutes
- 6520 to 24 minutes
- 1925 to 29 minutes
- 10330 to 34 minutes
- 1335 to 39 minutes
- 1740 to 44 minutes
- 5345 to 59 minutes
- 3760 to 89 minutes
- 1990 or more minutes

Means of transportation to work
![Means of transportation to work]()
- 62.1%540Drove a car alone
- 8.0%70Carpooled
- 2.4%21Bus
- 6.0%52Subway or elevated rail
- 3.2%28Long-distance train or commuter rail
- 1.3%11Taxi
- 1.6%14Walked
- 3.0%26Other means
- 16.2%141Worked at home

Time leaving home to go to work
![Time leaving home to go to work]()
- 4012:00 a.m. to 4:59 a.m.
- 225:00 a.m. to 5:29 a.m.
- 125:30 a.m. to 5:59 a.m.
- 296:00 a.m. to 6:29 a.m.
- 546:30 a.m. to 6:59 a.m.
- 697:00 a.m. to 7:29 a.m.
- 637:30 a.m. to 7:59 a.m.
- 588:00 a.m. to 8:29 a.m.
- 88:30 a.m. to 8:59 a.m.
- 569:00 a.m. to 9:59 a.m.
- 3410:00 a.m. to 10:59 a.m.
- 1311:00 a.m. to 11:59 a.m.
- 5012:00 p.m. to 3:59 p.m.
- 534:00 p.m. to 11:59 p.m.

Occupations of males:
- Percentage of males in management occupations (except farmers):
Here: 10.0% city: 7.8%
- Percentage of males in business and financial operations occupations:
Here: 7.5% city: 4.6%
- Percentage of males in computer and mathematical occupations:
Here: 9.6% city: 5.8%
- Percentage of males in architecture and engineering occupations:
Here: 1.3% city: 2.2%
- Percentage of males in legal occupations:
Here: 1.2% city: 0.6%
- Percentage of males in education, training, and library occupations:
Here: 1.4% city: 2.2%
- Percentage of males in arts, design, entertainment, sports, and media occupations:
Here: 5.9% city: 3.3%
- Percentage of males in healthcare practitioners and technical occupations:
Here: 5.4% city: 4.3%
- Percentage of males in service occupations:
Here: 8.3% city: 17.3%
- Percentage of males in sales and office occupations:
Here: 22.7% city: 17.7%
- Percentage of males in farming, fishing, and forestry occupations:
Here: 1.9% city: 0.6%
- Percentage of males in construction, extraction, and maintenance occupations:
Here: 4.6% city: 8.6%
- Percentage of males in production occupations:
Here: 2.5% city: 4.3%
- Percentage of males in transportation occupations:
Here: 8.7% city: 9.3%
- Percentage of males in material moving occupations:
Here: 7.8% city: 4.8%
Occupations of females:
- Percentage of females in management occupations (except farmers):
Here: 9.6% city: 8.1%
- Percentage of females in business and financial operations occupations:
Here: 5.8% city: 8.4%
- Percentage of females in computer and mathematical occupations:
Here: 1.4% city: 2.0%
- Percentage of females in architecture and engineering occupations:
Here: 2.5% city: 1.4%
- Percentage of females in community and social services occupations:
Here: 1.8% city: 1.9%
- Percentage of females in education, training, and library occupations:
Here: 3.1% city: 5.1%
- Percentage of females in arts, design, entertainment, sports, and media occupations:
Here: 2.4% city: 2.0%
- Percentage of females in healthcare practitioners and technical occupations:
Here: 16.5% city: 10.8%
- Percentage of females in service occupations:
Here: 21.6% city: 25.2%
- Percentage of females in sales and office occupations:
Here: 25.3% city: 27.7%
- Percentage of females in production occupations:
Here: 5.6% city: 1.9%
- Percentage of females in material moving occupations:
Here: 4.0% city: 2.5%
Percentage of people 16-64 in Armed Forces:
| Bart (Bart Station Area): | 0.1% |
| Daly City: | 0.3% |
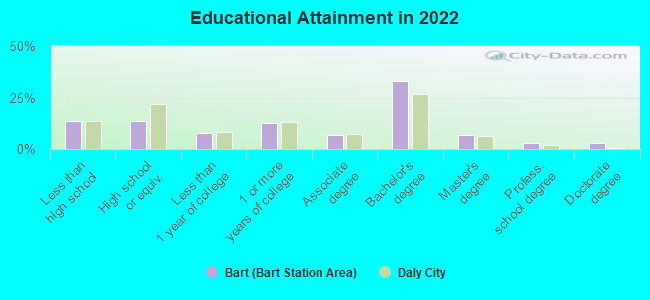
Education in this neighborhood (subdivision or community):
- Percentage of people 3 years and older in K-12 schools:
Bart (Bart Station Area): 14.1% Daly City: 11.4%
- Percentage of people 3 years and older in undergraduate colleges:
Bart (Bart Station Area): 3.7% Daly City: 6.1%
- Percentage of people 3 years and older in grad. or professional schools:
Bart (Bart Station Area): 3.7% Daly City: 2.0%
- Percentage of students K-12 enrolled in private schools:
Bart (Bart Station Area): 56.4% Daly City: 20.0%
Percentage of population below poverty level:
| Bart (Bart Station Area): | 4.4% |
| Daly City: | 11.3% |
Median year owner moved in (as recorded in 2022):
Median year renter moved in (as recorded in 2022):
| Bart (Bart Station Area): | 2001 |
| Daly City: | 2003 |
Median year renter moved in (as recorded in 2022):
| Bart (Bart Station Area): | 2015 |
| Daly City: | 2019 |
Percentage of married-couple families with both working:
| Bart (Bart Station Area): | 80.2% |
| Daly City: | 65.5% |
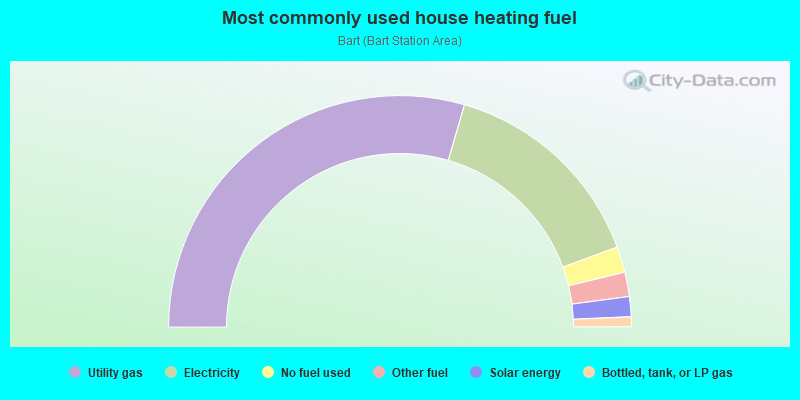
- 59.0%Utility gas
- 29.8%Electricity
- 3.6%No fuel used
- 3.4%Other fuel
- 2.8%Solar energy
- 1.4%Bottled, tank, or LP gas
Highways in this neighborhood:
el Camino Real (State Hwy 82)
Length: 0.53 miles
Directions: N-S, SE-NW, SW-NE
Address range: 7623 to 7739
Directions: N-S, SE-NW, SW-NE
Address range: 7623 to 7739
Roads and streets:
I- 280
Length: 0.92 miles
Directions: N-S, SW-NE
Directions: N-S, SW-NE
Junipero Serra Blvd
Length: 0.59 miles
Directions: N-S, SE-NW, SW-NE
Address range: 2932 to 2999
Directions: N-S, SE-NW, SW-NE
Address range: 2932 to 2999
San Pedro Rd
Length: 0.54 miles
Directions: E-W, N-S, SW-NE
Address range: 1 to 399
Directions: E-W, N-S, SW-NE
Address range: 1 to 399
B St
Length: 0.39 miles
Directions: E-W, N-S
Address range: 100 to 399
Directions: E-W, N-S
Address range: 100 to 399
Hill St
Length: 0.36 miles
Directions: N-S, SE-NW
Address range: 1 to 599
Directions: N-S, SE-NW
Address range: 1 to 599
Reiner St
Length: 0.32 miles
Direction: N-S
Address range: 2 to 299
Direction: N-S
Address range: 2 to 299
Albert M Teglia Blvd
Length: 0.31 miles
Direction: E-W
Address range: 102 to 299
Direction: E-W
Address range: 102 to 299
W Market St
Length: 0.27 miles
Directions: E-W, SE-NW
Address range: 1 to 199
Directions: E-W, SE-NW
Address range: 1 to 199
Washington St
Length: 0.20 miles
Directions: E-W, SE-NW
Address range: 1 to 199
Directions: E-W, SE-NW
Address range: 1 to 199
A St
Length: 0.20 miles
Direction: E-W
Address range: 200 to 399
Direction: E-W
Address range: 200 to 399
F St
Length: 0.18 miles
Directions: E-W, SE-NW
Directions: E-W, SE-NW
Allemany St
Length: 0.10 miles
Directions: N-S, SE-NW
Address range: 1 to 99
Directions: N-S, SE-NW
Address range: 1 to 99
Amelia M Teglia Blvd
Length: 0.06 miles
Direction: SE-NW
Address range: 1 to 6
Direction: SE-NW
Address range: 1 to 6
Dunks St
Length: 0.06 miles
Directions: N-S, SE-NW, SW-NE
Address range: 1 to 99
Directions: N-S, SE-NW, SW-NE
Address range: 1 to 99
Valley St
Length: 0.03 miles
Direction: E-W
Address range: 1 to 26
Direction: E-W
Address range: 1 to 26
State Hwy 1
Length: 0.02 miles
Direction: N-S
Direction: N-S
Railroad features:
Bart
Length: 2.54 miles
Directions: E-W, N-S, SE-NW
Directions: E-W, N-S, SE-NW
Bay Area Rapid Transit RR
Length: 0.43 miles
Directions: E-W, N-S, SE-NW
Directions: E-W, N-S, SE-NW
Union Pacific RR
Length: 0.17 miles
Directions: N-S, SE-NW
Directions: N-S, SE-NW