Bavington Court neighborhood in Las Vegas, Nevada (NV), 89108 detailed profile
Settings
X

Business Search - 14 Million verified businesses
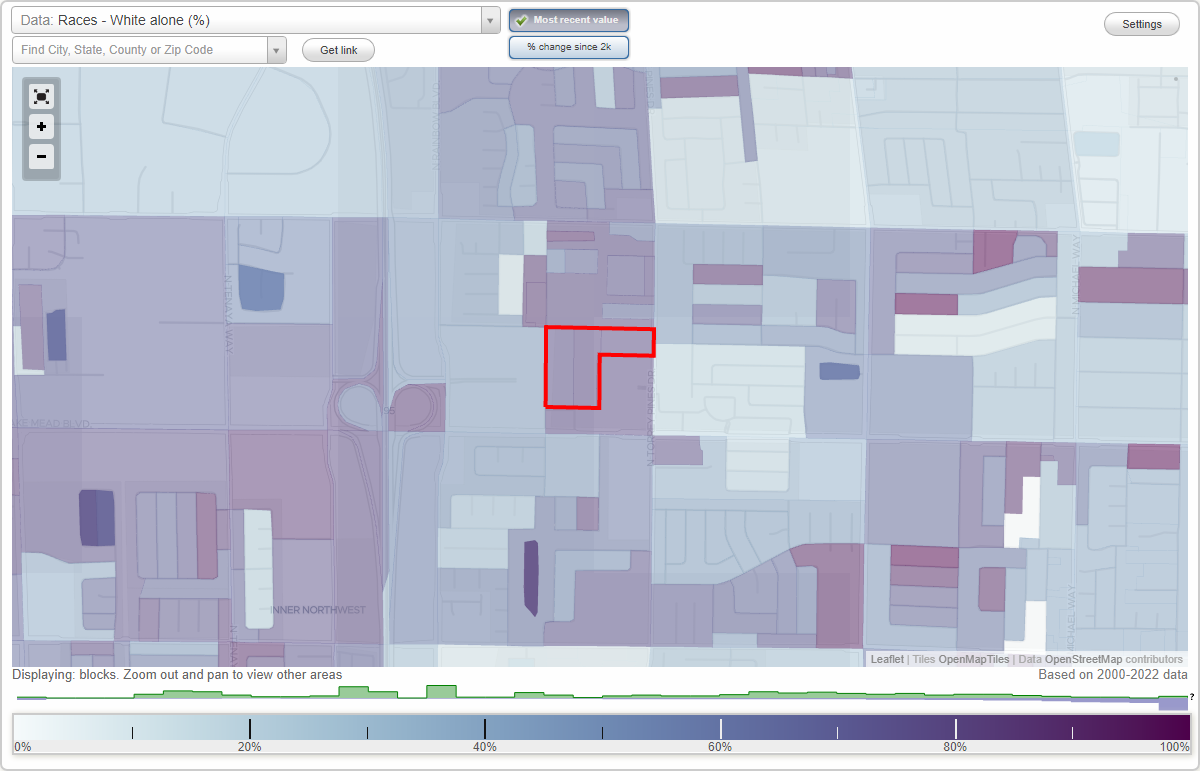
Area: 0.033 square miles
Population: 318
Population density:
| Bavington Court: | 9,691 people per square mile |
| Las Vegas: | 5,792 people per square mile |

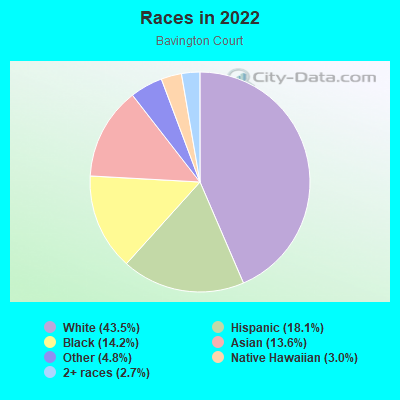
- 14443.5%White
- 6018.1%Hispanic or Latino
- 4714.2%Black
- 4513.6%Asian
- 164.8%Some other race
- 103.0%Native Hawaiian and Other
Pacific Islander - 92.7%Two or more races
Median household income in 2022:
| Bavington Court: | $52,749 |
| Las Vegas: | $68,905 |
Distribution of median household income
![Distribution of median household income]()
- 38Less than $10,000
- 16$10,000 to $19,999
- 19$20,000 to $29,999
- 14$30,000 to $39,999
- 15$40,000 to $49,999
- 19$50,000 to $59,999
- 20$60,000 to $74,999
- 5$75,000 to $99,999
- 24$100,000 to $124,999
- 10$125,000 to $149,999
- 5$150,000 to $199,999
- 4$200,000 or more

Distribution of owner-occupied house/condo value
![Distribution of owner-occupied house/condo value]()
- 24Less than $50,000
- 28$50,000 to $99,999
- 24$100,000 to $149,999
- 13$150,000 to $199,999
- 12$200,000 to $249,999
- 9$250,000 to $299,999
- 12$300,000 to $399,999
- 9$400,000 to $499,999

Distribution of rent paid by renters
![Distribution of rent paid by renters]()
- 4$700 to $799
- 4$800 to $899
- 50$1,000 to $1,249
- 10$1,250 to $1,499
- 2$1,500 to $1,999

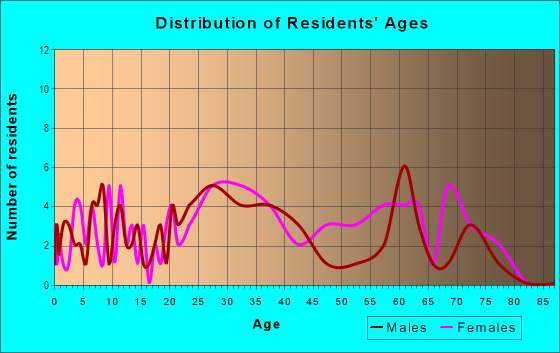
| Males: | 165 |
| Females: | 152 |
Males:
| This neighborhood: | 55.9 years |
| Whole city: | 38.4 years |
| This neighborhood: | 47.8 years |
| Whole city: | 38.9 years |
Average household size:
| Bavington Court: | 2.1 people |
| Las Vegas: | 2.7 people |
Percentage of family households:
| Bavington Court: | 39.8% |
| Las Vegas: | 45.8% |
| Here: | 30.4% |
| Las Vegas: | 40.9% |
Percentage of married-couple families with children (among all households):
| Bavington Court: | 73.0% |
| Las Vegas: | 23.4% |
Percentage of single-mother households (among all households):
| Bavington Court: | 54.7% |
| Las Vegas: | 10.1% |
Percentage of never married males 15 years old and over:
Percentage of never married females 15 years old and over:
| Bavington Court: | 20.8% |
| Las Vegas: | 19.7% |
Percentage of never married females 15 years old and over:
| Bavington Court: | 7.7% |
| city: | 17.0% |
Percentage of people that speak English not well or not at all:
| Bavington Court: | 13.1% |
| Las Vegas: | 7.0% |
Percentage of people born in this state:
Percentage of people born in another U.S. state:
Percentage of native residents but born outside the U.S.:
Percentage of foreign born residents:
| Here: | 20.9% |
| Las Vegas: | 27.3% |
Percentage of people born in another U.S. state:
| Bavington Court: | 50.0% |
| Las Vegas: | 49.8% |
Percentage of native residents but born outside the U.S.:
| Here: | 2.3% |
| city: | 1.9% |
Percentage of foreign born residents:
| Here: | 26.7% |
| Las Vegas: | 21.0% |
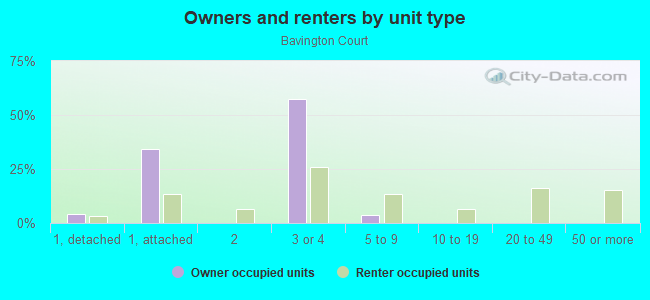
Owner-occupied
Renter-occupied

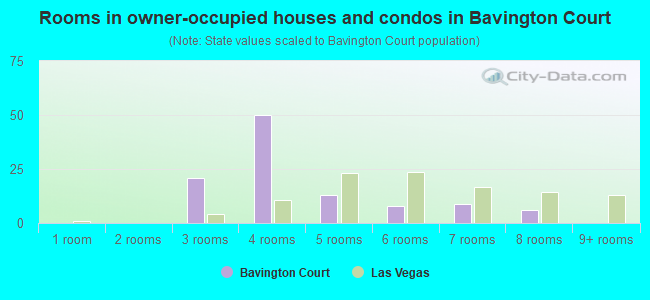
- Rooms in owner-occupied houses and condos in Bavington Court
- 01 room
- 02 rooms
- 213 rooms
- 504 rooms
- 135 rooms
- 86 rooms
- 97 rooms
- 68 rooms
- 09+ rooms
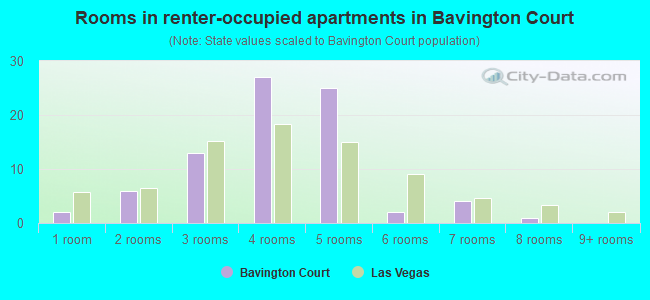
- Rooms in renter-occupied apartments in Bavington Court
- 21 room
- 62 rooms
- 133 rooms
- 274 rooms
- 255 rooms
- 26 rooms
- 47 rooms
- 18 rooms
- 09+ rooms
Owner-occupied
Renter-occupied
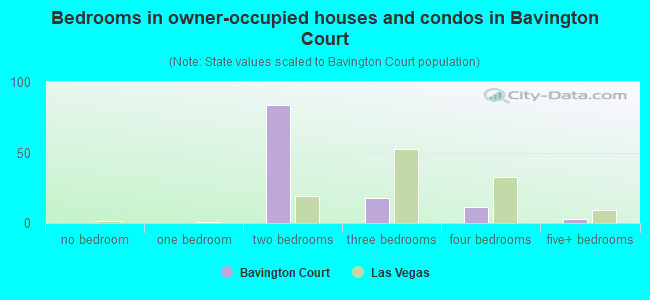
- Bedrooms in owner-occupied houses and condos in Bavington Court
- 0no bedroom
- 01 bedroom
- 842 bedrooms
- 183 bedrooms
- 114 bedrooms
- 35+ bedrooms
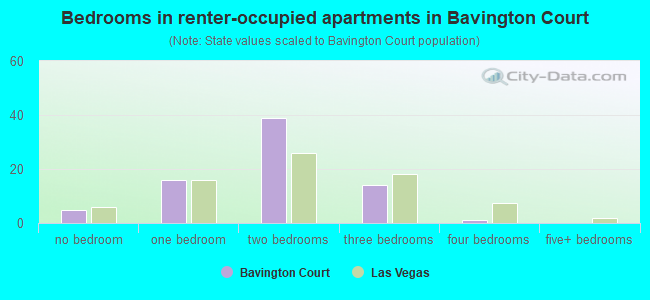
- Bedrooms in renter-occupied apartments in Bavington Court
- 5no bedroom
- 161 bedroom
- 392 bedrooms
- 143 bedrooms
- 14 bedrooms
- 05+ bedrooms
Average number of cars or other vehicles available in houses/condos:
Average number of cars or other vehicles available in apartments:
| This neighborhood: | 1.1 |
| Las Vegas: | 2.0 |
Average number of cars or other vehicles available in apartments:
| Here: | 1.6 |
| city: | 1.3 |
Percentage of units with a mortgage:
| Bavington Court: | 40.1% |
| Las Vegas: | 69.3% |
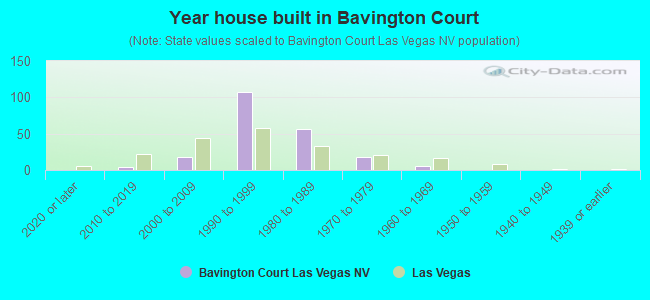
- Year house built in Bavington Court
- 02020 or later
- 42010 to 2019
- 182000 to 2009
- 1071990 to 1999
- 561980 to 1989
- 181970 to 1979
- 51960 to 1969
- 01950 to 1959
- 01940 to 1949
- 01939 or earlier
City-data.com crime index for city in 2020 (higher means more crime):
| City: | 280.7 |
| U.S. average: | 219.5 |
Travel time to work (commute)
![Travel time to work (commute)]()
- 3Less than 5 minutes
- 75 to 9 minutes
- 2310 to 14 minutes
- 3315 to 19 minutes
- 4920 to 24 minutes
- 1525 to 29 minutes
- 2930 to 34 minutes
- 335 to 39 minutes
- 940 to 44 minutes
- 445 to 59 minutes
- 960 to 89 minutes
- 390 or more minutes

Means of transportation to work
![Means of transportation to work]()
- 73.7%124Drove a car alone
- 16.6%28Carpooled
- 1.2%2Bus
- 8.3%14Other means
- 3.6%6Worked at home

Time leaving home to go to work
![Time leaving home to go to work]()
- 1112:00 a.m. to 4:59 a.m.
- 115:00 a.m. to 5:29 a.m.
- 105:30 a.m. to 5:59 a.m.
- 216:00 a.m. to 6:29 a.m.
- 266:30 a.m. to 6:59 a.m.
- 247:00 a.m. to 7:29 a.m.
- 67:30 a.m. to 7:59 a.m.
- 48:00 a.m. to 8:29 a.m.
- 98:30 a.m. to 8:59 a.m.
- 209:00 a.m. to 9:59 a.m.
- 1810:00 a.m. to 10:59 a.m.
- 111:00 a.m. to 11:59 a.m.
- 1712:00 p.m. to 3:59 p.m.
- 144:00 p.m. to 11:59 p.m.

Occupations of males:
- Percentage of males in business and financial operations occupations:
Here: 9.7% city: 3.6%
- Percentage of males in arts, design, entertainment, sports, and media occupations:
Here: 13.6% city: 2.5%
- Percentage of males in service occupations:
Here: 39.4% city: 23.3%
- Percentage of males in sales and office occupations:
Here: 31.7% city: 16.6%
- Percentage of males in construction, extraction, and maintenance occupations:
Here: 16.6% city: 10.6%
- Percentage of males in transportation occupations:
Here: 5.5% city: 6.6%
- Percentage of males in material moving occupations:
Here: 11.2% city: 5.4%
Occupations of females:
- Percentage of females in management occupations (except farmers):
Here: 6.3% city: 8.5%
- Percentage of females in community and social services occupations:
Here: 10.9% city: 1.9%
- Percentage of females in legal occupations:
Here: 5.2% city: 1.5%
- Percentage of females in education, training, and library occupations:
Here: 10.1% city: 8.0%
- Percentage of females in service occupations:
Here: 23.6% city: 26.5%
- Percentage of females in sales and office occupations:
Here: 39.8% city: 30.5%
- Percentage of females in production occupations:
Here: 4.0% city: 1.8%
Percentage of people 16-64 in Armed Forces:
| Bavington Court: | 0.5% |
| Las Vegas: | 1.0% |
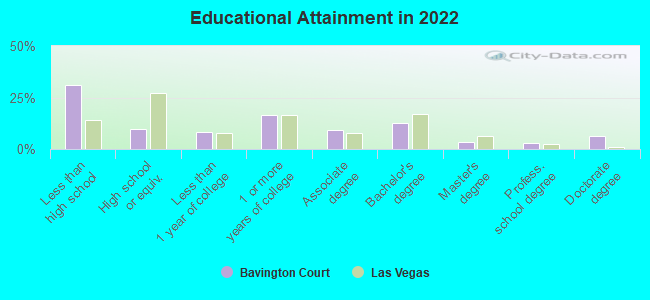
Education in this neighborhood (subdivision or community):
- Percentage of people 3 years and older in K-12 schools:
Bavington Court: 12.5% Las Vegas: 17.4%
- Percentage of people 3 years and older in undergraduate colleges:
Bavington Court: 5.4% Las Vegas: 4.2%
- Percentage of people 3 years and older in grad. or professional schools:
Bavington Court: 7.4% Las Vegas: 1.0%
- Percentage of students K-12 enrolled in private schools:
Bavington Court: 5.1% Las Vegas: 12.9%
Percentage of population below poverty level:
| Bavington Court: | 17.8% |
| Las Vegas: | 14.1% |
Median year owner moved in (as recorded in 2022):
| Bavington Court: | 2010 |
| Las Vegas: | 2015 |
Percentage of married-couple families with both working:
| Bavington Court: | 115.9% |
| Las Vegas: | 62.0% |
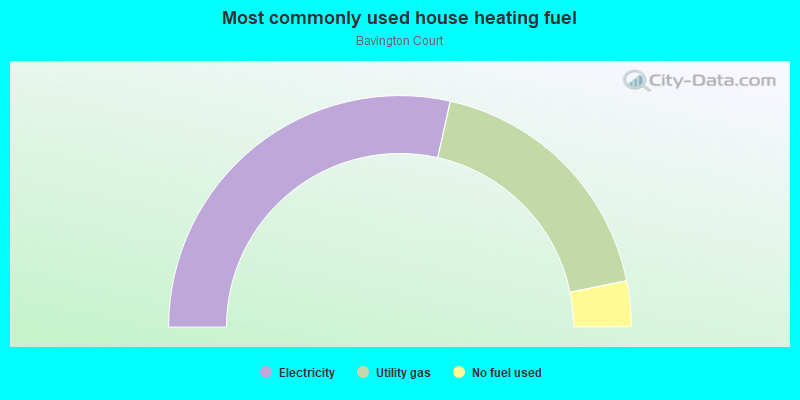
- 57.0%Electricity
- 36.6%Utility gas
- 6.4%No fuel used
Roads and streets:
Bavington Dr
Length: 0.18 miles
Direction: N-S
Address range: 2000 to 2199
Direction: N-S
Address range: 2000 to 2199
Brookhurst Ln
Length: 0.13 miles
Direction: E-W
Address range: 6500 to 6589
Direction: E-W
Address range: 6500 to 6589
Twickenham Pl
Length: 0.05 miles
Direction: N-S
Address range: 2100 to 2199
Direction: N-S
Address range: 2100 to 2199
Twickenham
Length: 0.02 miles
Direction: E-W
Direction: E-W