Bay Islands neighborhood in San Rafael, California (CA), detailed profile
Settings
X


Business Search - 14 Million verified businesses
Area: 1.792 square miles
Population: 327
Population density:
| Bay Islands: | 183 people per square mile |
| San Rafael: | 3,670 people per square mile |

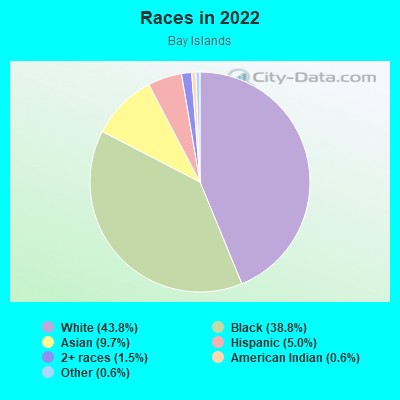
- 23543.8%White
- 20838.8%Black
- 529.7%Asian
- 275.0%Hispanic or Latino
- 81.5%Two or more races
- 30.6%American Indian
- 30.6%Some other race
Median household income in 2022:
| Bay Islands: | $181,666 |
| San Rafael: | $113,839 |
Distribution of median household income
![Distribution of median household income]()
- 124Less than $10,000
- 5$10,000 to $19,999
- 7$20,000 to $29,999
- 37$30,000 to $39,999
- 7$40,000 to $49,999
- 5$50,000 to $59,999
- 5$60,000 to $74,999
- 8$75,000 to $99,999
- 14$100,000 to $124,999
- 98$125,000 to $149,999
- 32$150,000 to $199,999
- 56$200,000 or more

Distribution of owner-occupied house/condo value
![Distribution of owner-occupied house/condo value]()
- 32Less than $50,000
- 2$100,000 to $149,999
- 5$150,000 to $199,999
- 4$200,000 to $249,999
- 15$300,000 to $399,999
- 6$400,000 to $499,999
- 9$500,000 to $749,999
- 5$750,000 to $999,999
- 107$1,000,000 or more

Distribution of rent paid by renters
![Distribution of rent paid by renters]()
- 17$300 to $399
- 4$400 to $499
- 9$1,250 to $1,499
- 251$1,500 to $1,999
- 472$2,000 or more

| Males: | 149 |
| Females: | 178 |
Males:
| This neighborhood: | 53.6 years |
| Whole city: | 40.6 years |
| This neighborhood: | 62.3 years |
| Whole city: | 47.6 years |
Average household size:
| Bay Islands: | 15.0 people |
| San Rafael: | 2.5 people |
Percentage of family households:
| Bay Islands: | 34.4% |
| San Rafael: | 41.8% |
| Here: | 80.9% |
| San Rafael: | 46.3% |
Percentage of married-couple families with children (among all households):
| Bay Islands: | 40.9% |
| San Rafael: | 30.4% |
Percentage of single-mother households (among all households):
| Bay Islands: | 129.7% |
| San Rafael: | 5.4% |
Percentage of never married males 15 years old and over:
Percentage of never married females 15 years old and over:
| Bay Islands: | 179.5% |
| San Rafael: | 17.7% |
Percentage of never married females 15 years old and over:
| Bay Islands: | 4.4% |
| city: | 16.3% |
Percentage of people that speak English not well or not at all:
| Bay Islands: | 1.8% |
| San Rafael: | 10.4% |
Percentage of people born in this state:
Percentage of people born in another U.S. state:
Percentage of native residents but born outside the U.S.:
Percentage of foreign born residents:
| Here: | 55.6% |
| San Rafael: | 47.7% |
Percentage of people born in another U.S. state:
| Bay Islands: | 30.0% |
| San Rafael: | 23.8% |
Percentage of native residents but born outside the U.S.:
| Here: | 1.3% |
| city: | 1.7% |
Percentage of foreign born residents:
| Here: | 13.2% |
| San Rafael: | 26.8% |
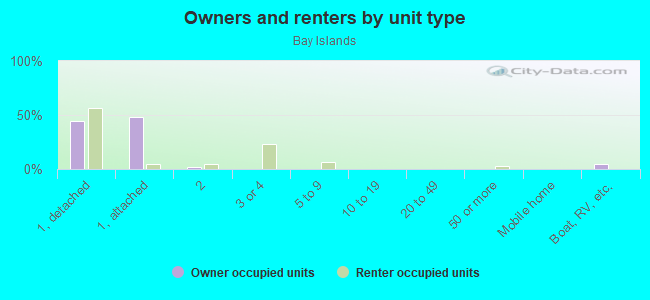
Owner-occupied
Renter-occupied

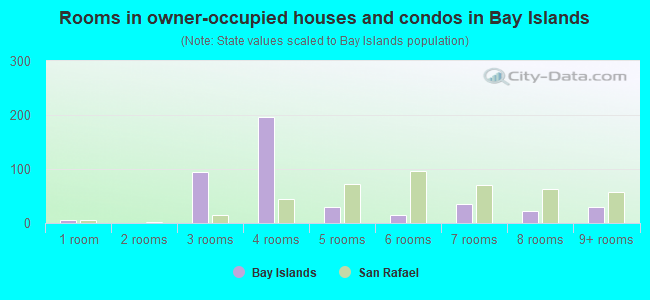
- Rooms in owner-occupied houses and condos in Bay Islands
- 61 room
- 02 rooms
- 943 rooms
- 1964 rooms
- 305 rooms
- 146 rooms
- 357 rooms
- 238 rooms
- 299+ rooms
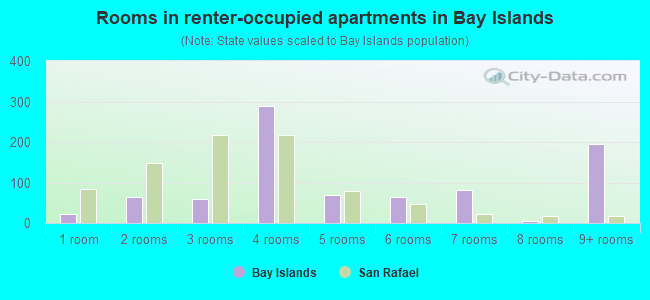
- Rooms in renter-occupied apartments in Bay Islands
- 231 room
- 642 rooms
- 603 rooms
- 2894 rooms
- 705 rooms
- 636 rooms
- 827 rooms
- 68 rooms
- 1949+ rooms
Owner-occupied
Renter-occupied
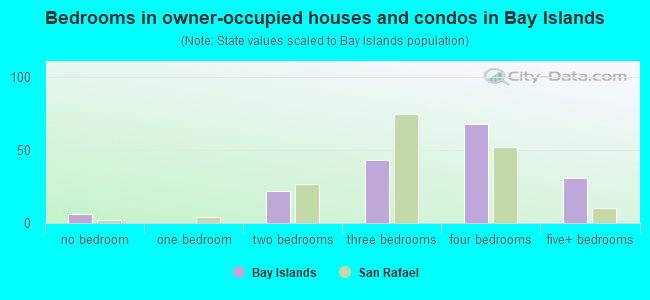
- Bedrooms in owner-occupied houses and condos in Bay Islands
- 6no bedroom
- 01 bedroom
- 222 bedrooms
- 433 bedrooms
- 684 bedrooms
- 315+ bedrooms
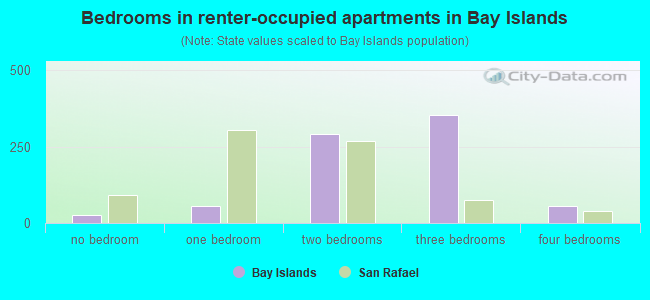
- Bedrooms in renter-occupied apartments in Bay Islands
- 26no bedroom
- 551 bedroom
- 2932 bedrooms
- 3543 bedrooms
- 554 bedrooms
- 05+ bedrooms
Average number of cars or other vehicles available in houses/condos:
Average number of cars or other vehicles available in apartments:
| This neighborhood: | 2.1 |
| San Rafael: | 2.0 |
Average number of cars or other vehicles available in apartments:
| Here: | |
| city: |
Percentage of units with a mortgage:
| Bay Islands: | 51.4% |
| San Rafael: | 66.6% |
Average estimated value of detached houses in 2022 (100.0% of all units):
| Bay Islands: | $1,450,909 |
| California: | $988,808 |
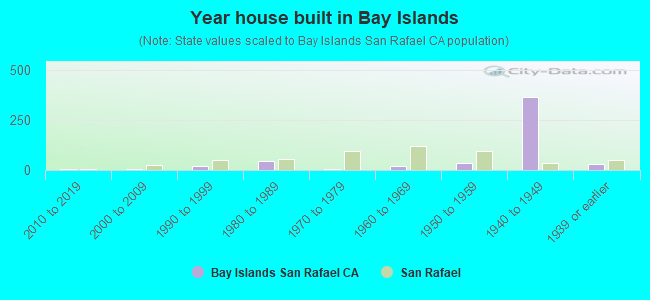
- Year house built in Bay Islands
- 02020 or later
- 42010 to 2019
- 32000 to 2009
- 221990 to 1999
- 461980 to 1989
- 51970 to 1979
- 211960 to 1969
- 361950 to 1959
- 3641940 to 1949
- 301939 or earlier
City-data.com crime index for city in 2020 (higher means more crime):
| City: | 294.6 |
| U.S. average: | 219.5 |
Travel time to work (commute)
![Travel time to work (commute)]()
- 10Less than 5 minutes
- 45 to 9 minutes
- 1610 to 14 minutes
- 3115 to 19 minutes
- 1820 to 24 minutes
- 1425 to 29 minutes
- 630 to 34 minutes
- 335 to 39 minutes
- 840 to 44 minutes
- 2245 to 59 minutes
- 1460 to 89 minutes
- 890 or more minutes

Means of transportation to work
![Means of transportation to work]()
- 49.4%64Drove a car alone
- 7.7%10Carpooled
- 166.8%216Bus
- 1.5%2Long-distance train or commuter rail
- 3.1%4Ferryboat
- 121.2%157Walked
- 2.3%3Other means
- 35.5%46Worked at home

Time leaving home to go to work
![Time leaving home to go to work]()
- 912:00 a.m. to 4:59 a.m.
- 75:00 a.m. to 5:29 a.m.
- 15:30 a.m. to 5:59 a.m.
- 136:00 a.m. to 6:29 a.m.
- 226:30 a.m. to 6:59 a.m.
- 247:00 a.m. to 7:29 a.m.
- 97:30 a.m. to 7:59 a.m.
- 148:00 a.m. to 8:29 a.m.
- 48:30 a.m. to 8:59 a.m.
- 249:00 a.m. to 9:59 a.m.
- 510:00 a.m. to 10:59 a.m.
- 811:00 a.m. to 11:59 a.m.
- 212:00 p.m. to 3:59 p.m.
- 34:00 p.m. to 11:59 p.m.

Occupations of males:
- Percentage of males in management occupations (except farmers):
Here: 34.8% city: 14.6%
- Percentage of males in architecture and engineering occupations:
Here: 9.1% city: 2.2%
- Percentage of males in education, training, and library occupations:
Here: 7.7% city: 3.9%
- Percentage of males in arts, design, entertainment, sports, and media occupations:
Here: 9.7% city: 5.0%
- Percentage of males in healthcare practitioners and technical occupations:
Here: 21.3% city: 2.9%
- Percentage of males in service occupations:
Here: 16.0% city: 14.5%
- Percentage of males in sales and office occupations:
Here: 8.2% city: 17.3%
Occupations of females:
- Percentage of females in management occupations (except farmers):
Here: 25.6% city: 13.8%
- Percentage of females in business and financial operations occupations:
Here: 6.0% city: 5.9%
- Percentage of females in architecture and engineering occupations:
Here: 12.5% city: 0.7%
- Percentage of females in arts, design, entertainment, sports, and media occupations:
Here: 42.5% city: 3.7%
- Percentage of females in healthcare practitioners and technical occupations:
Here: 5.5% city: 7.0%
- Percentage of females in sales and office occupations:
Here: 7.3% city: 25.2%
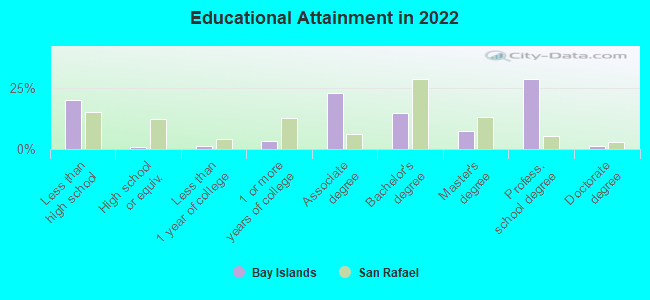
Education in this neighborhood (subdivision or community):
- Percentage of people 3 years and older in K-12 schools:
Bay Islands: 186.5% San Rafael: 15.4%
- Percentage of people 3 years and older in undergraduate colleges:
Bay Islands: 280.4% San Rafael: 6.4%
- Percentage of people 3 years and older in grad. or professional schools:
Bay Islands: 12.2% San Rafael: 1.2%
- Percentage of students K-12 enrolled in private schools:
Bay Islands: 21.1% San Rafael: 10.7%
Percentage of population below poverty level:
| Bay Islands: | 2.7% |
| San Rafael: | 8.9% |
Median year owner moved in (as recorded in 2022):
| Bay Islands: | 2003 |
| San Rafael: | 2005 |
Percentage of married-couple families with both working:
| Bay Islands: | 99.8% |
| San Rafael: | 75.7% |
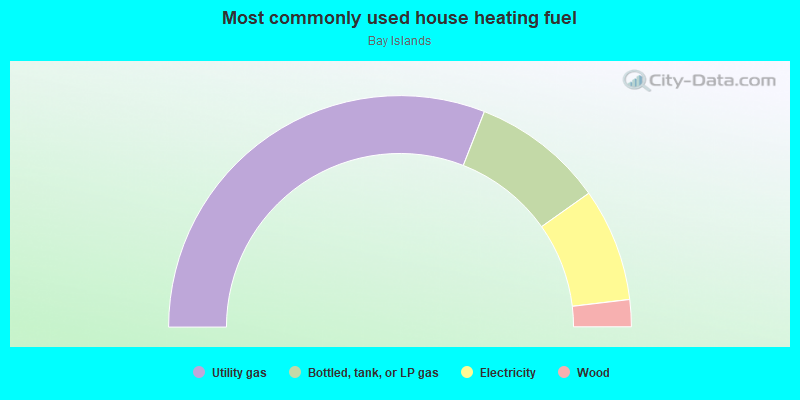
- 61.9%Utility gas
- 18.5%Bottled, tank, or LP gas
- 15.8%Electricity
- 3.8%Wood
Roads and streets:
Shoreline Path
Length: 0.05 miles
Direction: E-W
Direction: E-W