Bayfair neighborhood in San Leandro, California (CA), 94578, 94580 detailed profile
Settings
X


Business Search - 14 Million verified businesses
Area: 0.244 square miles
Population: 1,926
Population density:
| Bayfair: | 7,895 people per square mile |
| San Leandro: | 6,610 people per square mile |

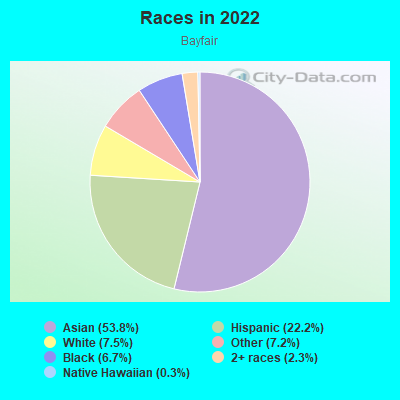
- 1,11353.8%Asian
- 45922.2%Hispanic or Latino
- 1567.5%White
- 1497.2%Some other race
- 1396.7%Black
- 482.3%Two or more races
- 60.3%Native Hawaiian and Other
Pacific Islander
Median household income in 2022:
| Bayfair: | $114,734 |
| San Leandro: | $92,651 |
Distribution of median household income
![Distribution of median household income]()
- 16Less than $10,000
- 40$10,000 to $19,999
- 33$20,000 to $29,999
- 53$30,000 to $39,999
- 66$40,000 to $49,999
- 25$50,000 to $59,999
- 39$60,000 to $74,999
- 73$75,000 to $99,999
- 33$100,000 to $124,999
- 65$125,000 to $149,999
- 65$150,000 to $199,999
- 166$200,000 or more

Distribution of owner-occupied house/condo value
![Distribution of owner-occupied house/condo value]()
- 3Less than $50,000
- 13$50,000 to $99,999
- 9$200,000 to $249,999
- 7$250,000 to $299,999
- 39$400,000 to $499,999
- 178$500,000 to $749,999
- 196$750,000 to $999,999
- 28$1,000,000 or more

Distribution of rent paid by renters
![Distribution of rent paid by renters]()
- 32$700 to $799
- 14$900 to $999
- 6$1,000 to $1,249
- 14$1,250 to $1,499
- 35$1,500 to $1,999
- 90$2,000 or more

Median rent in 2022:
| Bayfair: | $2,154 |
| San Leandro: | $1,893 |
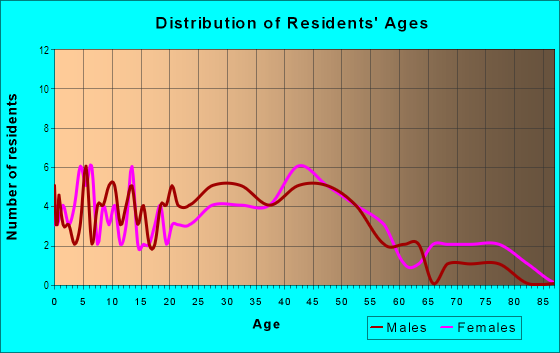
| Males: | 1,020 |
| Females: | 905 |
Males:
| This neighborhood: | 43.4 years |
| Whole city: | 40.3 years |
| This neighborhood: | 46.6 years |
| Whole city: | 45.2 years |
Average household size:
| Bayfair: | 3.2 people |
| San Leandro: | 2.9 people |
Percentage of family households:
| Bayfair: | 50.7% |
| San Leandro: | 44.4% |
| Here: | 65.1% |
| San Leandro: | 49.6% |
Percentage of married-couple families with children (among all households):
| Bayfair: | 28.5% |
| San Leandro: | 26.2% |
Percentage of single-mother households (among all households):
| Bayfair: | 1.3% |
| San Leandro: | 7.1% |
Percentage of never married males 15 years old and over:
Percentage of never married females 15 years old and over:
| Bayfair: | 16.0% |
| San Leandro: | 18.2% |
Percentage of never married females 15 years old and over:
| Bayfair: | 12.1% |
| city: | 16.0% |
Percentage of people that speak English not well or not at all:
| Bayfair: | 18.5% |
| San Leandro: | 12.0% |
Percentage of people born in this state:
Percentage of people born in another U.S. state:
Percentage of native residents but born outside the U.S.:
Percentage of foreign born residents:
| Here: | 45.2% |
| San Leandro: | 44.1% |
Percentage of people born in another U.S. state:
| Bayfair: | 6.5% |
| San Leandro: | 9.8% |
Percentage of native residents but born outside the U.S.:
| Here: | 2.0% |
| city: | 1.7% |
Percentage of foreign born residents:
| Here: | 46.4% |
| San Leandro: | 44.4% |
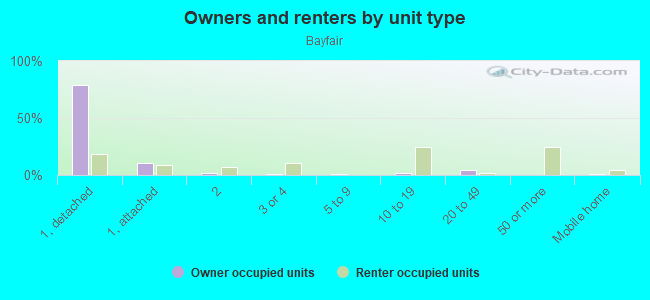
Owner-occupied
Renter-occupied

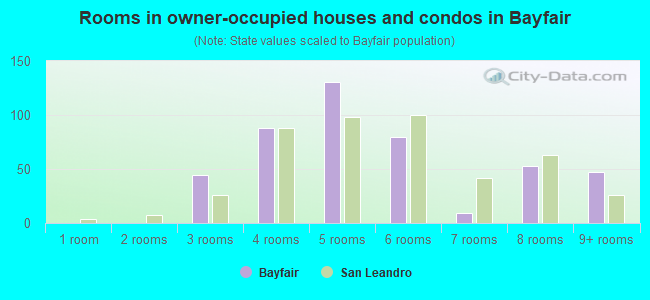
- Rooms in owner-occupied houses and condos in Bayfair
- 01 room
- 02 rooms
- 443 rooms
- 884 rooms
- 1315 rooms
- 806 rooms
- 97 rooms
- 538 rooms
- 479+ rooms
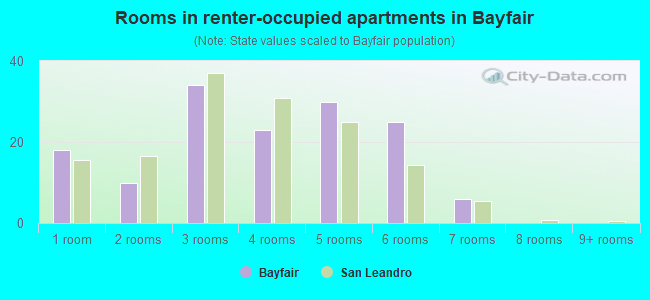
- Rooms in renter-occupied apartments in Bayfair
- 181 room
- 102 rooms
- 343 rooms
- 234 rooms
- 305 rooms
- 256 rooms
- 67 rooms
- 08 rooms
- 09+ rooms
Owner-occupied
Renter-occupied

- Bedrooms in owner-occupied houses and condos in Bayfair
- 0no bedroom
- 151 bedroom
- 1502 bedrooms
- 1643 bedrooms
- 1074 bedrooms
- 325+ bedrooms
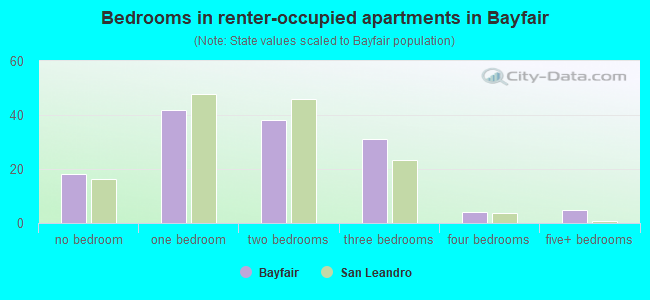
- Bedrooms in renter-occupied apartments in Bayfair
- 18no bedroom
- 421 bedroom
- 382 bedrooms
- 313 bedrooms
- 44 bedrooms
- 55+ bedrooms
Average number of cars or other vehicles available in houses/condos:
Average number of cars or other vehicles available in apartments:
| This neighborhood: | 2.5 |
| San Leandro: | 2.2 |
Average number of cars or other vehicles available in apartments:
| Here: | 1.9 |
| city: | 1.3 |
Percentage of units with a mortgage:
| Bayfair: | 60.2% |
| San Leandro: | 63.4% |
Average estimated value of detached houses in 2022 (80.2% of all units):
| Bayfair: | $736,121 |
| California: | $988,808 |
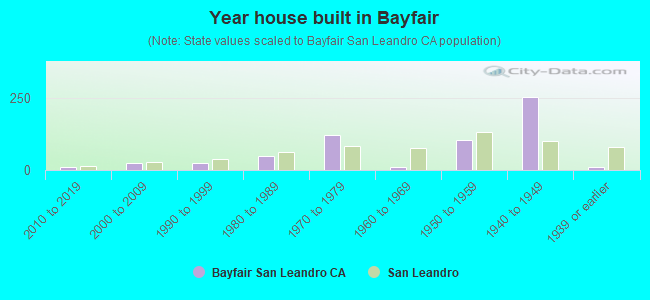
- Year house built in Bayfair
- 02020 or later
- 112010 to 2019
- 242000 to 2009
- 261990 to 1999
- 481980 to 1989
- 1231970 to 1979
- 121960 to 1969
- 1051950 to 1959
- 2521940 to 1949
- 111939 or earlier
City-data.com crime index for city in 2020 (higher means more crime):
| City: | 374.8 |
| U.S. average: | 219.5 |
Travel time to work (commute)
![Travel time to work (commute)]()
- 495 to 9 minutes
- 3910 to 14 minutes
- 9515 to 19 minutes
- 5720 to 24 minutes
- 4325 to 29 minutes
- 18630 to 34 minutes
- 3135 to 39 minutes
- 8840 to 44 minutes
- 10345 to 59 minutes
- 13360 to 89 minutes
- 10790 or more minutes

Means of transportation to work
![Means of transportation to work]()
- 69.8%683Drove a car alone
- 5.2%51Carpooled
- 9.9%97Subway or elevated rail
- 3.8%37Long-distance train or commuter rail
- 0.8%8Bicycle
- 0.7%7Walked
- 7.0%68Other means
- 4.5%44Worked at home

Time leaving home to go to work
![Time leaving home to go to work]()
- 7112:00 a.m. to 4:59 a.m.
- 375:00 a.m. to 5:29 a.m.
- 395:30 a.m. to 5:59 a.m.
- 676:00 a.m. to 6:29 a.m.
- 1606:30 a.m. to 6:59 a.m.
- 747:00 a.m. to 7:29 a.m.
- 807:30 a.m. to 7:59 a.m.
- 1178:00 a.m. to 8:29 a.m.
- 538:30 a.m. to 8:59 a.m.
- 869:00 a.m. to 9:59 a.m.
- 4610:00 a.m. to 10:59 a.m.
- 1711:00 a.m. to 11:59 a.m.
- 2112:00 p.m. to 3:59 p.m.
- 424:00 p.m. to 11:59 p.m.

Occupations of males:
- Percentage of males in management occupations (except farmers):
Here: 3.3% city: 9.9%
- Percentage of males in business and financial operations occupations:
Here: 4.4% city: 4.3%
- Percentage of males in computer and mathematical occupations:
Here: 9.1% city: 6.7%
- Percentage of males in architecture and engineering occupations:
Here: 2.0% city: 3.6%
- Percentage of males in education, training, and library occupations:
Here: 3.0% city: 3.0%
- Percentage of males in healthcare practitioners and technical occupations:
Here: 4.8% city: 2.2%
- Percentage of males in service occupations:
Here: 7.2% city: 14.6%
- Percentage of males in sales and office occupations:
Here: 16.3% city: 14.8%
- Percentage of males in construction, extraction, and maintenance occupations:
Here: 15.2% city: 10.0%
- Percentage of males in production occupations:
Here: 6.0% city: 7.8%
- Percentage of males in transportation occupations:
Here: 10.4% city: 7.3%
- Percentage of males in material moving occupations:
Here: 7.7% city: 6.8%
Occupations of females:
- Percentage of females in management occupations (except farmers):
Here: 5.7% city: 9.2%
- Percentage of females in business and financial operations occupations:
Here: 11.3% city: 7.3%
- Percentage of females in computer and mathematical occupations:
Here: 4.1% city: 2.3%
- Percentage of females in architecture and engineering occupations:
Here: 1.9% city: 0.9%
- Percentage of females in life, physical, and social science occupations:
Here: 3.1% city: 1.4%
- Percentage of females in community and social services occupations:
Here: 3.9% city: 1.8%
- Percentage of females in education, training, and library occupations:
Here: 3.5% city: 6.9%
- Percentage of females in arts, design, entertainment, sports, and media occupations:
Here: 1.9% city: 2.2%
- Percentage of females in healthcare practitioners and technical occupations:
Here: 14.4% city: 6.5%
- Percentage of females in service occupations:
Here: 32.5% city: 23.3%
- Percentage of females in sales and office occupations:
Here: 13.9% city: 26.6%
- Percentage of females in production occupations:
Here: 2.1% city: 5.3%
- Percentage of females in material moving occupations:
Here: 1.6% city: 3.5%
Percentage of people 16-64 in Armed Forces:
| Bayfair: | 0.7% |
| San Leandro: | 0.1% |
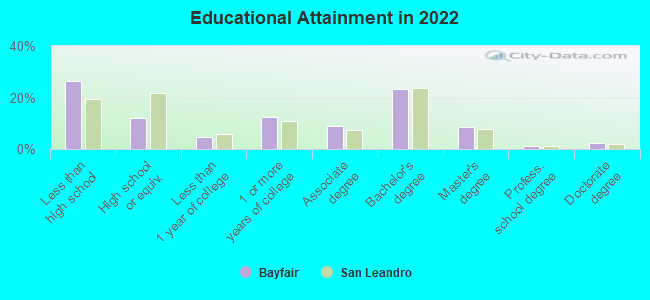
Education in this neighborhood (subdivision or community):
- Percentage of people 3 years and older in K-12 schools:
Bayfair: 19.0% San Leandro: 14.4%
- Percentage of people 3 years and older in undergraduate colleges:
Bayfair: 3.2% San Leandro: 5.5%
- Percentage of people 3 years and older in grad. or professional schools:
Bayfair: 3.0% San Leandro: 1.6%
- Percentage of students K-12 enrolled in private schools:
Bayfair: 48.0% San Leandro: 9.9%
Percentage of population below poverty level:
| Bayfair: | 3.0% |
| San Leandro: | 7.4% |
Median year owner moved in (as recorded in 2022):
Median year renter moved in (as recorded in 2022):
| Bayfair: | 2006 |
| San Leandro: | 2006 |
Median year renter moved in (as recorded in 2022):
| Bayfair: | 2010 |
| San Leandro: | 2018 |
Percentage of married-couple families with both working:
| Bayfair: | 98.6% |
| San Leandro: | 62.2% |
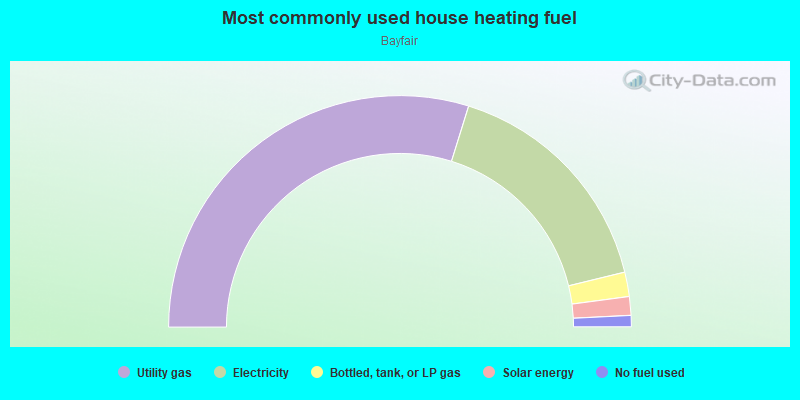
- 59.6%Utility gas
- 32.8%Electricity
- 3.4%Bottled, tank, or LP gas
- 2.6%Solar energy
- 1.6%No fuel used
Highways in this neighborhood:
State Hwy 185 (E 14th St)
Length: 1.02 miles
Direction: SE-NW
Address range: 14900 to 15734
Direction: SE-NW
Address range: 14900 to 15734
Roads and streets:
Hesperian Blvd
Length: 1.32 miles
Directions: N-S, SE-NW
Address range: 14800 to 15298
Directions: N-S, SE-NW
Address range: 14800 to 15298
Bay Fair Mall (Bayfair Dr)
Length: 0.87 miles
Directions: E-W, N-S, SE-NW, SW-NE
Address range: 1 to 1398
Directions: E-W, N-S, SE-NW, SW-NE
Address range: 1 to 1398
Fairmont Dr
Length: 0.63 miles
Directions: E-W, SW-NE
Address range: 1200 to 1399
Directions: E-W, SW-NE
Address range: 1200 to 1399
Colby St
Length: 0.24 miles
Direction: E-W
Address range: 400 to 599
Direction: E-W
Address range: 400 to 599
Bayfair Dr
Length: 0.11 miles
Directions: E-W, SE-NW, SW-NE
Directions: E-W, SE-NW, SW-NE
150th Ave
Length: 0.10 miles
Directions: N-S, SW-NE
Address range: 1300 to 1399
Directions: N-S, SW-NE
Address range: 1300 to 1399
Wagner St
Length: 0.07 miles
Direction: SE-NW
Address range: 15400 to 15499
Direction: SE-NW
Address range: 15400 to 15499
Dermody Ave
Length: 0.07 miles
Direction: N-S
Address range: 15200 to 15299
Direction: N-S
Address range: 15200 to 15299
Olive Ct
Length: 0.05 miles
Direction: E-W
Address range: 500 to 599
Direction: E-W
Address range: 500 to 599
Coelho Dr
Length: 0.03 miles
Direction: E-W
Address range: 15800 to 15803
Direction: E-W
Address range: 15800 to 15803
Railroad features:
Bay Area Rapid Transit RR
Length: 0.82 miles
Direction: SE-NW
Direction: SE-NW
Other features:
Estudillo Cnl
Length: 0.40 miles
Directions: E-W, SW-NE
Directions: E-W, SW-NE