Bel Air neighborhood in Falls Church, Virginia (VA), 22042 detailed profile
Settings
X

Business Search - 14 Million verified businesses
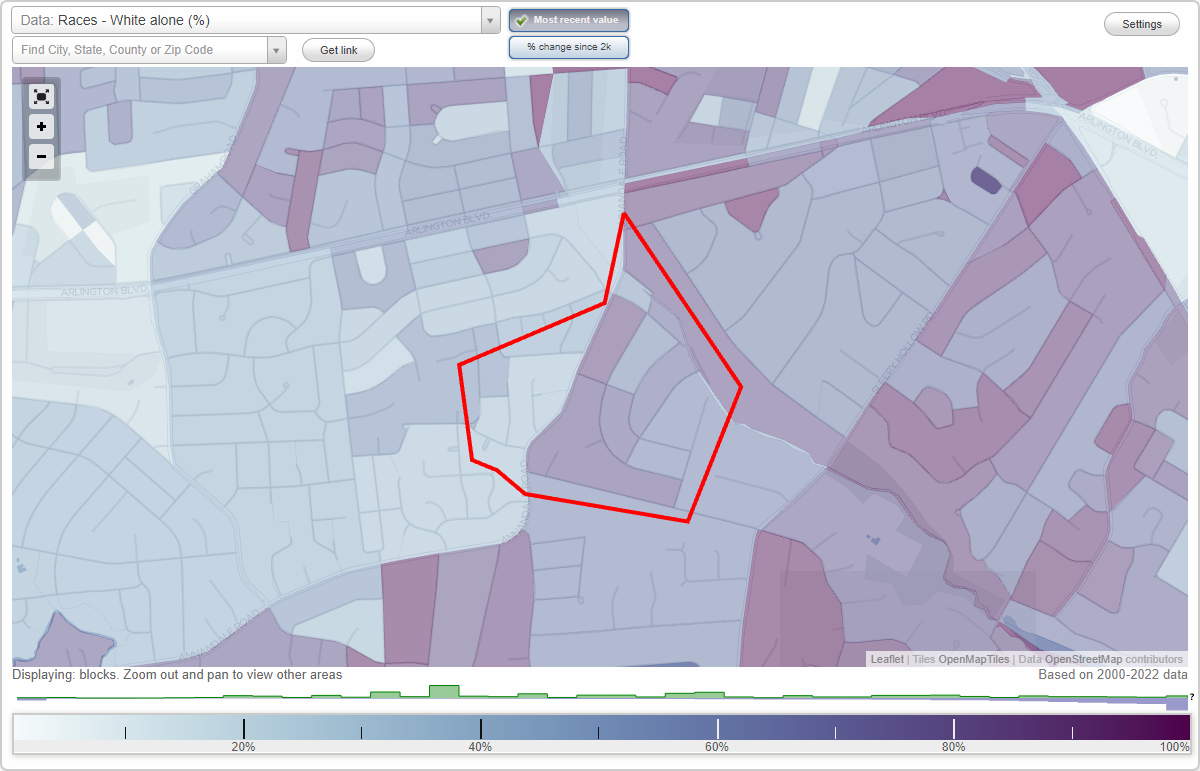
Area: 0.259 square miles
Population: 2,154
Population density:
| Bel Air: | 8,331 people per square mile |
| Falls Church: | 7,340 people per square mile |

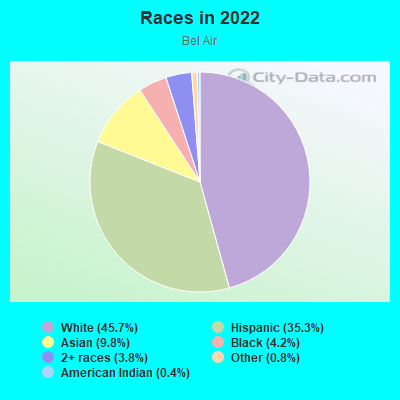
- 98745.7%White
- 76335.3%Hispanic or Latino
- 2119.8%Asian
- 914.2%Black
- 813.8%Two or more races
- 170.8%Some other race
- 90.4%American Indian
Median household income in 2022:
| Bel Air: | $155,552 |
| Falls Church: | $164,536 |
Distribution of median household income
![Distribution of median household income]()
- 16Less than $10,000
- 20$10,000 to $19,999
- 31$20,000 to $29,999
- 29$30,000 to $39,999
- 15$40,000 to $49,999
- 13$50,000 to $59,999
- 7$60,000 to $74,999
- 112$75,000 to $99,999
- 79$100,000 to $124,999
- 90$125,000 to $149,999
- 100$150,000 to $199,999
- 254$200,000 or more

Distribution of owner-occupied house/condo value
![Distribution of owner-occupied house/condo value]()
- 5Less than $50,000
- 12$150,000 to $199,999
- 12$250,000 to $299,999
- 16$300,000 to $399,999
- 91$400,000 to $499,999
- 299$500,000 to $749,999
- 180$750,000 to $999,999
- 66$1,000,000 or more

Distribution of rent paid by renters
![Distribution of rent paid by renters]()
- 14$400 to $499
- 7$700 to $799
- 14$1,000 to $1,249
- 72$2,000 or more

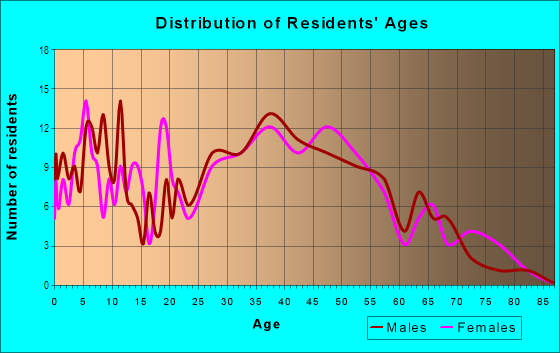
| Males: | 1,119 |
| Females: | 1,034 |
Males:
| This neighborhood: | 45.1 years |
| Whole city: | 36.7 years |
| This neighborhood: | 44.1 years |
| Whole city: | 41.5 years |
Average household size:
| Bel Air: | 3.0 people |
| Falls Church: | 2.5 people |
Percentage of family households:
| Bel Air: | 50.9% |
| Falls Church: | 46.0% |
| Here: | 68.1% |
| Falls Church: | 51.5% |
Percentage of married-couple families with children (among all households):
| Bel Air: | 32.0% |
| Falls Church: | 33.1% |
Percentage of single-mother households (among all households):
| Bel Air: | 0.7% |
| Falls Church: | 4.7% |
Percentage of never married males 15 years old and over:
Percentage of never married females 15 years old and over:
| Bel Air: | 17.7% |
| Falls Church: | 17.9% |
Percentage of never married females 15 years old and over:
| Bel Air: | 11.8% |
| city: | 16.2% |
Percentage of people that speak English not well or not at all:
| Bel Air: | 11.6% |
| Falls Church: | 2.2% |
Percentage of people born in this state:
Percentage of people born in another U.S. state:
Percentage of native residents but born outside the U.S.:
Percentage of foreign born residents:
| Here: | 30.5% |
| Falls Church: | 26.5% |
Percentage of people born in another U.S. state:
| Bel Air: | 34.3% |
| Falls Church: | 54.2% |
Percentage of native residents but born outside the U.S.:
| Here: | 4.2% |
| city: | 3.7% |
Percentage of foreign born residents:
| Here: | 31.1% |
| Falls Church: | 15.5% |
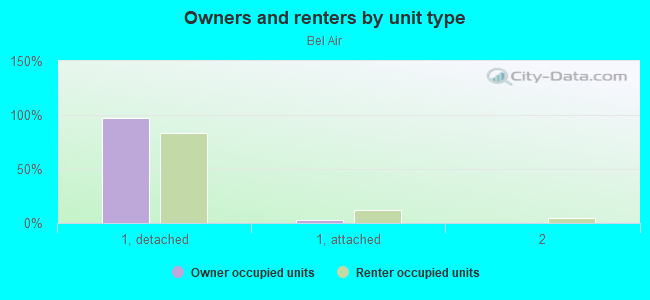
Owner-occupied
Renter-occupied

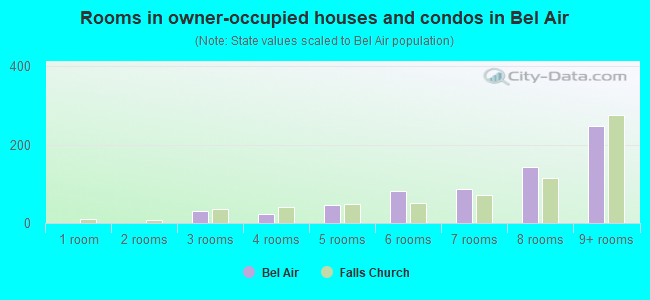
- Rooms in owner-occupied houses and condos in Bel Air
- 01 room
- 02 rooms
- 303 rooms
- 224 rooms
- 475 rooms
- 826 rooms
- 887 rooms
- 1448 rooms
- 2499+ rooms
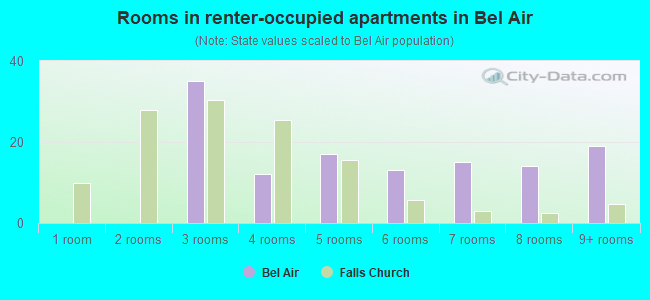
- Rooms in renter-occupied apartments in Bel Air
- 01 room
- 02 rooms
- 353 rooms
- 124 rooms
- 175 rooms
- 136 rooms
- 157 rooms
- 148 rooms
- 199+ rooms
Owner-occupied
Renter-occupied
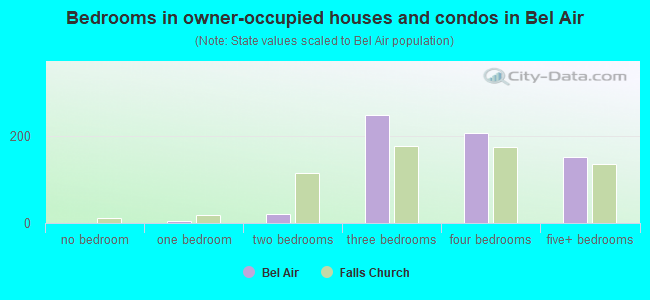
- Bedrooms in owner-occupied houses and condos in Bel Air
- 0no bedroom
- 51 bedroom
- 212 bedrooms
- 2493 bedrooms
- 2084 bedrooms
- 1525+ bedrooms
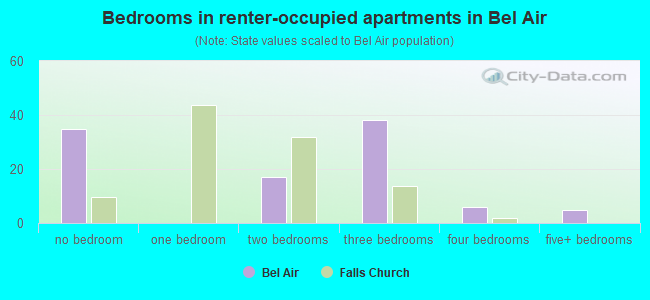
- Bedrooms in renter-occupied apartments in Bel Air
- 35no bedroom
- 01 bedroom
- 172 bedrooms
- 383 bedrooms
- 64 bedrooms
- 55+ bedrooms
Average number of cars or other vehicles available in houses/condos:
Average number of cars or other vehicles available in apartments:
| This neighborhood: | 2.4 |
| Falls Church: | 1.9 |
Average number of cars or other vehicles available in apartments:
| Here: | 2.0 |
| city: | 1.4 |
Percentage of units with a mortgage:
| Bel Air: | 74.5% |
| Falls Church: | 70.0% |
Average estimated value of detached houses in 2022 (97.3% of all units):
| Bel Air: | $608,057 |
| Virginia: | $472,865 |
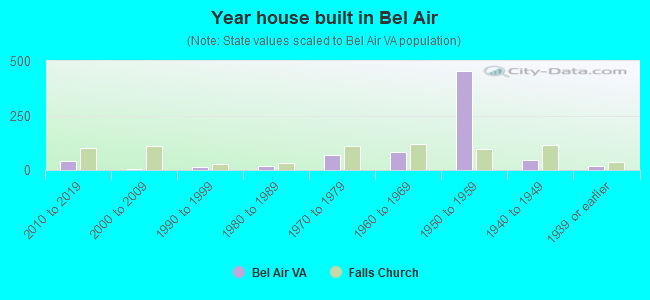
- Year house built in Bel Air
- 02020 or later
- 402010 to 2019
- 62000 to 2009
- 141990 to 1999
- 181980 to 1989
- 671970 to 1979
- 841960 to 1969
- 4561950 to 1959
- 481940 to 1949
- 201939 or earlier
City-data.com crime index for city in 2020 (higher means more crime):
| City: | 120.0 |
| U.S. average: | 219.5 |
Travel time to work (commute)
![Travel time to work (commute)]()
- 6Less than 5 minutes
- 155 to 9 minutes
- 5710 to 14 minutes
- 13415 to 19 minutes
- 15320 to 24 minutes
- 5425 to 29 minutes
- 15330 to 34 minutes
- 3135 to 39 minutes
- 5040 to 44 minutes
- 13245 to 59 minutes
- 8660 to 89 minutes
- 1590 or more minutes

Means of transportation to work
![Means of transportation to work]()
- 65.7%773Drove a car alone
- 6.3%74Carpooled
- 4.1%48Bus
- 4.3%51Subway or elevated rail
- 0.3%3Long-distance train or commuter rail
- 1.5%18Taxi
- 0.3%3Walked
- 1.2%14Other means
- 18.7%220Worked at home

Time leaving home to go to work
![Time leaving home to go to work]()
- 3012:00 a.m. to 4:59 a.m.
- 585:00 a.m. to 5:29 a.m.
- 105:30 a.m. to 5:59 a.m.
- 586:00 a.m. to 6:29 a.m.
- 486:30 a.m. to 6:59 a.m.
- 1397:00 a.m. to 7:29 a.m.
- 1277:30 a.m. to 7:59 a.m.
- 1388:00 a.m. to 8:29 a.m.
- 638:30 a.m. to 8:59 a.m.
- 879:00 a.m. to 9:59 a.m.
- 1610:00 a.m. to 10:59 a.m.
- 1811:00 a.m. to 11:59 a.m.
- 3612:00 p.m. to 3:59 p.m.
- 864:00 p.m. to 11:59 p.m.

Occupations of males:
- Percentage of males in management occupations (except farmers):
Here: 12.7% city: 24.7%
- Percentage of males in business and financial operations occupations:
Here: 8.7% city: 9.3%
- Percentage of males in computer and mathematical occupations:
Here: 6.8% city: 15.0%
- Percentage of males in architecture and engineering occupations:
Here: 1.4% city: 3.6%
- Percentage of males in life, physical, and social science occupations:
Here: 3.1% city: 3.7%
- Percentage of males in legal occupations:
Here: 3.5% city: 6.6%
- Percentage of males in education, training, and library occupations:
Here: 1.2% city: 4.4%
- Percentage of males in arts, design, entertainment, sports, and media occupations:
Here: 4.3% city: 2.1%
- Percentage of males in healthcare practitioners and technical occupations:
Here: 2.9% city: 1.7%
- Percentage of males in service occupations:
Here: 14.7% city: 7.4%
- Percentage of males in sales and office occupations:
Here: 11.1% city: 12.4%
- Percentage of males in construction, extraction, and maintenance occupations:
Here: 21.5% city: 4.0%
- Percentage of males in production occupations:
Here: 1.9% city: 0.8%
- Percentage of males in transportation occupations:
Here: 4.1% city: 0.5%
Occupations of females:
- Percentage of females in management occupations (except farmers):
Here: 7.8% city: 15.1%
- Percentage of females in business and financial operations occupations:
Here: 11.1% city: 14.3%
- Percentage of females in computer and mathematical occupations:
Here: 5.2% city: 8.7%
- Percentage of females in life, physical, and social science occupations:
Here: 1.2% city: 2.7%
- Percentage of females in community and social services occupations:
Here: 5.8% city: 1.9%
- Percentage of females in legal occupations:
Here: 3.7% city: 4.6%
- Percentage of females in education, training, and library occupations:
Here: 5.8% city: 10.6%
- Percentage of females in arts, design, entertainment, sports, and media occupations:
Here: 9.7% city: 3.0%
- Percentage of females in healthcare practitioners and technical occupations:
Here: 3.8% city: 9.4%
- Percentage of females in service occupations:
Here: 14.8% city: 12.6%
- Percentage of females in sales and office occupations:
Here: 25.7% city: 15.9%
- Percentage of females in construction, extraction, and maintenance occupations:
Here: 3.1% city: 0.0%
- Percentage of females in material moving occupations:
Here: 1.6% city: 0.5%
Percentage of people 16-64 in Armed Forces:
| Bel Air: | 0.3% |
| Falls Church: | 1.3% |
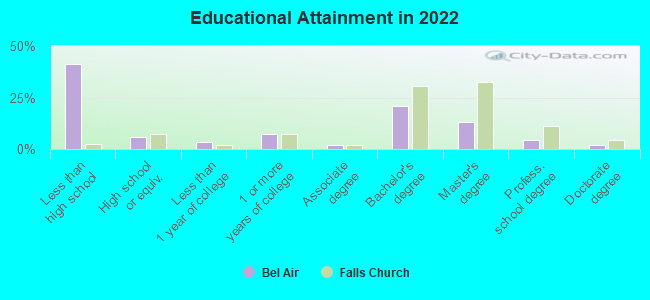
Education in this neighborhood (subdivision or community):
- Percentage of people 3 years and older in K-12 schools:
Bel Air: 16.4% Falls Church: 21.3%
- Percentage of people 3 years and older in undergraduate colleges:
Bel Air: 6.7% Falls Church: 4.5%
- Percentage of people 3 years and older in grad. or professional schools:
Bel Air: 1.0% Falls Church: 2.0%
- Percentage of students K-12 enrolled in private schools:
Bel Air: 23.1% Falls Church: 11.0%
Percentage of population below poverty level:
| Bel Air: | 2.1% |
| Falls Church: | 2.3% |
Median year owner moved in (as recorded in 2022):
| Bel Air: | 2006 |
| Falls Church: | 2010 |
Percentage of married-couple families with both working:
| Bel Air: | 83.5% |
| Falls Church: | 77.3% |
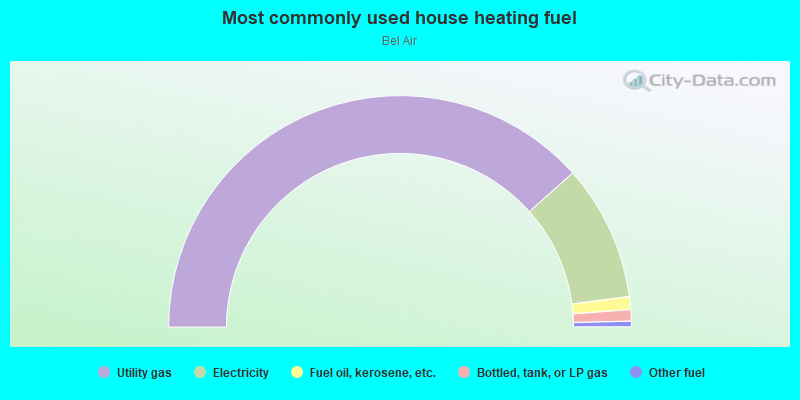
- 76.9%Utility gas
- 19.0%Electricity
- 1.8%Fuel oil, kerosene, etc.
- 1.6%Bottled, tank, or LP gas
- 0.8%Other fuel
Highways in this neighborhood:
Annandale Rd (State Rte 649)
Length: 0.66 miles
Directions: N-S, SW-NE
Address range: 3020 to 3205
Directions: N-S, SW-NE
Address range: 3020 to 3205
Roads and streets:
Dashiell Rd
Length: 0.73 miles
Directions: E-W, N-S, SE-NW, SW-NE
Address range: 3000 to 3299
Directions: E-W, N-S, SE-NW, SW-NE
Address range: 3000 to 3299
Barrett Rd
Length: 0.62 miles
Directions: E-W, N-S, SE-NW, SW-NE
Address range: 6600 to 6699
Directions: E-W, N-S, SE-NW, SW-NE
Address range: 6600 to 6699
Cofer Rd
Length: 0.46 miles
Directions: E-W, N-S, SE-NW, SW-NE
Address range: 3100 to 3299
Directions: E-W, N-S, SE-NW, SW-NE
Address range: 3100 to 3299
Kerns Rd
Length: 0.44 miles
Direction: E-W
Address range: 6640 to 6799
Direction: E-W
Address range: 6640 to 6799
Gouthier Rd
Length: 0.40 miles
Direction: E-W
Address range: 6600 to 6899
Direction: E-W
Address range: 6600 to 6899
Holloway Rd
Length: 0.32 miles
Directions: E-W, SW-NE
Address range: 3100 to 3299
Directions: E-W, SW-NE
Address range: 3100 to 3299
Kenfig Dr
Length: 0.17 miles
Directions: E-W, SE-NW
Address range: 6800 to 6845
Directions: E-W, SE-NW
Address range: 6800 to 6845
Headrow Ln
Length: 0.14 miles
Direction: N-S
Address range: 3100 to 3199
Direction: N-S
Address range: 3100 to 3199
Darwin Dr
Length: 0.13 miles
Directions: N-S, SE-NW, SW-NE
Address range: 3100 to 3199
Directions: N-S, SE-NW, SW-NE
Address range: 3100 to 3199
Grenstead St
Length: 0.09 miles
Direction: E-W
Address range: 6800 to 6899
Direction: E-W
Address range: 6800 to 6899
Driver Cir
Length: 0.07 miles
Directions: E-W, N-S, SE-NW, SW-NE
Address range: 3200 to 3211
Directions: E-W, N-S, SE-NW, SW-NE
Address range: 3200 to 3211
Hessney Dr
Length: 0.07 miles
Direction: SW-NE
Address range: 3200 to 3299
Direction: SW-NE
Address range: 3200 to 3299
McCrea Pl
Length: 0.05 miles
Direction: E-W
Address range: 6700 to 6799
Direction: E-W
Address range: 6700 to 6799
Chepstow Ln
Length: 0.05 miles
Directions: N-S, SW-NE
Address range: 3132 to 3163
Directions: N-S, SW-NE
Address range: 3132 to 3163
Darwin Ct
Length: 0.03 miles
Direction: E-W
Address range: 6700 to 6799
Direction: E-W
Address range: 6700 to 6799
Other features:
Tripps Run
Length: 0.09 miles
Directions: E-W, SE-NW
Directions: E-W, SE-NW