Bella Vista neighborhood in Oakland, California (CA), 94606, 94610 detailed profile
Settings
X


Business Search - 14 Million verified businesses
Area: 0.081 square miles
Population: 1,367
Population density:
| Bella Vista: | 16,808 people per square mile |
| Oakland: | 7,680 people per square mile |

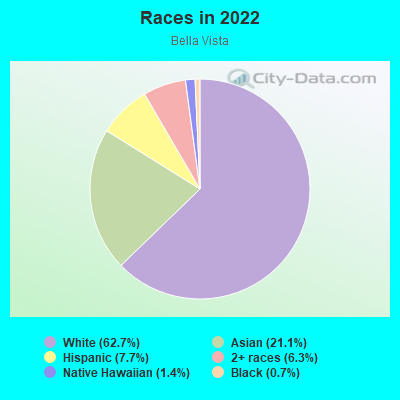
- 43030.8%White
- 39528.3%Asian
- 20014.3%Black
- 17512.5%Hispanic or Latino
- 16211.6%Two or more races
- 171.2%American Indian
- 161.1%Some other race
Distribution of median household income
![Distribution of median household income]()
- 44Less than $10,000
- 43$10,000 to $19,999
- 44$20,000 to $29,999
- 70$30,000 to $39,999
- 63$40,000 to $49,999
- 42$50,000 to $59,999
- 30$60,000 to $74,999
- 321$75,000 to $99,999
- 32$100,000 to $124,999
- 17$125,000 to $149,999
- 95$150,000 to $199,999
- 137$200,000 or more

Distribution of owner-occupied house/condo value
![Distribution of owner-occupied house/condo value]()
- 5Less than $50,000
- 23$50,000 to $99,999
- 24$100,000 to $149,999
- 14$200,000 to $249,999
- 24$250,000 to $299,999
- 3$300,000 to $399,999
- 27$400,000 to $499,999
- 57$500,000 to $749,999
- 51$750,000 to $999,999
- 92$1,000,000 or more

Distribution of rent paid by renters
![Distribution of rent paid by renters]()
- 61$100 to $199
- 33$200 to $299
- 9$300 to $399
- 25$400 to $499
- 79$500 to $599
- 14$600 to $699
- 34$700 to $799
- 54$800 to $899
- 69$900 to $999
- 66$1,000 to $1,249
- 144$1,250 to $1,499
- 112$1,500 to $1,999
- 171$2,000 or more

Median rent in 2022:
| Bella Vista: | $1,769 |
| Oakland: | $1,741 |
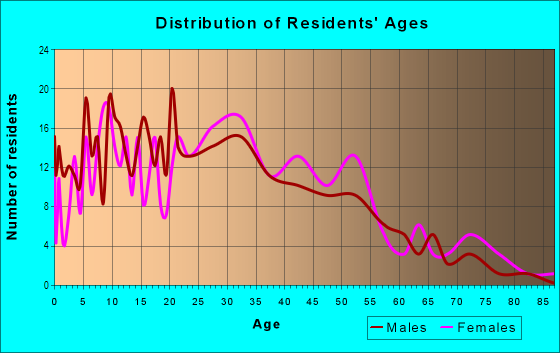
| Males: | 609 |
| Females: | 757 |
Males:
| This neighborhood: | 37.6 years |
| Whole city: | 38.3 years |
| This neighborhood: | 39.8 years |
| Whole city: | 39.1 years |
Average household size:
| Bella Vista: | 2.2 people |
| Oakland: | 2.4 people |
Percentage of family households:
| Bella Vista: | 31.3% |
| Oakland: | 37.1% |
| Here: | 28.8% |
| Oakland: | 34.9% |
Percentage of married-couple families with children (among all households):
| Bella Vista: | 36.5% |
| Oakland: | 28.3% |
Percentage of single-mother households (among all households):
| Bella Vista: | 5.5% |
| Oakland: | 9.9% |
Percentage of never married males 15 years old and over:
Percentage of never married females 15 years old and over:
| Bella Vista: | 23.0% |
| Oakland: | 24.6% |
Percentage of never married females 15 years old and over:
| Bella Vista: | 28.0% |
| city: | 21.9% |
Percentage of people that speak English not well or not at all:
| Bella Vista: | 4.0% |
| Oakland: | 10.6% |
Percentage of people born in this state:
Percentage of people born in another U.S. state:
Percentage of native residents but born outside the U.S.:
Percentage of foreign born residents:
| Here: | 48.8% |
| Oakland: | 49.9% |
Percentage of people born in another U.S. state:
| Bella Vista: | 25.5% |
| Oakland: | 22.3% |
Percentage of native residents but born outside the U.S.:
| Here: | 3.5% |
| city: | 1.6% |
Percentage of foreign born residents:
| Here: | 22.2% |
| Oakland: | 26.2% |

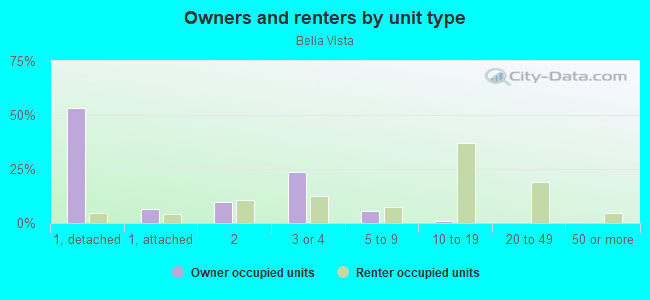
Owner-occupied
Renter-occupied

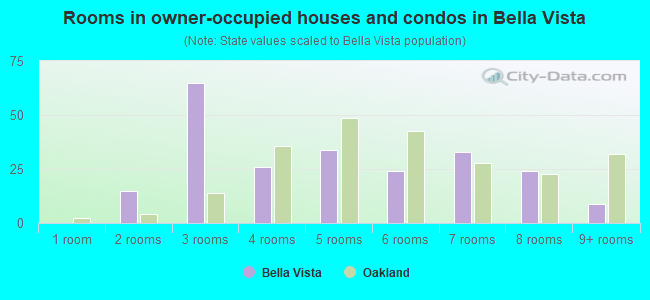
- Rooms in owner-occupied houses and condos in Bella Vista
- 01 room
- 152 rooms
- 653 rooms
- 264 rooms
- 345 rooms
- 246 rooms
- 337 rooms
- 248 rooms
- 99+ rooms
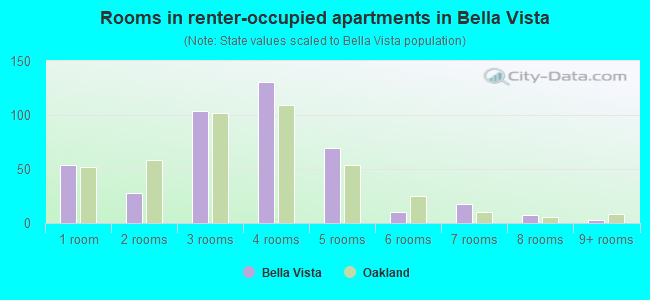
- Rooms in renter-occupied apartments in Bella Vista
- 541 room
- 282 rooms
- 1043 rooms
- 1314 rooms
- 695 rooms
- 106 rooms
- 187 rooms
- 78 rooms
- 39+ rooms
Owner-occupied
Renter-occupied
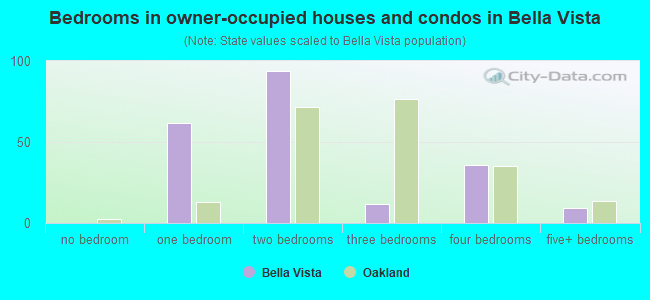
- Bedrooms in owner-occupied houses and condos in Bella Vista
- 0no bedroom
- 621 bedroom
- 942 bedrooms
- 123 bedrooms
- 364 bedrooms
- 95+ bedrooms
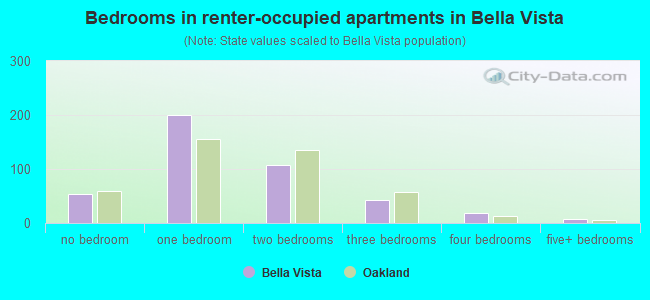
- Bedrooms in renter-occupied apartments in Bella Vista
- 54no bedroom
- 2001 bedroom
- 1072 bedrooms
- 423 bedrooms
- 184 bedrooms
- 75+ bedrooms
Average number of cars or other vehicles available in houses/condos:
Average number of cars or other vehicles available in apartments:
| This neighborhood: | 2.6 |
| Oakland: | 1.8 |
Average number of cars or other vehicles available in apartments:
| Here: | 1.0 |
| city: | 1.1 |
Percentage of units with a mortgage:
| Bella Vista: | 75.9% |
| Oakland: | 71.2% |
Average estimated value of detached houses in 2022 (26.3% of all units):
| Bella Vista: | $783,267 |
| Oakland: | $1,000,874 |
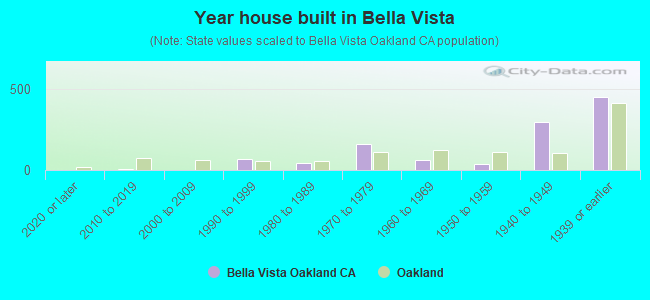
- Year house built in Bella Vista
- 02020 or later
- 42010 to 2019
- 32000 to 2009
- 681990 to 1999
- 461980 to 1989
- 1631970 to 1979
- 601960 to 1969
- 361950 to 1959
- 2951940 to 1949
- 4501939 or earlier
City-data.com crime index for city in 2020 (higher means more crime):
| City: | 691.6 |
| U.S. average: | 219.5 |
Travel time to work (commute)
![Travel time to work (commute)]()
- 11Less than 5 minutes
- 405 to 9 minutes
- 6010 to 14 minutes
- 9815 to 19 minutes
- 7820 to 24 minutes
- 3125 to 29 minutes
- 12930 to 34 minutes
- 3135 to 39 minutes
- 4740 to 44 minutes
- 3845 to 59 minutes
- 6560 to 89 minutes
- 2590 or more minutes

Means of transportation to work
![Means of transportation to work]()
- 54.0%494Drove a car alone
- 10.8%99Carpooled
- 3.8%35Bus
- 6.0%55Subway or elevated rail
- 0.5%5Long-distance train or commuter rail
- 0.8%7Light rail, streetcar or trolley
- 3.3%30Ferryboat
- 1.5%14Bicycle
- 1.2%11Walked
- 2.7%25Other means
- 19.3%177Worked at home

Time leaving home to go to work
![Time leaving home to go to work]()
- 2112:00 a.m. to 4:59 a.m.
- 55:00 a.m. to 5:29 a.m.
- 65:30 a.m. to 5:59 a.m.
- 96:00 a.m. to 6:29 a.m.
- 316:30 a.m. to 6:59 a.m.
- 707:00 a.m. to 7:29 a.m.
- 877:30 a.m. to 7:59 a.m.
- 1468:00 a.m. to 8:29 a.m.
- 528:30 a.m. to 8:59 a.m.
- 839:00 a.m. to 9:59 a.m.
- 2110:00 a.m. to 10:59 a.m.
- 2411:00 a.m. to 11:59 a.m.
- 4612:00 p.m. to 3:59 p.m.
- 854:00 p.m. to 11:59 p.m.

Occupations of males:
- Percentage of males in management occupations (except farmers):
Here: 13.9% city: 13.5%
- Percentage of males in business and financial operations occupations:
Here: 3.4% city: 6.0%
- Percentage of males in computer and mathematical occupations:
Here: 3.3% city: 7.3%
- Percentage of males in architecture and engineering occupations:
Here: 4.4% city: 3.8%
- Percentage of males in education, training, and library occupations:
Here: 4.8% city: 4.6%
- Percentage of males in arts, design, entertainment, sports, and media occupations:
Here: 4.7% city: 4.7%
- Percentage of males in healthcare practitioners and technical occupations:
Here: 15.5% city: 2.8%
- Percentage of males in service occupations:
Here: 15.9% city: 12.9%
- Percentage of males in sales and office occupations:
Here: 10.0% city: 13.4%
- Percentage of males in farming, fishing, and forestry occupations:
Here: 1.1% city: 0.4%
- Percentage of males in construction, extraction, and maintenance occupations:
Here: 2.9% city: 8.3%
- Percentage of males in production occupations:
Here: 3.2% city: 4.2%
- Percentage of males in transportation occupations:
Here: 8.8% city: 5.6%
- Percentage of males in material moving occupations:
Here: 5.8% city: 4.5%
Occupations of females:
- Percentage of females in management occupations (except farmers):
Here: 24.2% city: 15.1%
- Percentage of females in business and financial operations occupations:
Here: 2.9% city: 8.2%
- Percentage of females in architecture and engineering occupations:
Here: 2.3% city: 1.6%
- Percentage of females in life, physical, and social science occupations:
Here: 2.3% city: 2.3%
- Percentage of females in community and social services occupations:
Here: 5.3% city: 3.7%
- Percentage of females in legal occupations:
Here: 1.9% city: 2.5%
- Percentage of females in education, training, and library occupations:
Here: 3.3% city: 8.4%
- Percentage of females in arts, design, entertainment, sports, and media occupations:
Here: 8.5% city: 4.8%
- Percentage of females in healthcare practitioners and technical occupations:
Here: 26.1% city: 6.7%
- Percentage of females in service occupations:
Here: 9.4% city: 17.8%
- Percentage of females in sales and office occupations:
Here: 7.3% city: 20.0%
- Percentage of females in production occupations:
Here: 1.5% city: 2.4%
- Percentage of females in material moving occupations:
Here: 3.5% city: 1.7%
Education in this neighborhood (subdivision or community):
- Percentage of people 3 years and older in K-12 schools:
Bella Vista: 14.5% Oakland: 13.0%
- Percentage of people 3 years and older in undergraduate colleges:
Bella Vista: 3.3% Oakland: 4.3%
- Percentage of people 3 years and older in grad. or professional schools:
Bella Vista: 3.1% Oakland: 1.8%
- Percentage of students K-12 enrolled in private schools:
Bella Vista: 34.6% Oakland: 15.8%
Percentage of population below poverty level:
| Bella Vista: | 17.5% |
| Oakland: | 13.9% |
Median year owner moved in (as recorded in 2022):
Median year renter moved in (as recorded in 2022):
| Bella Vista: | 2011 |
| Oakland: | 2010 |
Median year renter moved in (as recorded in 2022):
| Bella Vista: | 2013 |
| Oakland: | 2018 |
Percentage of married-couple families with both working:
| Bella Vista: | 77.9% |
| Oakland: | 73.2% |
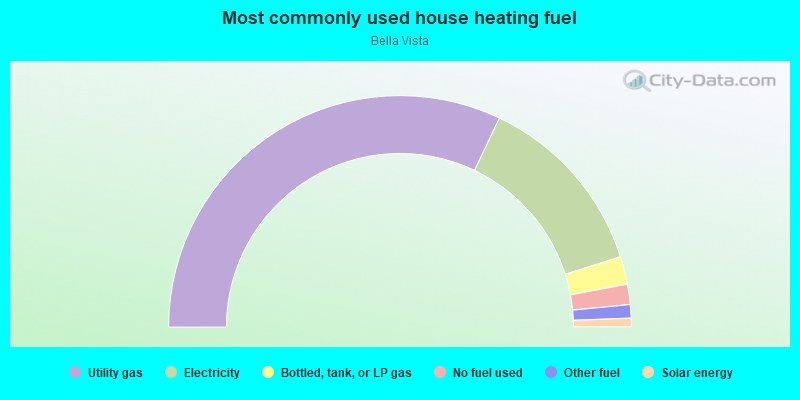
- 64.1%Utility gas
- 26.0%Electricity
- 3.9%Bottled, tank, or LP gas
- 2.8%No fuel used
- 1.9%Other fuel
- 1.2%Solar energy
Roads and streets:
13th Ave
Length: 0.29 miles
Direction: SW-NE
Address range: 2600 to 3199
Direction: SW-NE
Address range: 2600 to 3199
Bella Vista Ave
Length: 0.24 miles
Directions: E-W, SE-NW, SW-NE
Address range: 1000 to 1199
Directions: E-W, SE-NW, SW-NE
Address range: 1000 to 1199
E 28th St
Length: 0.18 miles
Direction: SE-NW
Address range: 1000 to 1299
Direction: SE-NW
Address range: 1000 to 1299
11th Ave
Length: 0.16 miles
Direction: SW-NE
Address range: 2800 to 3199
Direction: SW-NE
Address range: 2800 to 3199
Bayview Ave
Length: 0.13 miles
Direction: SE-NW
Address range: 1100 to 1199
Direction: SE-NW
Address range: 1100 to 1199