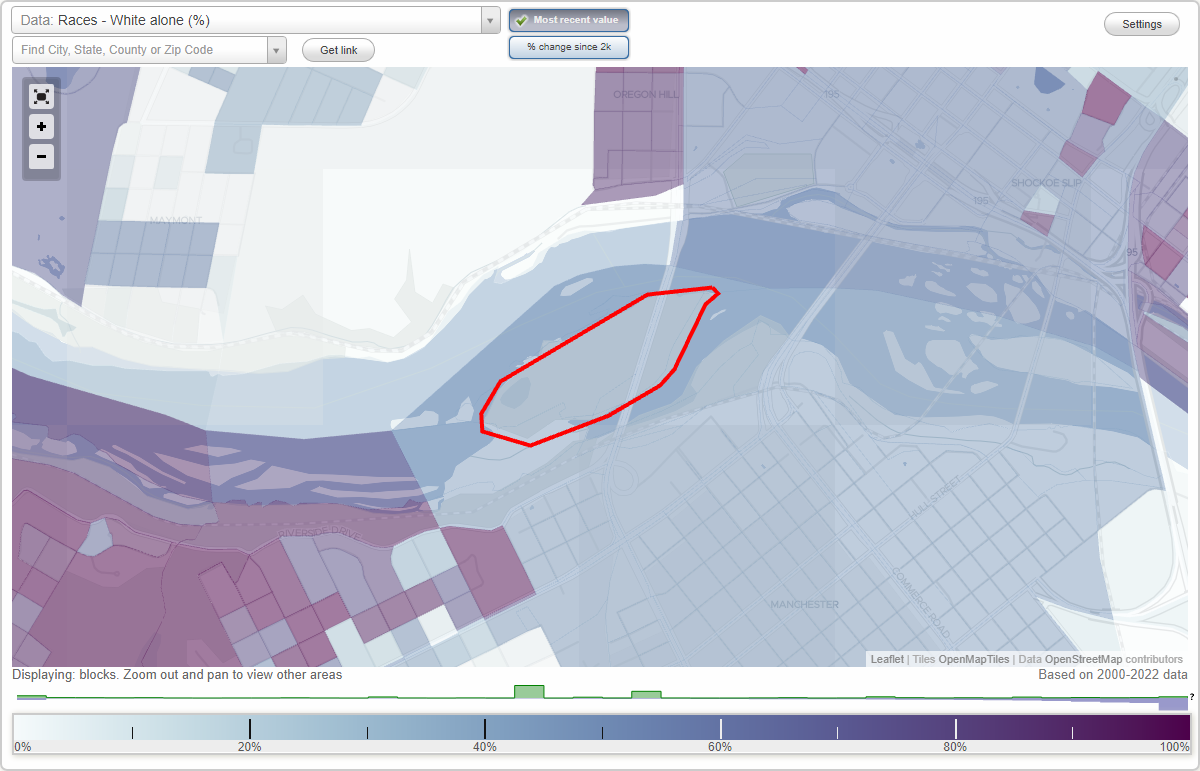
Belle Isle neighborhood in Richmond, Virginia (VA), 23220 detailed profile
Settings
X

Business Search - 14 Million verified businesses
Area: 0.097 square miles
Population: 193
Population density:
| Belle Isle: | 1,984 people per square mile |
| Richmond: | 3,819 people per square mile |

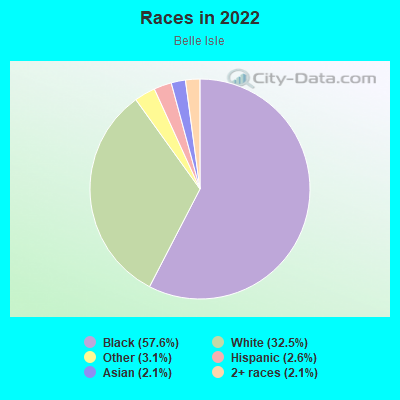
- 11057.6%Black
- 6232.5%White
- 63.1%Some other race
- 52.6%Hispanic or Latino
- 42.1%Asian
- 42.1%Two or more races
Median household income in 2022:
| Belle Isle: | $50,790 |
| Richmond: | $58,988 |
Distribution of median household income
![Distribution of median household income]()
- 14Less than $10,000
- 12$10,000 to $19,999
- 6$20,000 to $29,999
- 4$30,000 to $39,999
- 4$40,000 to $49,999
- 8$50,000 to $59,999
- 8$60,000 to $74,999
- 9$75,000 to $99,999
- 10$100,000 to $124,999
- 6$125,000 to $149,999
- 2$150,000 to $199,999
- 1$200,000 or more

Distribution of owner-occupied house/condo value
![Distribution of owner-occupied house/condo value]()
- 1Less than $50,000
- 1$50,000 to $99,999
- 5$100,000 to $149,999
- 6$150,000 to $199,999
- 7$200,000 to $249,999
- 6$250,000 to $299,999
- 4$300,000 to $399,999
- 1$400,000 to $499,999
- 2$500,000 to $749,999

Distribution of rent paid by renters
![Distribution of rent paid by renters]()
- 5$100 to $199
- 3$200 to $299
- 7$300 to $399
- 2$400 to $499
- 8$500 to $599
- 3$600 to $699
- 1$800 to $899
- 4$1,000 to $1,249
- 5$1,250 to $1,499
- 11$1,500 to $1,999
- 9$2,000 or more

Median rent in 2022:
| Belle Isle: | $1,092 |
| Richmond: | $1,050 |
| Males: | 126 |
| Females: | 67 |
Males:
| This neighborhood: | 26.3 years |
| Whole city: | 34.4 years |
| This neighborhood: | 31.9 years |
| Whole city: | 35.1 years |
Average household size:
| Belle Isle: | 2.4 people |
| Richmond: | 26.0 people |
Percentage of family households:
| Belle Isle: | 28.0% |
| Richmond: | 31.3% |
| Here: | 11.5% |
| Richmond: | 25.2% |
Percentage of married-couple families with children (among all households):
| Belle Isle: | 11.7% |
| Richmond: | 23.1% |
Percentage of single-mother households (among all households):
| Belle Isle: | 29.2% |
| Richmond: | 19.2% |
Percentage of never married males 15 years old and over:
Percentage of never married females 15 years old and over:
| Belle Isle: | 55.0% |
| Richmond: | 25.8% |
Percentage of never married females 15 years old and over:
| Belle Isle: | 19.9% |
| city: | 27.8% |
Percentage of people that speak English not well or not at all:
| Belle Isle: | 0.0% |
| Richmond: | 3.2% |
Percentage of people born in this state:
Percentage of people born in another U.S. state:
Percentage of native residents but born outside the U.S.:
Percentage of foreign born residents:
| Here: | 67.7% |
| Richmond: | 59.8% |
Percentage of people born in another U.S. state:
| Belle Isle: | 23.4% |
| Richmond: | 31.3% |
Percentage of native residents but born outside the U.S.:
| Here: | 2.4% |
| city: | 1.7% |
Percentage of foreign born residents:
| Here: | 6.5% |
| Richmond: | 7.1% |
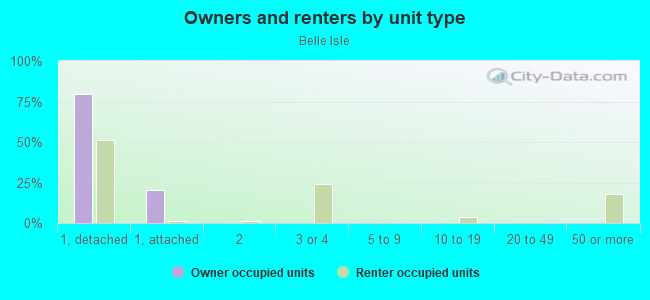
Owner-occupied
Renter-occupied

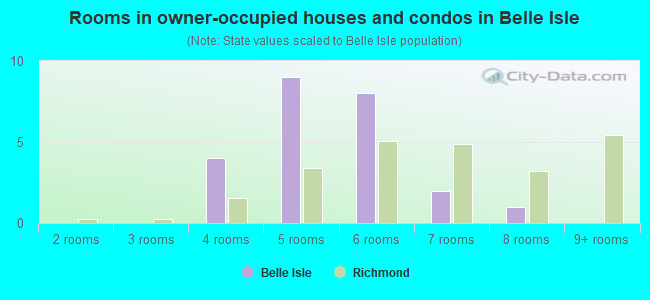
- Rooms in owner-occupied houses and condos in Belle Isle
- 01 room
- 02 rooms
- 03 rooms
- 44 rooms
- 95 rooms
- 86 rooms
- 27 rooms
- 18 rooms
- 09+ rooms
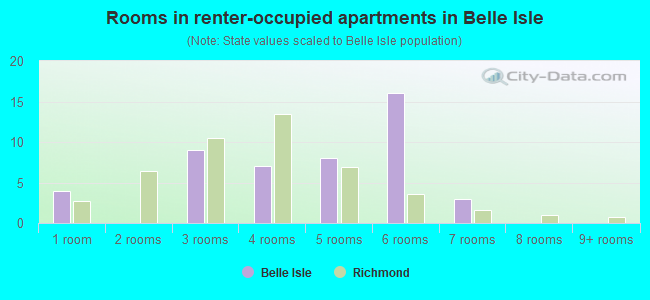
- Rooms in renter-occupied apartments in Belle Isle
- 41 room
- 02 rooms
- 93 rooms
- 74 rooms
- 85 rooms
- 166 rooms
- 37 rooms
- 08 rooms
- 09+ rooms
Owner-occupied
Renter-occupied
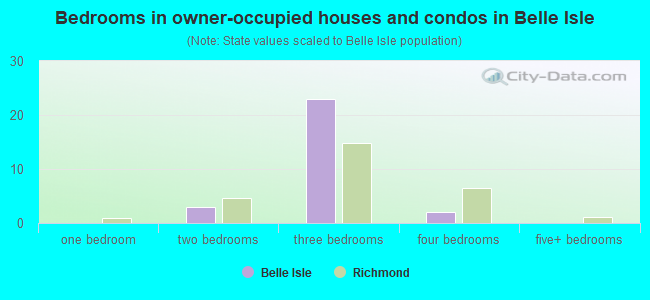
- Bedrooms in owner-occupied houses and condos in Belle Isle
- 0no bedroom
- 01 bedroom
- 32 bedrooms
- 233 bedrooms
- 24 bedrooms
- 05+ bedrooms
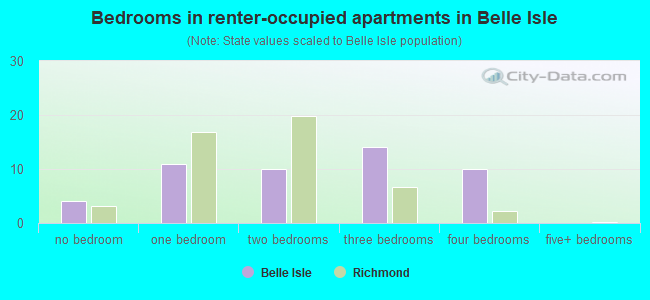
- Bedrooms in renter-occupied apartments in Belle Isle
- 4no bedroom
- 111 bedroom
- 102 bedrooms
- 143 bedrooms
- 104 bedrooms
- 05+ bedrooms
Average number of cars or other vehicles available in houses/condos:
Average number of cars or other vehicles available in apartments:
| This neighborhood: | 1.8 |
| Richmond: | 1.9 |
Average number of cars or other vehicles available in apartments:
| Here: | 1.5 |
| city: | 1.2 |
Percentage of units with a mortgage:
| Belle Isle: | 83.6% |
| Richmond: | 70.8% |
Housing prices:
- Average estimated value of detached houses in 2022 (60.2% of all units):
Belle Isle: $241,366 Richmond: $385,339
- Average estimated value of townhouses or other attached units in 2022 (7.2% of all units):
This neighborhood: $231,003 city: $498,254
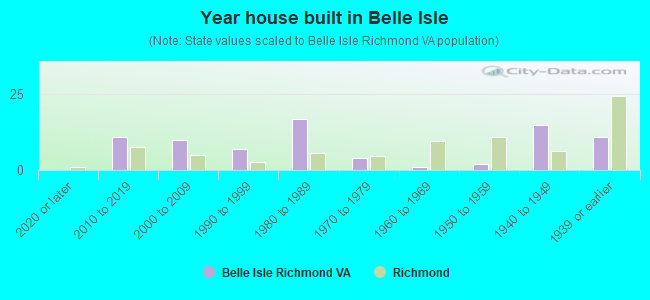
- Year house built in Belle Isle
- 02020 or later
- 112010 to 2019
- 102000 to 2009
- 71990 to 1999
- 171980 to 1989
- 41970 to 1979
- 11960 to 1969
- 21950 to 1959
- 151940 to 1949
- 111939 or earlier
City-data.com crime index for city in 2020 (higher means more crime):
| City: | 274.8 |
| U.S. average: | 219.5 |
Travel time to work (commute)
![Travel time to work (commute)]()
- 65 to 9 minutes
- 1310 to 14 minutes
- 1115 to 19 minutes
- 1820 to 24 minutes
- 625 to 29 minutes
- 1030 to 34 minutes
- 340 to 44 minutes
- 145 to 59 minutes
- 560 to 89 minutes
- 290 or more minutes

Means of transportation to work
![Means of transportation to work]()
- 72.9%85Drove a car alone
- 5.1%6Carpooled
- 4.3%5Bus
- 0.9%1Bicycle
- 0.9%1Walked
- 12.9%15Worked at home

Time leaving home to go to work
![Time leaving home to go to work]()
- 112:00 a.m. to 4:59 a.m.
- 25:00 a.m. to 5:29 a.m.
- 16:00 a.m. to 6:29 a.m.
- 66:30 a.m. to 6:59 a.m.
- 47:00 a.m. to 7:29 a.m.
- 107:30 a.m. to 7:59 a.m.
- 138:00 a.m. to 8:29 a.m.
- 98:30 a.m. to 8:59 a.m.
- 99:00 a.m. to 9:59 a.m.
- 410:00 a.m. to 10:59 a.m.
- 812:00 p.m. to 3:59 p.m.
- 54:00 p.m. to 11:59 p.m.

Occupations of males:
- Percentage of males in management occupations (except farmers):
Here: 10.5% city: 10.7%
- Percentage of males in computer and mathematical occupations:
Here: 8.5% city: 5.6%
- Percentage of males in architecture and engineering occupations:
Here: 11.1% city: 3.0%
- Percentage of males in life, physical, and social science occupations:
Here: 2.4% city: 1.7%
- Percentage of males in community and social services occupations:
Here: 3.3% city: 1.4%
- Percentage of males in arts, design, entertainment, sports, and media occupations:
Here: 2.4% city: 2.9%
- Percentage of males in healthcare practitioners and technical occupations:
Here: 5.1% city: 3.0%
- Percentage of males in service occupations:
Here: 19.6% city: 15.4%
- Percentage of males in sales and office occupations:
Here: 18.9% city: 15.3%
- Percentage of males in production occupations:
Here: 4.8% city: 3.8%
- Percentage of males in transportation occupations:
Here: 6.4% city: 4.8%
- Percentage of males in material moving occupations:
Here: 6.3% city: 7.1%
Occupations of females:
- Percentage of females in management occupations (except farmers):
Here: 3.9% city: 9.9%
- Percentage of females in architecture and engineering occupations:
Here: 6.6% city: 0.7%
- Percentage of females in life, physical, and social science occupations:
Here: 1.3% city: 1.4%
- Percentage of females in community and social services occupations:
Here: 17.1% city: 4.4%
- Percentage of females in education, training, and library occupations:
Here: 5.6% city: 9.5%
- Percentage of females in arts, design, entertainment, sports, and media occupations:
Here: 5.3% city: 3.7%
- Percentage of females in healthcare practitioners and technical occupations:
Here: 6.7% city: 8.5%
- Percentage of females in service occupations:
Here: 21.9% city: 21.3%
- Percentage of females in sales and office occupations:
Here: 27.5% city: 23.3%
- Percentage of females in production occupations:
Here: 7.7% city: 2.4%
- Percentage of females in material moving occupations:
Here: 6.9% city: 2.1%
Percentage of people 16-64 in Armed Forces:
| Belle Isle: | 2.0% |
| Richmond: | 0.5% |
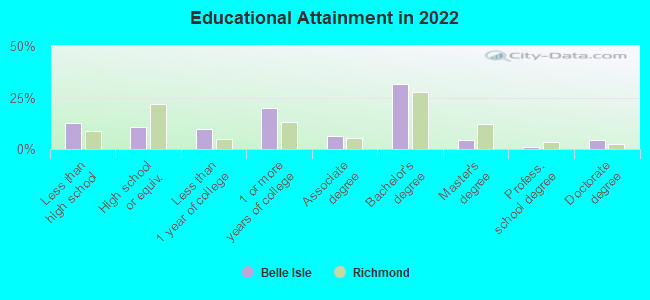
Education in this neighborhood (subdivision or community):
- Percentage of people 3 years and older in K-12 schools:
Belle Isle: 9.8% Richmond: 11.5%
- Percentage of people 3 years and older in undergraduate colleges:
Belle Isle: 17.6% Richmond: 10.1%
- Percentage of people 3 years and older in grad. or professional schools:
Belle Isle: 2.6% Richmond: 1.5%
- Percentage of students K-12 enrolled in private schools:
Belle Isle: 0.0% Richmond: 11.4%
Percentage of population below poverty level:
| Belle Isle: | 24.1% |
| Richmond: | 21.7% |
Median year owner moved in (as recorded in 2022):
Median year renter moved in (as recorded in 2022):
| Belle Isle: | 1999 |
| Richmond: | 2011 |
Median year renter moved in (as recorded in 2022):
| Belle Isle: | 2017 |
| Richmond: | 2020 |
Percentage of married-couple families with both working:
| Belle Isle: | 100.0% |
| Richmond: | 80.3% |
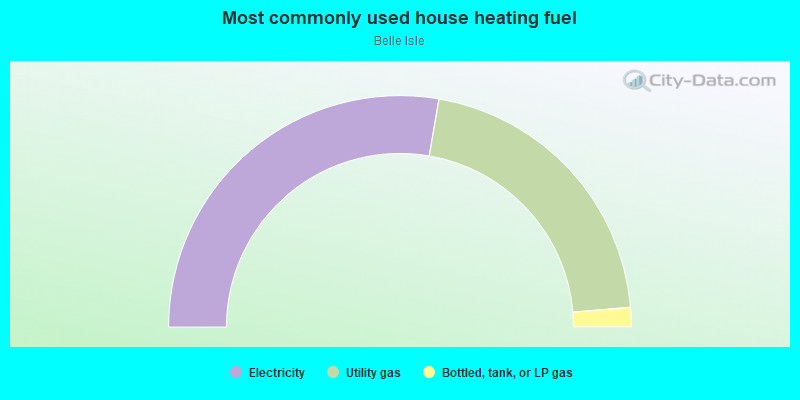
- 55.4%Electricity
- 41.9%Utility gas
- 2.7%Bottled, tank, or LP gas
Highways in this neighborhood:
US Hwy 1 (US Hwy 301)
Length: 0.16 miles
Direction: N-S
Direction: N-S
Railroad features:
Norfolk Southern Rlwy
Length: 0.53 miles
Directions: E-W, N-S, SW-NE
Directions: E-W, N-S, SW-NE