Bellingham Square (Bellingham Square Historic District) neighborhood in Chelsea, Massachusetts (MA), 02150 detailed profile
Settings
X

Business Search - 14 Million verified businesses
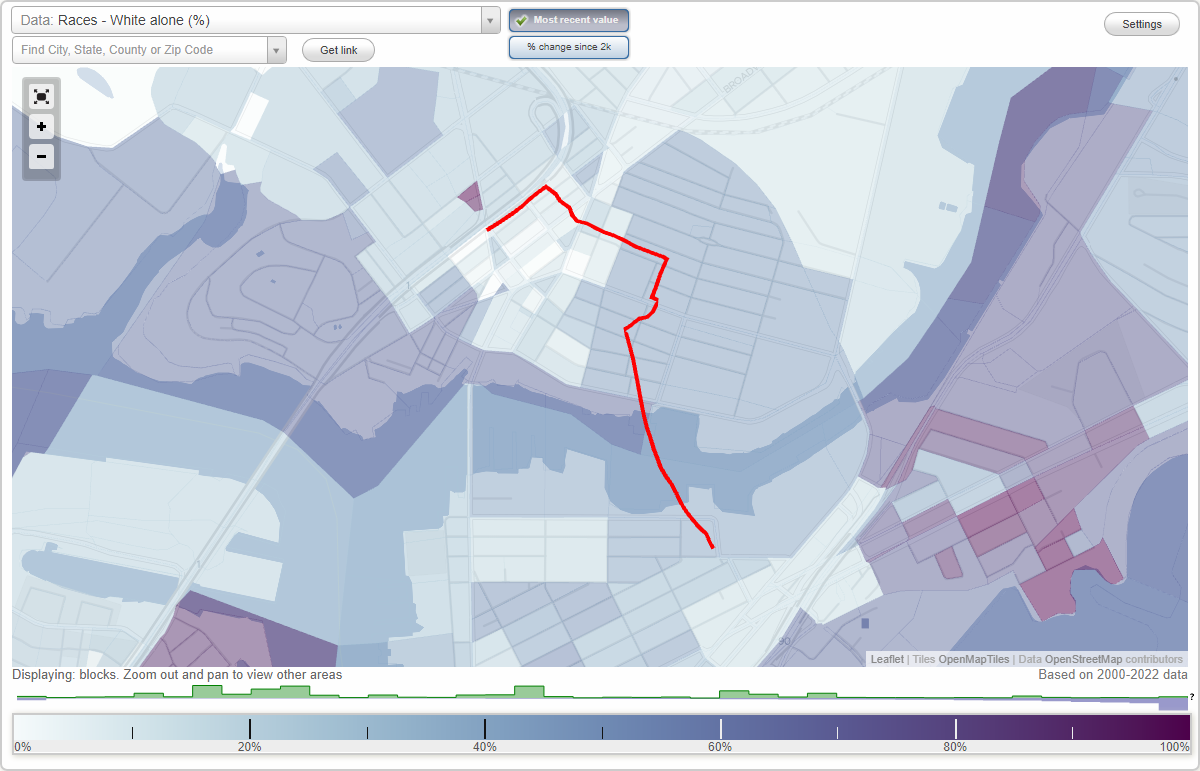
Area: 0.076 square miles
Population: 3,596
Population density:
| Bellingham Square (Bellingham Square Historic District): | 47,550 people per square mile |
| Chelsea: | 18,236 people per square mile |

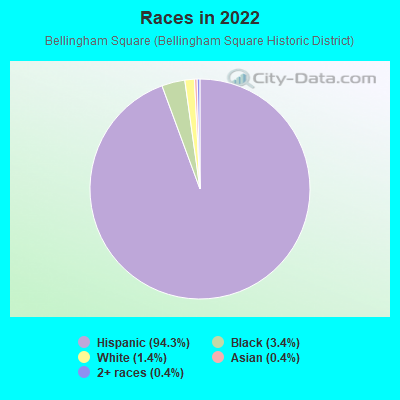
- 3,45294.3%Hispanic or Latino
- 1243.4%Black
- 531.4%White
- 140.4%Asian
- 130.4%Two or more races
- 30.08%Some other race
Median household income in 2022:
| Bellingham Square (Bellingham Square Historic District): | $63,281 |
| Chelsea: | $71,051 |
Distribution of median household income
![Distribution of median household income]()
- 52Less than $10,000
- 130$10,000 to $19,999
- 21$20,000 to $29,999
- 125$30,000 to $39,999
- 183$40,000 to $49,999
- 27$50,000 to $59,999
- 151$60,000 to $74,999
- 112$75,000 to $99,999
- 246$100,000 to $124,999
- 39$125,000 to $149,999
- 20$150,000 to $199,999
- 75$200,000 or more

Distribution of owner-occupied house/condo value
![Distribution of owner-occupied house/condo value]()
- 2Less than $50,000
- 3$200,000 to $249,999
- 14$250,000 to $299,999
- 16$300,000 to $399,999
- 70$400,000 to $499,999
- 7$500,000 to $749,999
- 6$750,000 to $999,999
- 9$1,000,000 or more

Distribution of rent paid by renters
![Distribution of rent paid by renters]()
- 8$100 to $199
- 27$200 to $299
- 85$300 to $399
- 18$400 to $499
- 14$500 to $599
- 8$600 to $699
- 52$700 to $799
- 13$900 to $999
- 51$1,000 to $1,249
- 154$1,250 to $1,499
- 358$1,500 to $1,999
- 331$2,000 or more

Median rent in 2022:
| Bellingham Square (Bellingham Square Historic District): | $1,673 |
| Chelsea: | $1,630 |
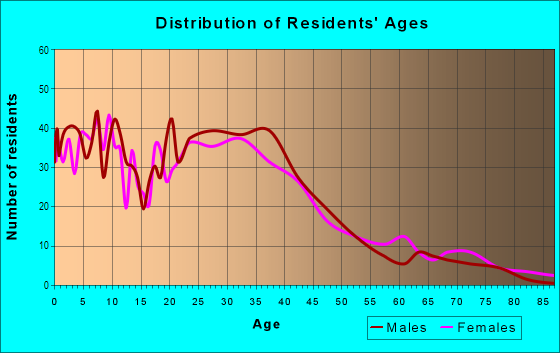
| Males: | 1,656 |
| Females: | 1,939 |
Males:
| This neighborhood: | 40.0 years |
| Whole city: | 34.6 years |
| This neighborhood: | 30.9 years |
| Whole city: | 34.3 years |
Average household size:
| Bellingham Square (Bellingham Square Historic District): | 3.6 people |
| Chelsea: | 2.9 people |
Percentage of family households:
| Bellingham Square (Bellingham Square Historic District): | 58.8% |
| Chelsea: | 44.9% |
| Here: | 51.6% |
| Chelsea: | 32.4% |
Percentage of married-couple families with children (among all households):
| Bellingham Square (Bellingham Square Historic District): | 19.6% |
| Chelsea: | 18.1% |
Percentage of single-mother households (among all households):
| Bellingham Square (Bellingham Square Historic District): | 8.9% |
| Chelsea: | 11.5% |
Percentage of never married males 15 years old and over:
Percentage of never married females 15 years old and over:
| Bellingham Square (Bellingham Square Historic District): | 23.5% |
| Chelsea: | 26.4% |
Percentage of never married females 15 years old and over:
| Bellingham Square (Bellingham Square Historic District): | 16.6% |
| city: | 20.3% |
Percentage of people that speak English not well or not at all:
| Bellingham Square (Bellingham Square Historic District): | 50.7% |
| Chelsea: | 29.0% |
Percentage of people born in this state:
Percentage of people born in another U.S. state:
Percentage of native residents but born outside the U.S.:
Percentage of foreign born residents:
| Here: | 36.1% |
| Chelsea: | 39.3% |
Percentage of people born in another U.S. state:
| Bellingham Square (Bellingham Square Historic District): | 4.2% |
| Chelsea: | 7.2% |
Percentage of native residents but born outside the U.S.:
| Here: | 4.3% |
| city: | 6.5% |
Percentage of foreign born residents:
| Here: | 55.5% |
| Chelsea: | 47.0% |
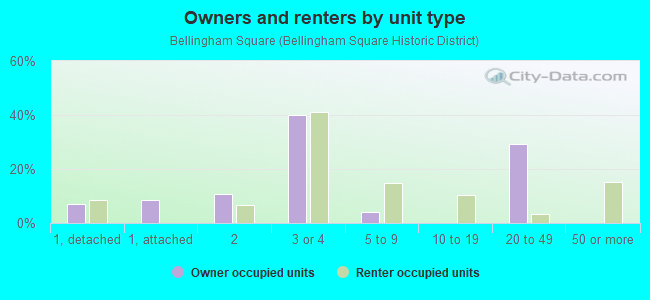
Owner-occupied
Renter-occupied

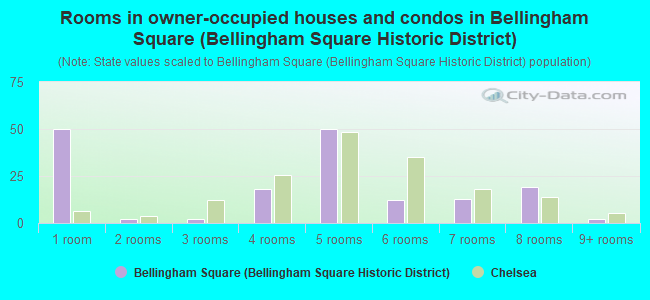
- Rooms in owner-occupied houses and condos in Bellingham Square <
> - 501 room
- 22 rooms
- 23 rooms
- 184 rooms
- 505 rooms
- 126 rooms
- 137 rooms
- 198 rooms
- 29+ rooms
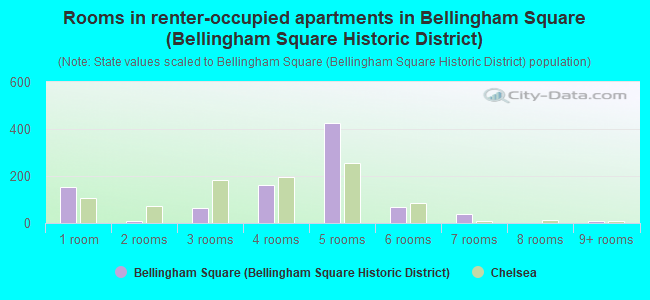
- Rooms in renter-occupied apartments in Bellingham Square <
> - 1541 room
- 82 rooms
- 643 rooms
- 1624 rooms
- 4265 rooms
- 676 rooms
- 387 rooms
- 28 rooms
- 99+ rooms
Owner-occupied
Renter-occupied
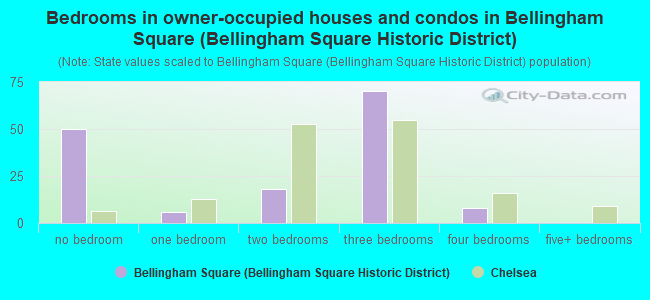
- Bedrooms in owner-occupied houses and condos in Bellingham Square <
> - 50no bedroom
- 61 bedroom
- 182 bedrooms
- 703 bedrooms
- 84 bedrooms
- 05+ bedrooms
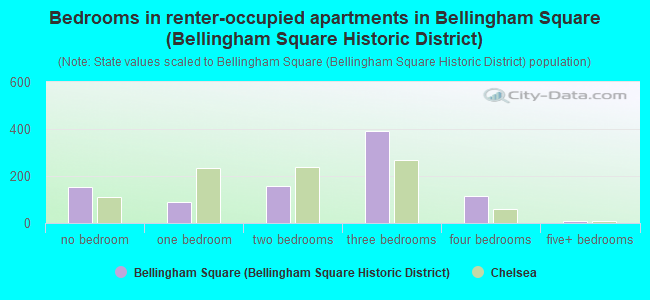
- Bedrooms in renter-occupied apartments in Bellingham Square <
> - 154no bedroom
- 891 bedroom
- 1592 bedrooms
- 3923 bedrooms
- 1154 bedrooms
- 95+ bedrooms
Average number of cars or other vehicles available in houses/condos:
Average number of cars or other vehicles available in apartments:
| This neighborhood: | 1.1 |
| Chelsea: | 1.6 |
Average number of cars or other vehicles available in apartments:
| Here: | 0.3 |
| city: | 0.9 |
Percentage of units with a mortgage:
| Bellingham Square (Bellingham Square Historic District): | 83.0% |
| Chelsea: | 73.0% |
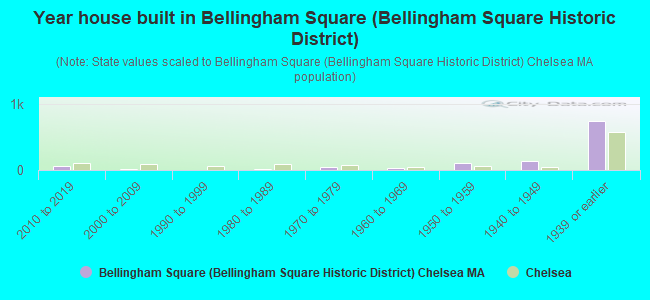
- Year house built in Bellingham Square <
> - 02020 or later
- 632010 to 2019
- 172000 to 2009
- 51990 to 1999
- 151980 to 1989
- 431970 to 1979
- 241960 to 1969
- 1001950 to 1959
- 1301940 to 1949
- 7361939 or earlier
City-data.com crime index for city in 2020 (higher means more crime):
| City: | 233.3 |
| U.S. average: | 219.5 |
Travel time to work (commute)
![Travel time to work (commute)]()
- 5Less than 5 minutes
- 2075 to 9 minutes
- 13710 to 14 minutes
- 27615 to 19 minutes
- 32720 to 24 minutes
- 7125 to 29 minutes
- 18030 to 34 minutes
- 1235 to 39 minutes
- 7740 to 44 minutes
- 12745 to 59 minutes
- 27860 to 89 minutes
- 13990 or more minutes

Means of transportation to work
![Means of transportation to work]()
- 21.9%338Drove a car alone
- 20.4%316Carpooled
- 23.3%361Bus
- 15.6%242Subway or elevated rail
- 0.6%10Long-distance train or commuter rail
- 12.5%194Taxi
- 4.1%64Bicycle
- 7.9%122Walked
- 4.3%67Other means
- 8.0%124Worked at home

Time leaving home to go to work
![Time leaving home to go to work]()
- 10312:00 a.m. to 4:59 a.m.
- 515:00 a.m. to 5:29 a.m.
- 2765:30 a.m. to 5:59 a.m.
- 1206:00 a.m. to 6:29 a.m.
- 436:30 a.m. to 6:59 a.m.
- 2147:00 a.m. to 7:29 a.m.
- 837:30 a.m. to 7:59 a.m.
- 1618:00 a.m. to 8:29 a.m.
- 1128:30 a.m. to 8:59 a.m.
- 1849:00 a.m. to 9:59 a.m.
- 14910:00 a.m. to 10:59 a.m.
- 911:00 a.m. to 11:59 a.m.
- 24512:00 p.m. to 3:59 p.m.
- 1774:00 p.m. to 11:59 p.m.

Occupations of males:
- Percentage of males in management occupations (except farmers):
Here: 2.6% city: 6.5%
- Percentage of males in business and financial operations occupations:
Here: 8.7% city: 3.0%
- Percentage of males in computer and mathematical occupations:
Here: 1.1% city: 4.0%
- Percentage of males in education, training, and library occupations:
Here: 1.1% city: 1.6%
- Percentage of males in service occupations:
Here: 25.2% city: 22.9%
- Percentage of males in sales and office occupations:
Here: 3.9% city: 15.0%
- Percentage of males in farming, fishing, and forestry occupations:
Here: 1.7% city: 0.6%
- Percentage of males in construction, extraction, and maintenance occupations:
Here: 30.2% city: 15.6%
- Percentage of males in production occupations:
Here: 4.5% city: 6.6%
- Percentage of males in transportation occupations:
Here: 8.1% city: 8.0%
- Percentage of males in material moving occupations:
Here: 13.5% city: 8.4%
Occupations of females:
- Percentage of females in business and financial operations occupations:
Here: 1.1% city: 3.6%
- Percentage of females in education, training, and library occupations:
Here: 4.2% city: 5.7%
- Percentage of females in arts, design, entertainment, sports, and media occupations:
Here: 1.2% city: 2.0%
- Percentage of females in healthcare practitioners and technical occupations:
Here: 1.7% city: 7.0%
- Percentage of females in service occupations:
Here: 57.8% city: 35.1%
- Percentage of females in sales and office occupations:
Here: 12.6% city: 22.9%
- Percentage of females in farming, fishing, and forestry occupations:
Here: 3.5% city: 0.9%
- Percentage of females in production occupations:
Here: 13.8% city: 6.6%
- Percentage of females in material moving occupations:
Here: 3.4% city: 3.5%
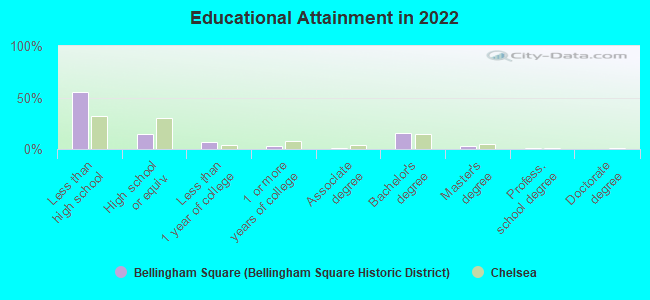
Education in this neighborhood (subdivision or community):
- Percentage of people 3 years and older in K-12 schools:
Bellingham Square (Bellingham Square Historic District): 40.3% Chelsea: 16.8%
- Percentage of people 3 years and older in undergraduate colleges:
Bellingham Square (Bellingham Square Historic District): 5.3% Chelsea: 3.9%
- Percentage of people 3 years and older in grad. or professional schools:
Bellingham Square (Bellingham Square Historic District): 0.9% Chelsea: 1.5%
- Percentage of students K-12 enrolled in private schools:
Bellingham Square (Bellingham Square Historic District): 0.7% Chelsea: 5.6%
Percentage of population below poverty level:
| Bellingham Square (Bellingham Square Historic District): | 24.7% |
| Chelsea: | 21.4% |
Median year renter moved in (as recorded in 2022):
| Bellingham Square (Bellingham Square Historic District): | 2015 |
| Chelsea: | 2016 |
Percentage of married-couple families with both working:
| Bellingham Square (Bellingham Square Historic District): | 130.7% |
| Chelsea: | 69.9% |
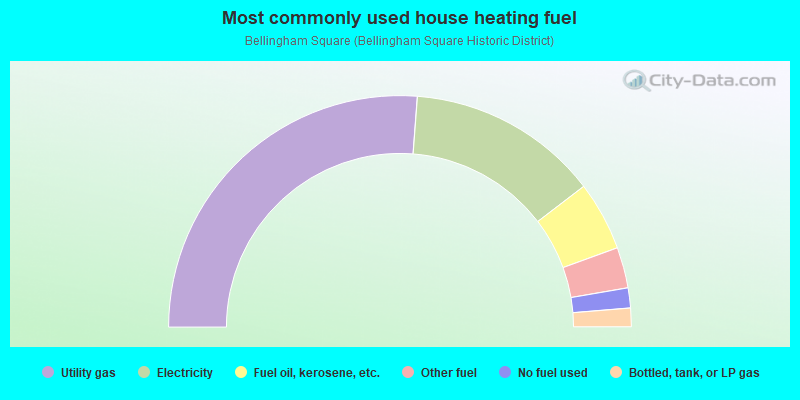
- 52.4%Utility gas
- 26.8%Electricity
- 9.7%Fuel oil, kerosene, etc.
- 5.7%Other fuel
- 2.8%No fuel used
- 2.6%Bottled, tank, or LP gas
Roads and streets:
Congress Ave
Length: 0.42 miles
Directions: E-W, SE-NW
Address range: 1 to 166
Directions: E-W, SE-NW
Address range: 1 to 166
Central Ave
Length: 0.26 miles
Direction: E-W
Address range: 1 to 96
Direction: E-W
Address range: 1 to 96
Chester Ave
Length: 0.24 miles
Directions: E-W, SE-NW
Address range: 1 to 78
Directions: E-W, SE-NW
Address range: 1 to 78
Division St
Length: 0.21 miles
Directions: E-W, SW-NE
Address range: 113 to 199
Directions: E-W, SW-NE
Address range: 113 to 199
Maverick St
Length: 0.20 miles
Direction: E-W
Address range: 1 to 62
Direction: E-W
Address range: 1 to 62
Shurtleff St
Length: 0.19 miles
Direction: SW-NE
Address range: 64 to 154
Direction: SW-NE
Address range: 64 to 154
Hawthorne St
Length: 0.19 miles
Direction: SW-NE
Address range: 71 to 149
Direction: SW-NE
Address range: 71 to 149
Shawmut St
Length: 0.19 miles
Directions: N-S, SW-NE
Address range: 56 to 133
Directions: N-S, SW-NE
Address range: 56 to 133
Pearl St
Length: 0.15 miles
Directions: E-W, SW-NE
Address range: 138 to 199
Directions: E-W, SW-NE
Address range: 138 to 199
Chestnut St
Length: 0.14 miles
Direction: SW-NE
Address range: 144 to 198
Direction: SW-NE
Address range: 144 to 198
Lynn St
Length: 0.14 miles
Direction: SW-NE
Address range: 1 to 99
Direction: SW-NE
Address range: 1 to 99
4th St
Length: 0.14 miles
Direction: SE-NW
Address range: 1 to 53
Direction: SE-NW
Address range: 1 to 53
Broadway
Length: 0.13 miles
Direction: SW-NE
Address range: 267 to 360
Direction: SW-NE
Address range: 267 to 360
Cherry St
Length: 0.13 miles
Direction: SW-NE
Address range: 115 to 199
Direction: SW-NE
Address range: 115 to 199
Park St
Length: 0.10 miles
Direction: E-W
Address range: 135 to 199
Direction: E-W
Address range: 135 to 199
3rd St
Length: 0.07 miles
Direction: SE-NW
Address range: 1 to 28
Direction: SE-NW
Address range: 1 to 28
Hawthorn Ave
Length: 0.06 miles
Direction: E-W
Direction: E-W