Birmingham Estates neighborhood in Birmingham, Michigan (MI), 48009 detailed profile
Settings
X

Business Search - 14 Million verified businesses
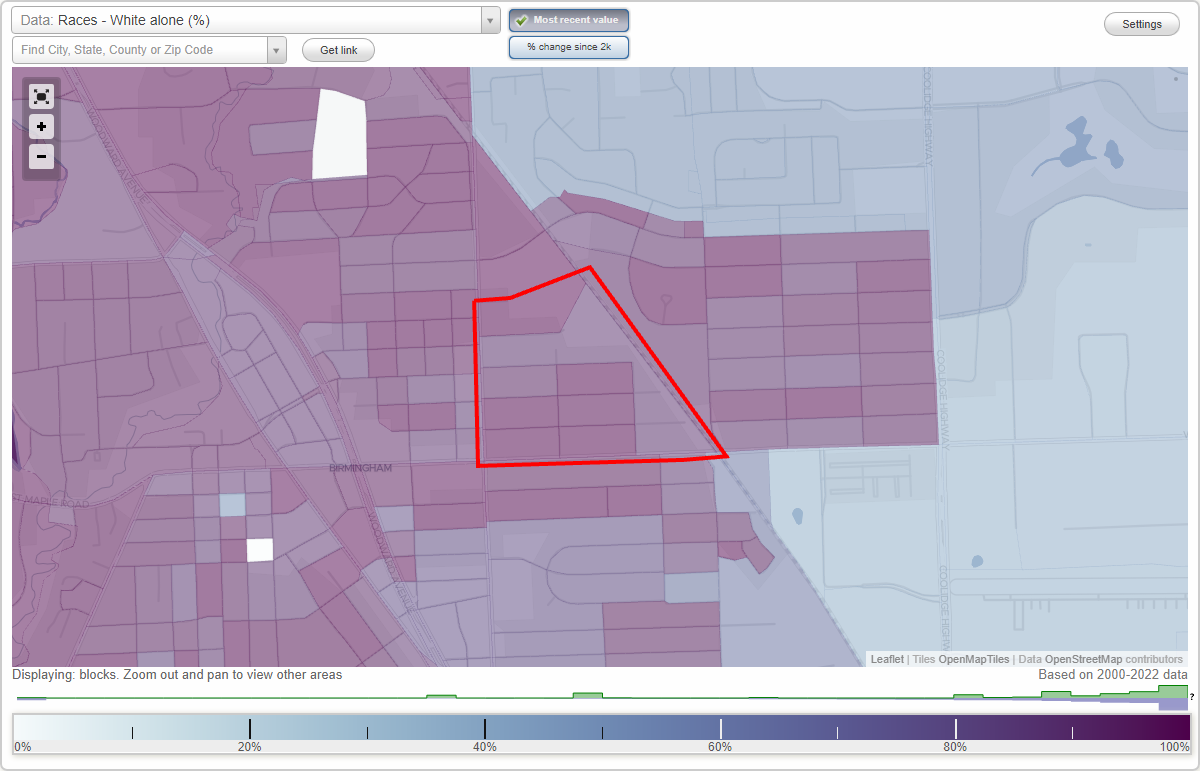
Area: 0.160 square miles
Population: 638
Population density:
| Birmingham Estates: | 3,984 people per square mile |
| Birmingham: | 4,551 people per square mile |

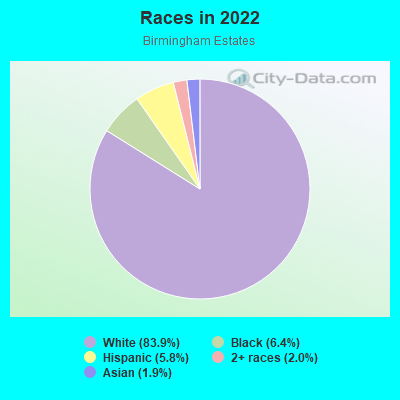
- 53583.9%White
- 416.4%Black
- 375.8%Hispanic or Latino
- 132.0%Two or more races
- 121.9%Asian
Median household income in 2022:
| Birmingham Estates: | $133,275 |
| Birmingham: | $151,556 |
Distribution of median household income
![Distribution of median household income]()
- 8Less than $10,000
- 20$10,000 to $19,999
- 21$20,000 to $29,999
- 68$30,000 to $39,999
- 20$40,000 to $49,999
- 25$50,000 to $59,999
- 23$60,000 to $74,999
- 40$75,000 to $99,999
- 15$100,000 to $124,999
- 37$125,000 to $149,999
- 34$150,000 to $199,999
- 78$200,000 or more

Distribution of owner-occupied house/condo value
![Distribution of owner-occupied house/condo value]()
- 5Less than $50,000
- 5$50,000 to $99,999
- 7$100,000 to $149,999
- 25$150,000 to $199,999
- 16$200,000 to $249,999
- 29$250,000 to $299,999
- 7$300,000 to $399,999
- 8$400,000 to $499,999
- 41$500,000 to $749,999
- 79$750,000 to $999,999
- 17$1,000,000 or more

Distribution of rent paid by renters
![Distribution of rent paid by renters]()
- 12$200 to $299
- 5$500 to $599
- 6$600 to $699
- 24$700 to $799
- 7$800 to $899
- 48$900 to $999
- 39$1,000 to $1,249
- 34$1,250 to $1,499
- 12$1,500 to $1,999
- 39$2,000 or more

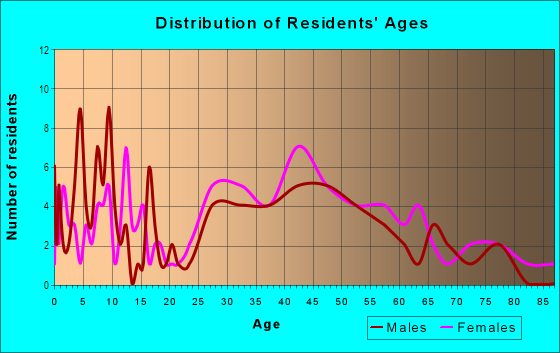
| Males: | 316 |
| Females: | 322 |
Males:
| This neighborhood: | 37.3 years |
| Whole city: | 41.0 years |
| This neighborhood: | 36.0 years |
| Whole city: | 43.2 years |
Average household size:
| Birmingham Estates: | 7.9 people |
| Birmingham: | 2.3 people |
Percentage of family households:
| Birmingham Estates: | 43.0% |
| Birmingham: | 43.8% |
| Here: | 46.1% |
| Birmingham: | 50.8% |
Percentage of married-couple families with children (among all households):
| Birmingham Estates: | 35.3% |
| Birmingham: | 35.7% |
Percentage of single-mother households (among all households):
| Birmingham Estates: | 6.0% |
| Birmingham: | 5.2% |
Percentage of never married males 15 years old and over:
Percentage of never married females 15 years old and over:
| Birmingham Estates: | 13.6% |
| Birmingham: | 12.6% |
Percentage of never married females 15 years old and over:
| Birmingham Estates: | 17.5% |
| city: | 13.4% |
Percentage of people that speak English not well or not at all:
| Birmingham Estates: | 0.0% |
| Birmingham: | 0.2% |
Percentage of people born in this state:
Percentage of people born in another U.S. state:
Percentage of native residents but born outside the U.S.:
Percentage of foreign born residents:
| Here: | 69.6% |
| Birmingham: | 65.9% |
Percentage of people born in another U.S. state:
| Birmingham Estates: | 22.5% |
| Birmingham: | 21.8% |
Percentage of native residents but born outside the U.S.:
| Here: | 1.1% |
| city: | 1.5% |
Percentage of foreign born residents:
| Here: | 6.8% |
| Birmingham: | 10.8% |
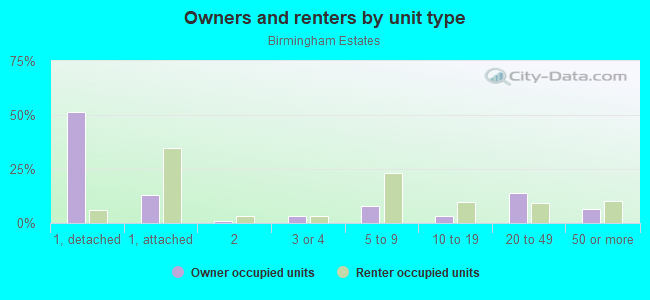
Owner-occupied
Renter-occupied

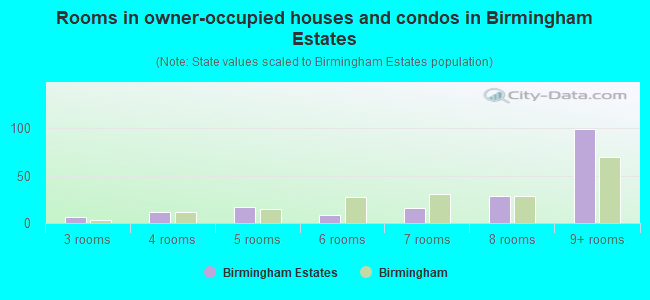
- Rooms in owner-occupied houses and condos in Birmingham Estates
- 01 room
- 02 rooms
- 63 rooms
- 124 rooms
- 175 rooms
- 86 rooms
- 167 rooms
- 288 rooms
- 999+ rooms
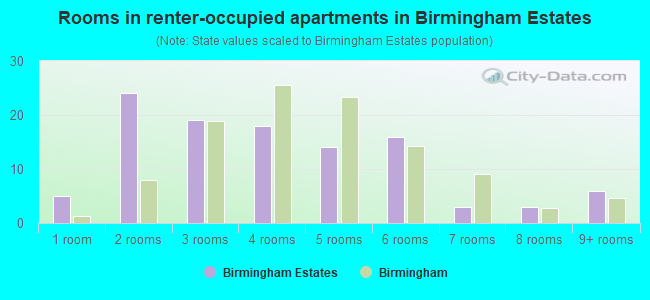
- Rooms in renter-occupied apartments in Birmingham Estates
- 51 room
- 242 rooms
- 193 rooms
- 184 rooms
- 145 rooms
- 166 rooms
- 37 rooms
- 38 rooms
- 69+ rooms
Owner-occupied
Renter-occupied
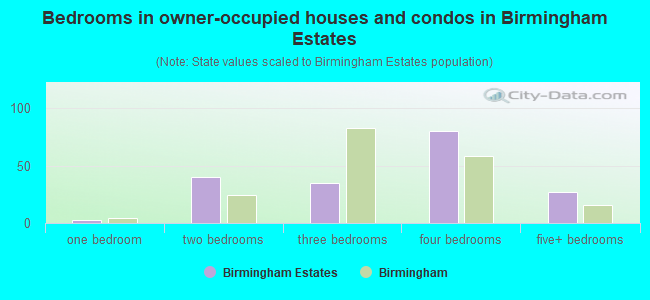
- Bedrooms in owner-occupied houses and condos in Birmingham Estates
- 0no bedroom
- 31 bedroom
- 402 bedrooms
- 353 bedrooms
- 804 bedrooms
- 275+ bedrooms
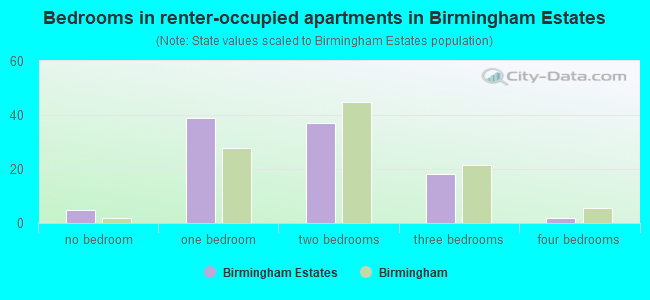
- Bedrooms in renter-occupied apartments in Birmingham Estates
- 5no bedroom
- 391 bedroom
- 372 bedrooms
- 183 bedrooms
- 24 bedrooms
- 05+ bedrooms
Average number of cars or other vehicles available in houses/condos:
Average number of cars or other vehicles available in apartments:
| This neighborhood: | 2.1 |
| Birmingham: | 1.9 |
Average number of cars or other vehicles available in apartments:
| Here: | 1.2 |
| city: | 1.2 |
Percentage of units with a mortgage:
| Birmingham Estates: | 68.6% |
| Birmingham: | 69.3% |
Housing prices:
- Average estimated value of detached houses in 2022 (50.2% of all units):
Birmingham Estates: $681,741 Michigan: $280,038
- Average estimated value of townhouses or other attached units in 2022 (4.2% of all units):
This neighborhood: $571,136 Michigan: $239,520
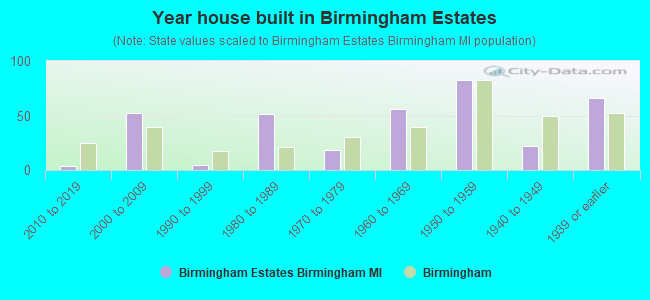
- Year house built in Birmingham Estates
- 02020 or later
- 42010 to 2019
- 522000 to 2009
- 51990 to 1999
- 511980 to 1989
- 181970 to 1979
- 561960 to 1969
- 831950 to 1959
- 221940 to 1949
- 661939 or earlier
City-data.com crime index for city in 2020 (higher means more crime):
| City: | 27.8 |
| U.S. average: | 219.5 |
Travel time to work (commute)
![Travel time to work (commute)]()
- 21Less than 5 minutes
- 405 to 9 minutes
- 2110 to 14 minutes
- 4715 to 19 minutes
- 4520 to 24 minutes
- 1625 to 29 minutes
- 3230 to 34 minutes
- 1435 to 39 minutes
- 1640 to 44 minutes
- 1345 to 59 minutes
- 2060 to 89 minutes
- 590 or more minutes

Means of transportation to work
![Means of transportation to work]()
- 70.5%225Drove a car alone
- 8.1%26Carpooled
- 5.0%16Bus
- 1.3%4Motorcycle
- 1.6%5Bicycle
- 0.9%3Walked
- 0.9%3Other means
- 25.7%82Worked at home

Time leaving home to go to work
![Time leaving home to go to work]()
- 112:00 a.m. to 4:59 a.m.
- 35:00 a.m. to 5:29 a.m.
- 45:30 a.m. to 5:59 a.m.
- 96:00 a.m. to 6:29 a.m.
- 266:30 a.m. to 6:59 a.m.
- 497:00 a.m. to 7:29 a.m.
- 527:30 a.m. to 7:59 a.m.
- 748:00 a.m. to 8:29 a.m.
- 238:30 a.m. to 8:59 a.m.
- 179:00 a.m. to 9:59 a.m.
- 1110:00 a.m. to 10:59 a.m.
- 411:00 a.m. to 11:59 a.m.
- 1912:00 p.m. to 3:59 p.m.
- 34:00 p.m. to 11:59 p.m.

Occupations of males:
- Percentage of males in management occupations (except farmers):
Here: 13.1% city: 28.7%
- Percentage of males in business and financial operations occupations:
Here: 22.9% city: 10.2%
- Percentage of males in computer and mathematical occupations:
Here: 6.3% city: 3.1%
- Percentage of males in architecture and engineering occupations:
Here: 15.4% city: 6.7%
- Percentage of males in life, physical, and social science occupations:
Here: 2.0% city: 0.6%
- Percentage of males in legal occupations:
Here: 17.9% city: 9.5%
- Percentage of males in education, training, and library occupations:
Here: 6.4% city: 2.3%
- Percentage of males in healthcare practitioners and technical occupations:
Here: 5.4% city: 7.4%
- Percentage of males in sales and office occupations:
Here: 5.3% city: 14.1%
- Percentage of males in production occupations:
Here: 1.1% city: 2.0%
- Percentage of males in material moving occupations:
Here: 3.5% city: 1.3%
Occupations of females:
- Percentage of females in management occupations (except farmers):
Here: 5.4% city: 17.0%
- Percentage of females in business and financial operations occupations:
Here: 21.1% city: 12.9%
- Percentage of females in computer and mathematical occupations:
Here: 1.3% city: 2.4%
- Percentage of females in architecture and engineering occupations:
Here: 6.7% city: 2.2%
- Percentage of females in community and social services occupations:
Here: 3.4% city: 2.7%
- Percentage of females in legal occupations:
Here: 6.6% city: 6.0%
- Percentage of females in education, training, and library occupations:
Here: 4.2% city: 5.7%
- Percentage of females in arts, design, entertainment, sports, and media occupations:
Here: 2.6% city: 3.0%
- Percentage of females in healthcare practitioners and technical occupations:
Here: 4.6% city: 13.7%
- Percentage of females in service occupations:
Here: 14.0% city: 13.1%
- Percentage of females in sales and office occupations:
Here: 29.9% city: 19.7%
- Percentage of females in production occupations:
Here: 1.4% city: 0.9%
Percentage of people 16-64 in Armed Forces:
| Birmingham Estates: | 0.1% |
| Birmingham: | 0.1% |
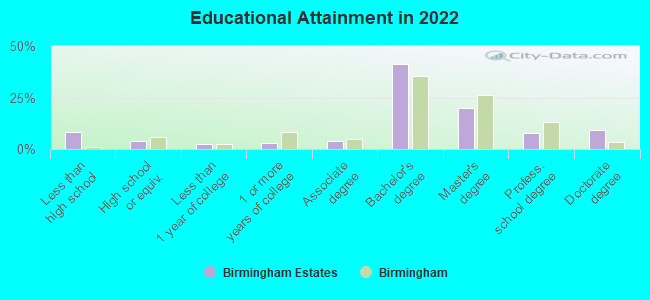
Education in this neighborhood (subdivision or community):
- Percentage of people 3 years and older in K-12 schools:
Birmingham Estates: 16.6% Birmingham: 20.3%
- Percentage of people 3 years and older in undergraduate colleges:
Birmingham Estates: 2.8% Birmingham: 1.7%
- Percentage of people 3 years and older in grad. or professional schools:
Birmingham Estates: 4.1% Birmingham: 1.1%
- Percentage of students K-12 enrolled in private schools:
Birmingham Estates: 34.3% Birmingham: 22.5%
Percentage of population below poverty level:
| Birmingham Estates: | 2.8% |
| Birmingham: | 5.5% |
Median year owner moved in (as recorded in 2022):
| Birmingham Estates: | 2006 |
| Birmingham: | 2009 |
Percentage of married-couple families with both working:
| Birmingham Estates: | 84.3% |
| Birmingham: | 71.9% |
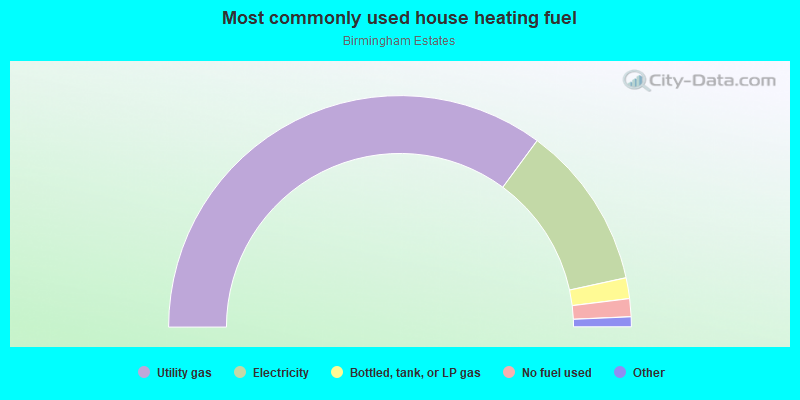
- 70.2%Utility gas
- 23.0%Electricity
- 2.9%Bottled, tank, or LP gas
- 2.5%No fuel used
- 0.7%Fuel oil, kerosene, etc.
- 0.7%Other fuel
Roads and streets:
E Maple Rd
Length: 0.69 miles
Direction: E-W
Address range: 1100 to 1999
Direction: E-W
Address range: 1100 to 1999
Yorkshire Rd
Length: 0.60 miles
Direction: E-W
Address range: 1100 to 1948
Direction: E-W
Address range: 1100 to 1948
Dorchester Rd
Length: 0.53 miles
Direction: E-W
Address range: 1100 to 1898
Direction: E-W
Address range: 1100 to 1898
Buckingham Rd
Length: 0.45 miles
Directions: E-W, SE-NW
Address range: 1154 to 1699
Directions: E-W, SE-NW
Address range: 1154 to 1699
N Adams Rd
Length: 0.35 miles
Direction: N-S
Address range: 100 to 702
Direction: N-S
Address range: 100 to 702
Westboro
Length: 0.26 miles
Directions: E-W, SW-NE
Address range: 1100 to 1426
Directions: E-W, SW-NE
Address range: 1100 to 1426
Cambridge St
Length: 0.24 miles
Directions: N-S, SE-NW, SW-NE
Address range: 100 to 499
Directions: N-S, SE-NW, SW-NE
Address range: 100 to 499
Rugby St
Length: 0.20 miles
Direction: N-S
Address range: 100 to 1399
Direction: N-S
Address range: 100 to 1399
Manchester St
Length: 0.11 miles
Direction: E-W
Address range: 1100 to 1499
Direction: E-W
Address range: 1100 to 1499
Railroad features:
Grand Funk Western RR
Length: 0.53 miles
Direction: SE-NW
Direction: SE-NW