Bishop Park neighborhood in Lincoln, Nebraska (NE), 68502, 68516 detailed profile
Settings
X

Business Search - 14 Million verified businesses
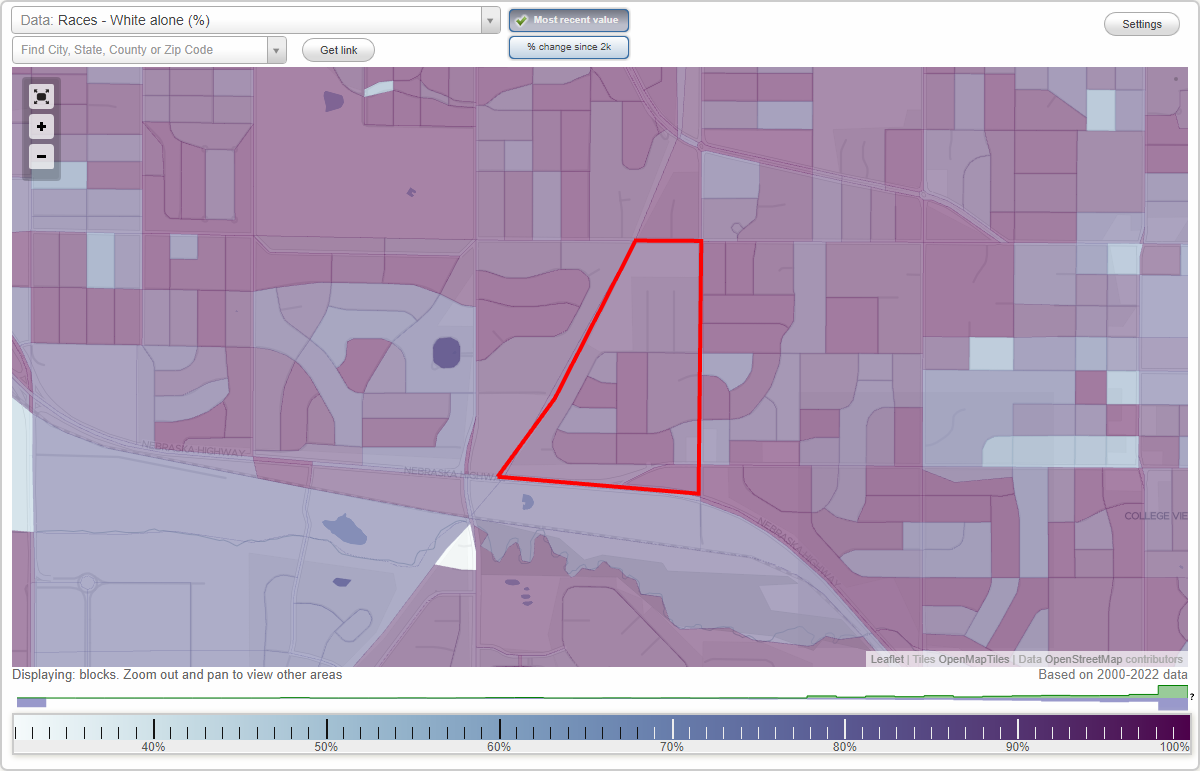
Area: 0.160 square miles
Population: 578
Population density:
| Bishop Park: | 3,603 people per square mile |
| Lincoln: | 3,920 people per square mile |

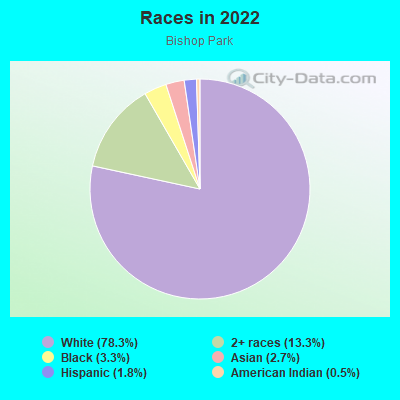
- 47078.3%White
- 8013.3%Two or more races
- 203.3%Black
- 162.7%Asian
- 111.8%Hispanic or Latino
- 30.5%American Indian
Median household income in 2022:
| Bishop Park: | $104,957 |
| Lincoln: | $62,391 |
Distribution of median household income
![Distribution of median household income]()
- 15Less than $10,000
- 8$10,000 to $19,999
- 38$20,000 to $29,999
- 25$30,000 to $39,999
- 108$40,000 to $49,999
- 10$50,000 to $59,999
- 15$60,000 to $74,999
- 90$75,000 to $99,999
- 12$100,000 to $124,999
- 13$125,000 to $149,999
- 72$150,000 to $199,999
- 6$200,000 or more

Distribution of owner-occupied house/condo value
![Distribution of owner-occupied house/condo value]()
- 16Less than $50,000
- 37$50,000 to $99,999
- 15$100,000 to $149,999
- 21$150,000 to $199,999
- 49$200,000 to $249,999
- 92$250,000 to $299,999
- 13$300,000 to $399,999
- 56$400,000 to $499,999
- 12$500,000 to $749,999
- 4$750,000 to $999,999
- 24$1,000,000 or more

Distribution of rent paid by renters
![Distribution of rent paid by renters]()
- 2$400 to $499
- 14$500 to $599
- 15$600 to $699
- 15$700 to $799
- 15$800 to $899
- 41$900 to $999
- 9$1,000 to $1,249
- 8$1,250 to $1,499
- 8$1,500 to $1,999

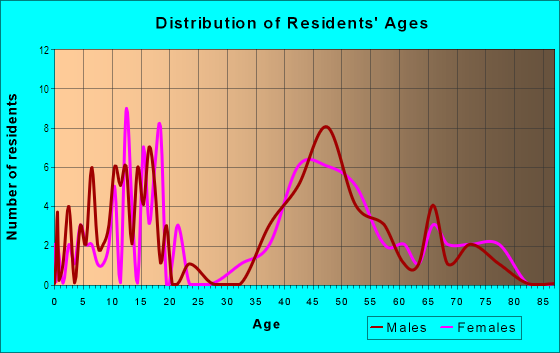
| Males: | 247 |
| Females: | 331 |
Males:
| This neighborhood: | 38.1 years |
| Whole city: | 33.1 years |
| This neighborhood: | 37.3 years |
| Whole city: | 34.8 years |
Average household size:
| Bishop Park: | 2.6 people |
| Lincoln: | 2.3 people |
Percentage of family households:
| Bishop Park: | 47.1% |
| Lincoln: | 40.9% |
| Here: | 55.1% |
| Lincoln: | 41.1% |
Percentage of married-couple families with children (among all households):
| Bishop Park: | 40.5% |
| Lincoln: | 30.9% |
Percentage of single-mother households (among all households):
| Bishop Park: | 10.7% |
| Lincoln: | 7.2% |
Percentage of never married males 15 years old and over:
Percentage of never married females 15 years old and over:
| Bishop Park: | 4.7% |
| Lincoln: | 22.0% |
Percentage of never married females 15 years old and over:
| Bishop Park: | 11.5% |
| city: | 19.2% |
Percentage of people that speak English not well or not at all:
| Bishop Park: | 0.0% |
| Lincoln: | 2.3% |
Percentage of people born in this state:
Percentage of people born in another U.S. state:
Percentage of native residents but born outside the U.S.:
Percentage of foreign born residents:
| Here: | 76.5% |
| Lincoln: | 63.9% |
Percentage of people born in another U.S. state:
| Bishop Park: | 19.5% |
| Lincoln: | 27.1% |
Percentage of native residents but born outside the U.S.:
| Here: | 0.4% |
| city: | 0.9% |
Percentage of foreign born residents:
| Here: | 4.0% |
| Lincoln: | 8.0% |
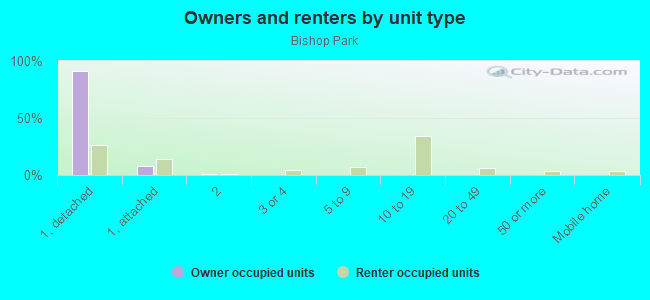
Owner-occupied
Renter-occupied

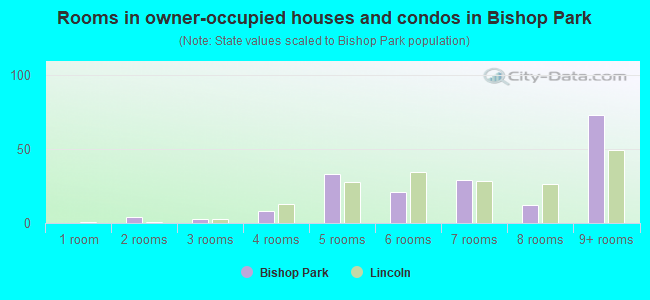
- Rooms in owner-occupied houses and condos in Bishop Park
- 01 room
- 42 rooms
- 33 rooms
- 84 rooms
- 335 rooms
- 216 rooms
- 297 rooms
- 128 rooms
- 739+ rooms
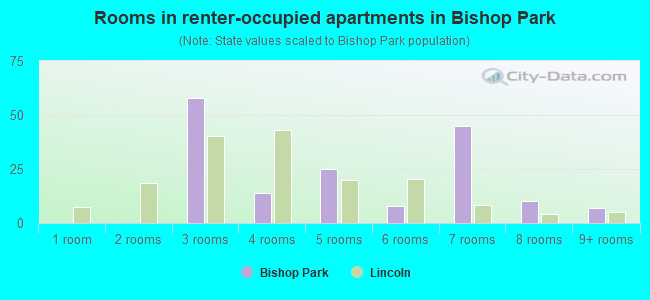
- Rooms in renter-occupied apartments in Bishop Park
- 01 room
- 02 rooms
- 583 rooms
- 144 rooms
- 255 rooms
- 86 rooms
- 457 rooms
- 108 rooms
- 79+ rooms
Owner-occupied
Renter-occupied
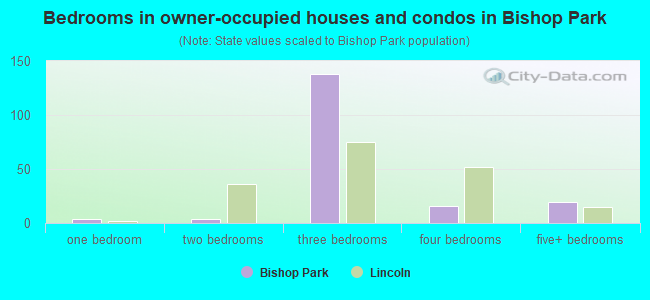
- Bedrooms in owner-occupied houses and condos in Bishop Park
- 0no bedroom
- 41 bedroom
- 42 bedrooms
- 1383 bedrooms
- 164 bedrooms
- 195+ bedrooms
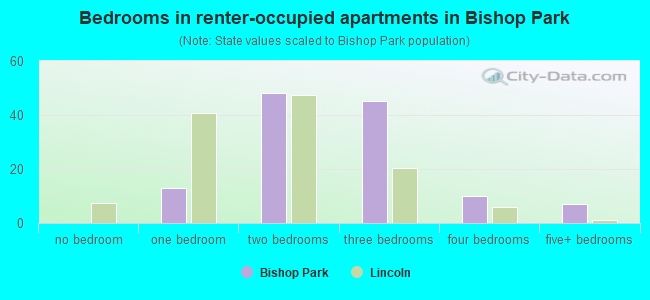
- Bedrooms in renter-occupied apartments in Bishop Park
- 0no bedroom
- 131 bedroom
- 482 bedrooms
- 453 bedrooms
- 104 bedrooms
- 75+ bedrooms
Average number of cars or other vehicles available in houses/condos:
Average number of cars or other vehicles available in apartments:
| This neighborhood: | 2.5 |
| Lincoln: | 2.0 |
Average number of cars or other vehicles available in apartments:
| Here: | |
| city: |
Percentage of units with a mortgage:
| Bishop Park: | 56.6% |
| Lincoln: | 64.4% |
Average estimated value of detached houses in 2022 (99.6% of all units):
| Bishop Park: | $249,006 |
| Lincoln: | $266,598 |
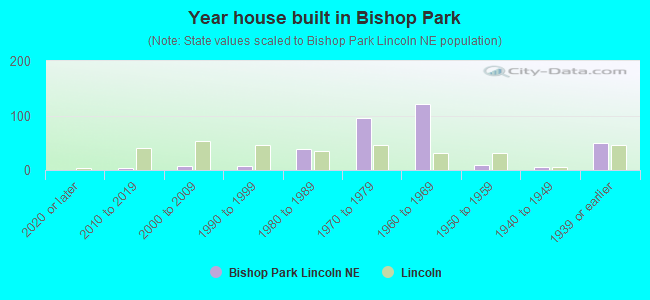
- Year house built in Bishop Park
- 02020 or later
- 42010 to 2019
- 72000 to 2009
- 81990 to 1999
- 391980 to 1989
- 961970 to 1979
- 1221960 to 1969
- 91950 to 1959
- 61940 to 1949
- 491939 or earlier
City-data.com crime index for city in 2020 (higher means more crime):
| City: | 221.6 |
| U.S. average: | 219.5 |
Travel time to work (commute)
![Travel time to work (commute)]()
- 23Less than 5 minutes
- 395 to 9 minutes
- 5410 to 14 minutes
- 5315 to 19 minutes
- 4720 to 24 minutes
- 525 to 29 minutes
- 1630 to 34 minutes
- 435 to 39 minutes
- 440 to 44 minutes
- 1445 to 59 minutes
- 160 to 89 minutes
- 190 or more minutes

Means of transportation to work
![Means of transportation to work]()
- 81.8%297Drove a car alone
- 8.3%30Carpooled
- 0.6%2Bus
- 0.3%1Motorcycle
- 4.4%16Bicycle
- 2.2%8Walked
- 0.3%1Other means
- 13.5%49Worked at home

Time leaving home to go to work
![Time leaving home to go to work]()
- 612:00 a.m. to 4:59 a.m.
- 75:00 a.m. to 5:29 a.m.
- 35:30 a.m. to 5:59 a.m.
- 246:00 a.m. to 6:29 a.m.
- 106:30 a.m. to 6:59 a.m.
- 427:00 a.m. to 7:29 a.m.
- 517:30 a.m. to 7:59 a.m.
- 358:00 a.m. to 8:29 a.m.
- 188:30 a.m. to 8:59 a.m.
- 179:00 a.m. to 9:59 a.m.
- 1210:00 a.m. to 10:59 a.m.
- 211:00 a.m. to 11:59 a.m.
- 1512:00 p.m. to 3:59 p.m.
- 84:00 p.m. to 11:59 p.m.

Occupations of males:
- Percentage of males in management occupations (except farmers):
Here: 44.3% city: 11.6%
- Percentage of males in computer and mathematical occupations:
Here: 3.5% city: 5.3%
- Percentage of males in life, physical, and social science occupations:
Here: 3.5% city: 1.8%
- Percentage of males in education, training, and library occupations:
Here: 13.4% city: 5.5%
- Percentage of males in healthcare practitioners and technical occupations:
Here: 5.5% city: 2.5%
- Percentage of males in service occupations:
Here: 15.0% city: 13.0%
- Percentage of males in sales and office occupations:
Here: 14.1% city: 15.8%
Occupations of females:
- Percentage of females in management occupations (except farmers):
Here: 2.8% city: 8.0%
- Percentage of females in business and financial operations occupations:
Here: 7.8% city: 7.5%
- Percentage of females in community and social services occupations:
Here: 4.1% city: 2.5%
- Percentage of females in education, training, and library occupations:
Here: 26.9% city: 10.7%
- Percentage of females in arts, design, entertainment, sports, and media occupations:
Here: 5.2% city: 2.3%
- Percentage of females in service occupations:
Here: 22.0% city: 21.9%
- Percentage of females in sales and office occupations:
Here: 31.1% city: 26.6%
- Percentage of females in construction, extraction, and maintenance occupations:
Here: 1.6% city: 0.3%
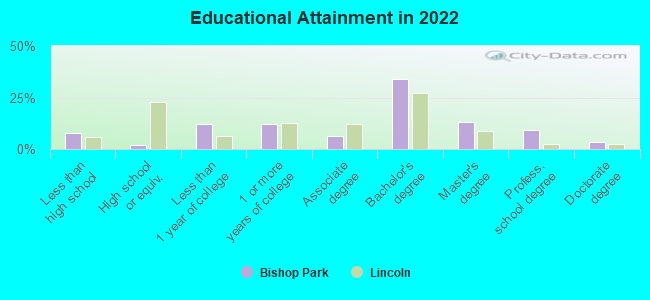
Education in this neighborhood (subdivision or community):
- Percentage of people 3 years and older in K-12 schools:
Bishop Park: 32.5% Lincoln: 16.3%
- Percentage of people 3 years and older in undergraduate colleges:
Bishop Park: 10.5% Lincoln: 10.7%
- Percentage of people 3 years and older in grad. or professional schools:
Bishop Park: 3.6% Lincoln: 2.3%
- Percentage of students K-12 enrolled in private schools:
Bishop Park: 16.9% Lincoln: 13.7%
Percentage of population below poverty level:
| Bishop Park: | 5.9% |
| Lincoln: | 14.0% |
Median year owner moved in (as recorded in 2022):
| Bishop Park: | 2006 |
| Lincoln: | 2012 |
Percentage of married-couple families with both working:
| Bishop Park: | 100.0% |
| Lincoln: | 80.4% |
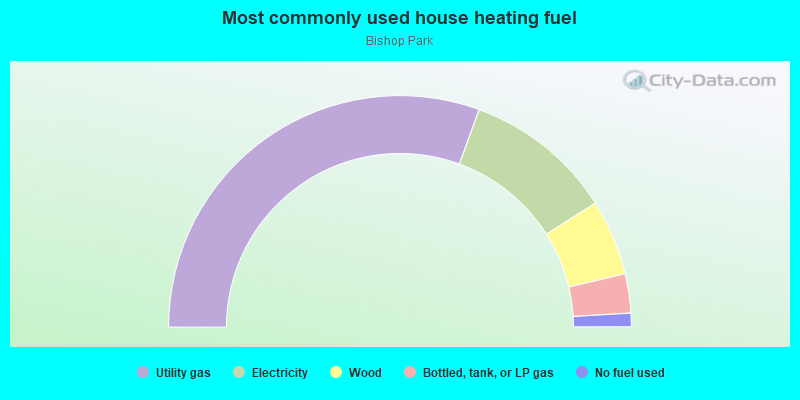
- 61.2%Utility gas
- 20.9%Electricity
- 10.6%Wood
- 5.5%Bottled, tank, or LP gas
- 1.9%No fuel used
Highways in this neighborhood:
State Hwy 2
Length: 0.35 miles
Direction: E-W
Address range: 2784 to 3160
Direction: E-W
Address range: 2784 to 3160
Roads and streets:
Loveland Dr
Length: 0.43 miles
Directions: E-W, SE-NW
Address range: 2800 to 3299
Directions: E-W, SE-NW
Address range: 2800 to 3299
Pioneers Blvd
Length: 0.38 miles
Direction: E-W
Address range: 2800 to 3299
Direction: E-W
Address range: 2800 to 3299
Teri Ln
Length: 0.33 miles
Directions: E-W, N-S, SE-NW, SW-NE
Address range: 4000 to 4299
Directions: E-W, N-S, SE-NW, SW-NE
Address range: 4000 to 4299
Prescott Ave
Length: 0.29 miles
Direction: E-W
Address range: 2900 to 3299
Direction: E-W
Address range: 2900 to 3299
S 30th St
Length: 0.25 miles
Direction: N-S
Address range: 4000 to 4299
Direction: N-S
Address range: 4000 to 4299
S 31st St
Length: 0.18 miles
Direction: N-S
Address range: 4000 to 4199
Direction: N-S
Address range: 4000 to 4199
S 32nd Pl
Length: 0.14 miles
Direction: N-S
Address range: 3700 to 3999
Direction: N-S
Address range: 3700 to 3999
S 31st Street Cir
Length: 0.14 miles
Direction: N-S
Address range: 3700 to 3999
Direction: N-S
Address range: 3700 to 3999
Mark Ave
Length: 0.13 miles
Directions: E-W, SE-NW
Address range: 2800 to 2999
Directions: E-W, SE-NW
Address range: 2800 to 2999
John Ave
Length: 0.09 miles
Direction: E-W
Address range: 2900 to 2999
Direction: E-W
Address range: 2900 to 2999
S 32nd St
Length: 0.08 miles
Directions: N-S, SE-NW
Address range: 4200 to 4299
Directions: N-S, SE-NW
Address range: 4200 to 4299
S Gate Cir
Length: 0.07 miles
Direction: E-W
Address range: 3200 to 3299
Direction: E-W
Address range: 3200 to 3299
Mary Cir
Length: 0.03 miles
Direction: E-W
Address range: 4200 to 4299
Direction: E-W
Address range: 4200 to 4299