Boise neighborhood in Portland, Oregon (OR), 97212, 97217, 97227 detailed profile
Settings
X

Business Search - 14 Million verified businesses
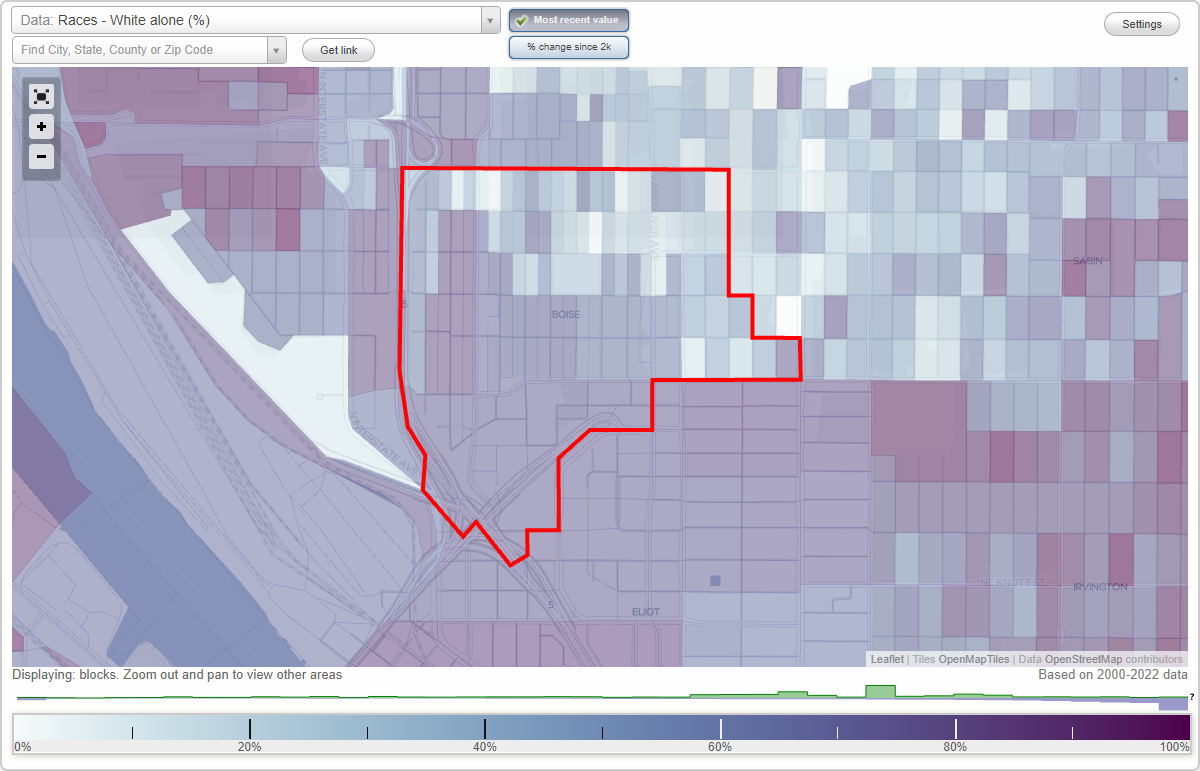
Area: 0.431 square miles
Population: 6,017
Population density:
| Boise: | 13,950 people per square mile |
| Portland: | 4,730 people per square mile |

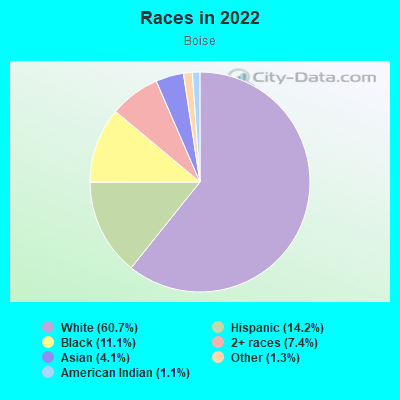
- 3,81260.7%White
- 89114.2%Hispanic or Latino
- 69411.1%Black
- 4677.4%Two or more races
- 2594.1%Asian
- 821.3%Some other race
- 701.1%American Indian
Median household income in 2022:
| Boise: | $108,587 |
| Portland: | $81,119 |
Distribution of median household income
![Distribution of median household income]()
- 116Less than $10,000
- 270$10,000 to $19,999
- 166$20,000 to $29,999
- 198$30,000 to $39,999
- 365$40,000 to $49,999
- 161$50,000 to $59,999
- 128$60,000 to $74,999
- 428$75,000 to $99,999
- 290$100,000 to $124,999
- 436$125,000 to $149,999
- 202$150,000 to $199,999
- 631$200,000 or more

Distribution of owner-occupied house/condo value
![Distribution of owner-occupied house/condo value]()
- 125Less than $50,000
- 49$50,000 to $99,999
- 59$150,000 to $199,999
- 798$250,000 to $299,999
- 113$300,000 to $399,999
- 60$400,000 to $499,999
- 335$500,000 to $749,999
- 159$750,000 to $999,999
- 29$1,000,000 or more

Distribution of rent paid by renters
![Distribution of rent paid by renters]()
- 196Less than $100
- 21$100 to $199
- 40$200 to $299
- 59$300 to $399
- 153$400 to $499
- 34$500 to $599
- 103$600 to $699
- 142$700 to $799
- 272$800 to $899
- 136$900 to $999
- 158$1,000 to $1,249
- 159$1,250 to $1,499
- 973$1,500 to $1,999
- 615$2,000 or more

Median rent in 2022:
| Boise: | $1,725 |
| Portland: | $1,369 |
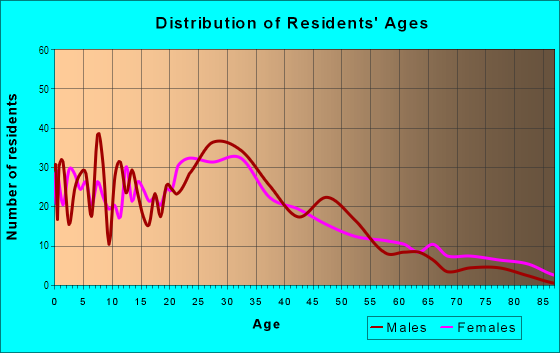
| Males: | 3,042 |
| Females: | 2,974 |
Males:
| This neighborhood: | 34.9 years |
| Whole city: | 38.3 years |
| This neighborhood: | 32.3 years |
| Whole city: | 38.6 years |
Average household size:
| Boise: | 6.7 people |
| Portland: | 2.2 people |
Percentage of family households:
| Boise: | 27.3% |
| Portland: | 35.3% |
| Here: | 22.9% |
| Portland: | 33.5% |
Percentage of married-couple families with children (among all households):
| Boise: | 33.1% |
| Portland: | 31.0% |
Percentage of single-mother households (among all households):
| Boise: | 42.8% |
| Portland: | 9.4% |
Percentage of never married males 15 years old and over:
Percentage of never married females 15 years old and over:
| Boise: | 26.4% |
| Portland: | 24.3% |
Percentage of never married females 15 years old and over:
| Boise: | 32.0% |
| city: | 20.5% |
Percentage of people that speak English not well or not at all:
| Boise: | 3.3% |
| Portland: | 3.6% |
Percentage of people born in this state:
Percentage of people born in another U.S. state:
Percentage of native residents but born outside the U.S.:
Percentage of foreign born residents:
| Here: | 25.8% |
| Portland: | 38.1% |
Percentage of people born in another U.S. state:
| Boise: | 60.9% |
| Portland: | 48.2% |
Percentage of native residents but born outside the U.S.:
| Here: | 1.3% |
| city: | 1.5% |
Percentage of foreign born residents:
| Here: | 12.0% |
| Portland: | 12.2% |
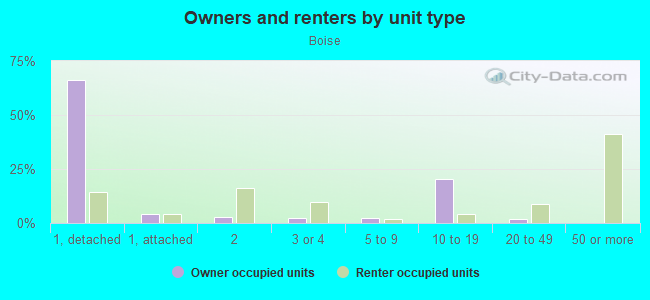
Owner-occupied
Renter-occupied

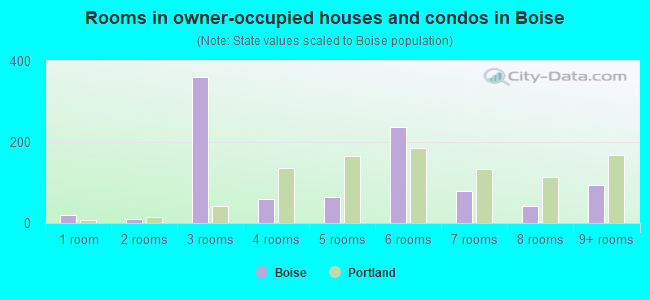
- Rooms in owner-occupied houses and condos in Boise
- 191 room
- 102 rooms
- 3613 rooms
- 594 rooms
- 645 rooms
- 2366 rooms
- 807 rooms
- 438 rooms
- 959+ rooms
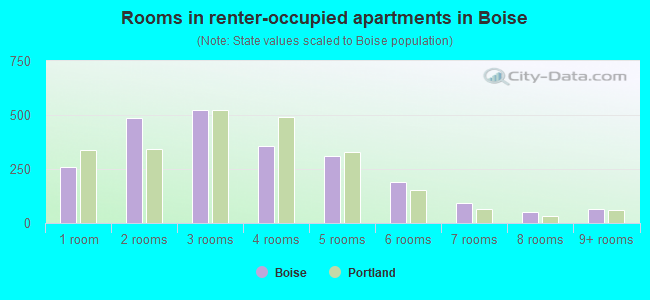
- Rooms in renter-occupied apartments in Boise
- 2601 room
- 4862 rooms
- 5233 rooms
- 3564 rooms
- 3085 rooms
- 1906 rooms
- 947 rooms
- 528 rooms
- 649+ rooms
Owner-occupied
Renter-occupied
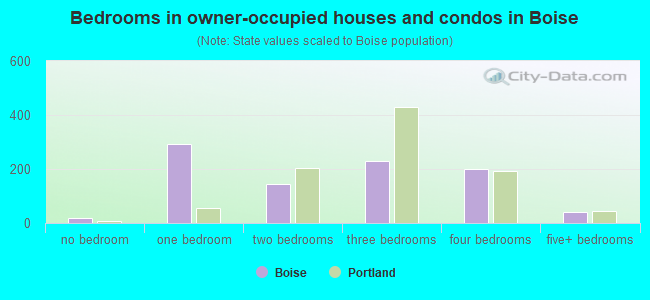
- Bedrooms in owner-occupied houses and condos in Boise
- 19no bedroom
- 2941 bedroom
- 1462 bedrooms
- 2303 bedrooms
- 1994 bedrooms
- 425+ bedrooms
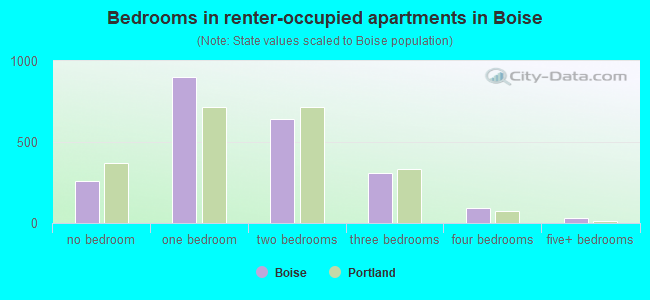
- Bedrooms in renter-occupied apartments in Boise
- 260no bedroom
- 8991 bedroom
- 6392 bedrooms
- 3113 bedrooms
- 914 bedrooms
- 335+ bedrooms
Average number of cars or other vehicles available in houses/condos:
Average number of cars or other vehicles available in apartments:
| This neighborhood: | 1.2 |
| Portland: | 1.8 |
Average number of cars or other vehicles available in apartments:
| Here: | 1.3 |
| city: | 1.1 |
Percentage of units with a mortgage:
| Boise: | 80.4% |
| Portland: | 73.0% |
Average estimated value of detached houses in 2022 (35.0% of all units):
| Boise: | $366,216 |
| Portland: | $616,638 |
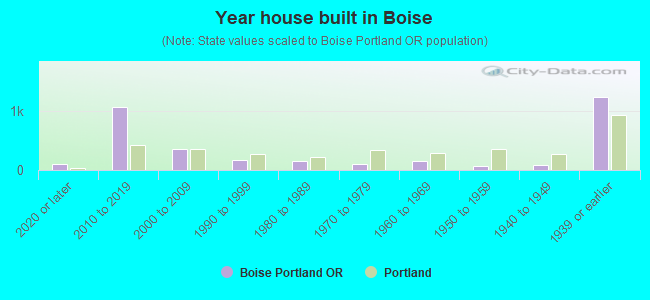
- Year house built in Boise
- 1022020 or later
- 1,0762010 to 2019
- 3542000 to 2009
- 1691990 to 1999
- 1461980 to 1989
- 981970 to 1979
- 1601960 to 1969
- 671950 to 1959
- 881940 to 1949
- 1,2351939 or earlier
City-data.com crime index for city in 2020 (higher means more crime):
| City: | 399.8 |
| U.S. average: | 219.5 |
Travel time to work (commute)
![Travel time to work (commute)]()
- 27Less than 5 minutes
- 2905 to 9 minutes
- 51710 to 14 minutes
- 81715 to 19 minutes
- 60220 to 24 minutes
- 11425 to 29 minutes
- 64830 to 34 minutes
- 3635 to 39 minutes
- 2540 to 44 minutes
- 8045 to 59 minutes
- 1560 to 89 minutes
- 6790 or more minutes

Means of transportation to work
![Means of transportation to work]()
- 45.7%2,079Drove a car alone
- 6.1%276Carpooled
- 11.9%539Bus
- 1.0%44Subway or elevated rail
- 3.2%147Light rail, streetcar or trolley
- 6.9%314Bicycle
- 4.4%202Walked
- 0.7%30Other means
- 24.2%1,101Worked at home

Time leaving home to go to work
![Time leaving home to go to work]()
- 6912:00 a.m. to 4:59 a.m.
- 215:00 a.m. to 5:29 a.m.
- 625:30 a.m. to 5:59 a.m.
- 1616:00 a.m. to 6:29 a.m.
- 3926:30 a.m. to 6:59 a.m.
- 3197:00 a.m. to 7:29 a.m.
- 3577:30 a.m. to 7:59 a.m.
- 2958:00 a.m. to 8:29 a.m.
- 3028:30 a.m. to 8:59 a.m.
- 2529:00 a.m. to 9:59 a.m.
- 23310:00 a.m. to 10:59 a.m.
- 13911:00 a.m. to 11:59 a.m.
- 53212:00 p.m. to 3:59 p.m.
- 1074:00 p.m. to 11:59 p.m.

Occupations of males:
- Percentage of males in management occupations (except farmers):
Here: 11.9% city: 13.5%
- Percentage of males in business and financial operations occupations:
Here: 6.2% city: 6.8%
- Percentage of males in computer and mathematical occupations:
Here: 5.4% city: 7.2%
- Percentage of males in architecture and engineering occupations:
Here: 4.6% city: 5.0%
- Percentage of males in education, training, and library occupations:
Here: 1.1% city: 3.6%
- Percentage of males in arts, design, entertainment, sports, and media occupations:
Here: 5.9% city: 5.2%
- Percentage of males in healthcare practitioners and technical occupations:
Here: 5.6% city: 4.4%
- Percentage of males in service occupations:
Here: 14.9% city: 11.9%
- Percentage of males in sales and office occupations:
Here: 22.4% city: 14.7%
- Percentage of males in farming, fishing, and forestry occupations:
Here: 3.9% city: 0.4%
- Percentage of males in construction, extraction, and maintenance occupations:
Here: 4.7% city: 5.2%
- Percentage of males in production occupations:
Here: 9.5% city: 5.5%
- Percentage of males in transportation occupations:
Here: 1.5% city: 4.3%
- Percentage of males in material moving occupations:
Here: 2.2% city: 4.0%
Occupations of females:
- Percentage of females in management occupations (except farmers):
Here: 13.8% city: 12.8%
- Percentage of females in business and financial operations occupations:
Here: 11.5% city: 8.1%
- Percentage of females in computer and mathematical occupations:
Here: 1.4% city: 2.5%
- Percentage of females in architecture and engineering occupations:
Here: 1.3% city: 1.6%
- Percentage of females in life, physical, and social science occupations:
Here: 1.0% city: 2.0%
- Percentage of females in community and social services occupations:
Here: 4.6% city: 3.4%
- Percentage of females in legal occupations:
Here: 1.7% city: 2.4%
- Percentage of females in education, training, and library occupations:
Here: 6.0% city: 8.4%
- Percentage of females in arts, design, entertainment, sports, and media occupations:
Here: 6.0% city: 5.1%
- Percentage of females in healthcare practitioners and technical occupations:
Here: 8.1% city: 10.3%
- Percentage of females in service occupations:
Here: 24.7% city: 17.8%
- Percentage of females in sales and office occupations:
Here: 14.6% city: 20.0%
- Percentage of females in production occupations:
Here: 1.7% city: 2.3%
- Percentage of females in transportation occupations:
Here: 1.3% city: 1.0%
- Percentage of females in material moving occupations:
Here: 2.0% city: 1.7%
Education in this neighborhood (subdivision or community):
- Percentage of people 3 years and older in K-12 schools:
Boise: 14.5% Portland: 12.2%
- Percentage of people 3 years and older in undergraduate colleges:
Boise: 8.6% Portland: 4.8%
- Percentage of people 3 years and older in grad. or professional schools:
Boise: 2.3% Portland: 2.0%
- Percentage of students K-12 enrolled in private schools:
Boise: 45.3% Portland: 12.7%
Percentage of population below poverty level:
| Boise: | 15.3% |
| Portland: | 12.7% |
Median year owner moved in (as recorded in 2022):
Median year renter moved in (as recorded in 2022):
| Boise: | 2011 |
| Portland: | 2012 |
Median year renter moved in (as recorded in 2022):
| Boise: | 2018 |
| Portland: | 2020 |
Percentage of married-couple families with both working:
| Boise: | 168.7% |
| Portland: | 78.7% |
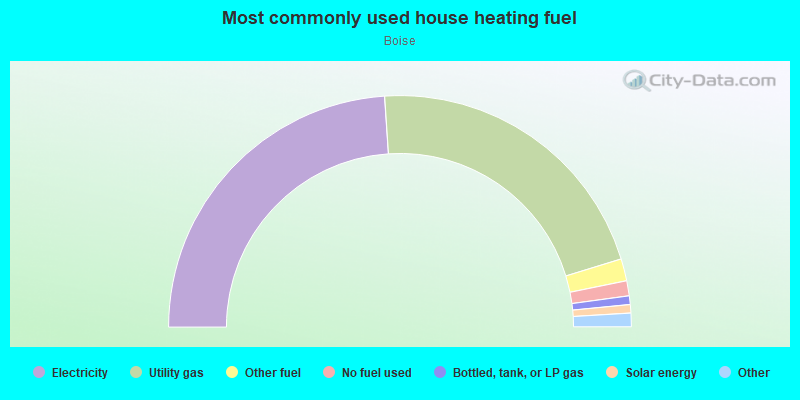
- 47.9%Electricity
- 42.6%Utility gas
- 3.1%Other fuel
- 2.1%No fuel used
- 1.2%Bottled, tank, or LP gas
- 1.2%Solar energy
- 1.0%Fuel oil, kerosene, etc.
- 1.0%Wood
Limited-access highways (interstate or state) in this neighborhood:
I- 405 (US Hwy 30)
Length: 0.99 miles
Directions: E-W, SE-NW, SW-NE
Directions: E-W, SE-NW, SW-NE
I- 5 (Pacific Hwy)
Length: 0.60 miles
Directions: N-S, SE-NW
Directions: N-S, SE-NW
Roads and streets:
N Failing St
Length: 0.79 miles
Direction: E-W
Address range: 1 to 1199
Direction: E-W
Address range: 1 to 1199
N Shaver St
Length: 0.79 miles
Direction: E-W
Address range: 1 to 1199
Direction: E-W
Address range: 1 to 1199
N Beech St
Length: 0.77 miles
Directions: E-W, SE-NW
Address range: 1 to 1199
Directions: E-W, SE-NW
Address range: 1 to 1199
N Mason St
Length: 0.77 miles
Direction: E-W
Address range: 1 to 1199
Direction: E-W
Address range: 1 to 1199
N Mississippi Ave
Length: 0.75 miles
Directions: N-S, SE-NW, SW-NE
Address range: 2900 to 4098
Directions: N-S, SE-NW, SW-NE
Address range: 2900 to 4098
N Fremont St
Length: 0.74 miles
Directions: E-W, SW-NE
Address range: 102 to 1199
Directions: E-W, SW-NE
Address range: 102 to 1199
N Albina Ave
Length: 0.66 miles
Directions: E-W, N-S, SE-NW, SW-NE
Address range: 3100 to 4099
Directions: E-W, N-S, SE-NW, SW-NE
Address range: 3100 to 4099
N Borthwick Ave
Length: 0.58 miles
Direction: N-S
Address range: 2900 to 4099
Direction: N-S
Address range: 2900 to 4099
N Michigan Ave
Length: 0.50 miles
Directions: N-S, SE-NW
Address range: 3200 to 4099
Directions: N-S, SE-NW
Address range: 3200 to 4099
N Missouri Ave
Length: 0.49 miles
Direction: N-S
Address range: 3300 to 4233
Direction: N-S
Address range: 3300 to 4233
N Kerby Ave
Length: 0.47 miles
Direction: N-S
Address range: 2900 to 4099
Direction: N-S
Address range: 2900 to 4099
N Vancouver Ave
Length: 0.45 miles
Direction: N-S
Address range: 3300 to 4099
Direction: N-S
Address range: 3300 to 4099
N Cook St
Length: 0.43 miles
Directions: E-W, SW-NE
Address range: 200 to 964
Directions: E-W, SW-NE
Address range: 200 to 964
N Gantenbein Ave
Length: 0.41 miles
Directions: N-S, SE-NW
Address range: 3400 to 4099
Directions: N-S, SE-NW
Address range: 3400 to 4099
NE Cleveland Ave
Length: 0.35 miles
Direction: N-S
Address range: 3500 to 4099
Direction: N-S
Address range: 3500 to 4099
NE Rodney Ave
Length: 0.35 miles
Direction: N-S
Address range: 3500 to 4099
Direction: N-S
Address range: 3500 to 4099
N Williams Ave
Length: 0.35 miles
Direction: N-S
Address range: 3500 to 4099
Direction: N-S
Address range: 3500 to 4099
N Haight Ave
Length: 0.35 miles
Direction: N-S
Address range: 3500 to 4099
Direction: N-S
Address range: 3500 to 4099
N Commercial Ave
Length: 0.34 miles
Direction: N-S
Address range: 3300 to 4099
Direction: N-S
Address range: 3300 to 4099
N Ivy St
Length: 0.28 miles
Direction: E-W
Address range: 200 to 599
Direction: E-W
Address range: 200 to 599
N Fargo St
Length: 0.24 miles
Direction: E-W
Address range: 600 to 799
Direction: E-W
Address range: 600 to 799
N Stanton St
Length: 0.22 miles
Direction: E-W
Address range: 600 to 799
Direction: E-W
Address range: 600 to 799
NE Beech St
Length: 0.21 miles
Direction: E-W
Address range: 1 to 199
Direction: E-W
Address range: 1 to 199
NE Mason St
Length: 0.14 miles
Direction: E-W
Address range: 1 to 99
Direction: E-W
Address range: 1 to 99
NE Shaver St
Length: 0.14 miles
Direction: E-W
Address range: 1 to 99
Direction: E-W
Address range: 1 to 99
NE Fremont St
Length: 0.14 miles
Direction: E-W
Address range: 1 to 399
Direction: E-W
Address range: 1 to 399
NE Failing St
Length: 0.14 miles
Direction: E-W
Address range: 1 to 99
Direction: E-W
Address range: 1 to 99
N Morris St
Length: 0.09 miles
Direction: E-W
Address range: 600 to 699
Direction: E-W
Address range: 600 to 699
NE Mallory Ave
Length: 0.09 miles
Direction: N-S
Address range: 3500 to 3699
Direction: N-S
Address range: 3500 to 3699
N Monroe St
Length: 0.08 miles
Direction: E-W
Address range: 800 to 899
Direction: E-W
Address range: 800 to 899
N Revere St
Length: 0.07 miles
Direction: E-W
Address range: 900 to 999
Direction: E-W
Address range: 900 to 999
N Kerby St
Length: 0.03 miles
Direction: N-S
Address range: 3300 to 3399
Direction: N-S
Address range: 3300 to 3399
Wick Ave (N Albina Ave)
Length: 0.02 miles
Direction: N-S
Direction: N-S
N Graham St
Length: 0.02 miles
Direction: E-W
Address range: 728 to 739
Direction: E-W
Address range: 728 to 739