Bon Air neighborhood in Pittsburgh, Pennsylvania (PA), 15210, 15226 detailed profile
Settings
X

Business Search - 14 Million verified businesses
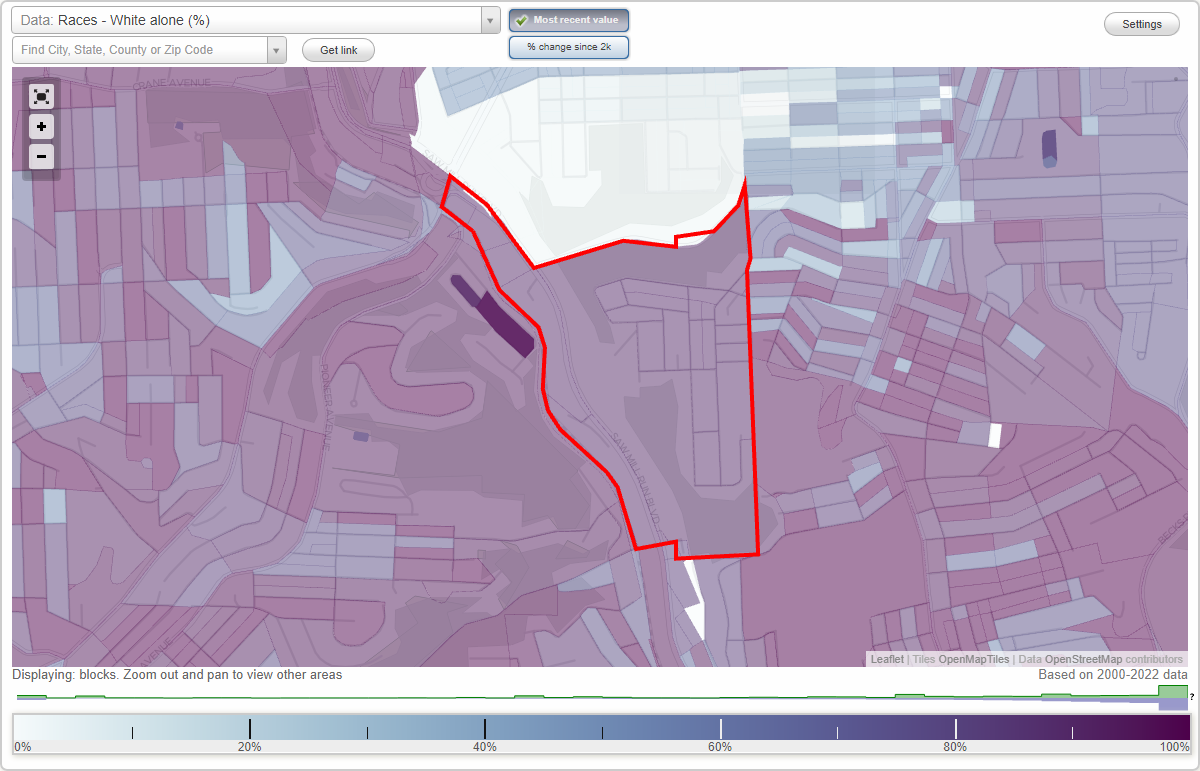
Area: 0.315 square miles
Population: 1,189
Population density:
| Bon Air: | 3,769 people per square mile |
| Pittsburgh: | 5,449 people per square mile |

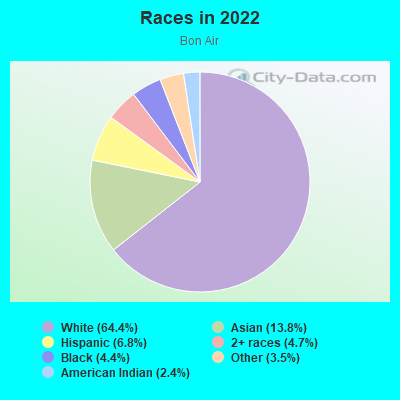
- 89664.4%White
- 19213.8%Asian
- 946.8%Hispanic or Latino
- 654.7%Two or more races
- 614.4%Black
- 493.5%Some other race
- 342.4%American Indian
Median household income in 2022:
| Bon Air: | $72,974 |
| Pittsburgh: | $63,380 |
Distribution of median household income
![Distribution of median household income]()
- 29Less than $10,000
- 71$10,000 to $19,999
- 61$20,000 to $29,999
- 51$30,000 to $39,999
- 26$40,000 to $49,999
- 63$50,000 to $59,999
- 62$60,000 to $74,999
- 108$75,000 to $99,999
- 60$100,000 to $124,999
- 51$125,000 to $149,999
- 47$150,000 to $199,999
- 31$200,000 or more

Distribution of owner-occupied house/condo value
![Distribution of owner-occupied house/condo value]()
- 135Less than $50,000
- 171$50,000 to $99,999
- 62$100,000 to $149,999
- 128$150,000 to $199,999
- 41$200,000 to $249,999
- 14$250,000 to $299,999
- 17$300,000 to $399,999
- 68$400,000 to $499,999
- 8$500,000 to $749,999
- 8$750,000 to $999,999

Distribution of rent paid by renters
![Distribution of rent paid by renters]()
- 5Less than $100
- 49$100 to $199
- 49$200 to $299
- 37$300 to $399
- 30$400 to $499
- 362$500 to $599
- 46$600 to $699
- 60$700 to $799
- 30$800 to $899
- 25$900 to $999
- 53$1,000 to $1,249
- 20$1,250 to $1,499
- 28$1,500 to $1,999
- 7$2,000 or more

Median rent in 2022:
| Bon Air: | $772 |
| Pittsburgh: | $981 |
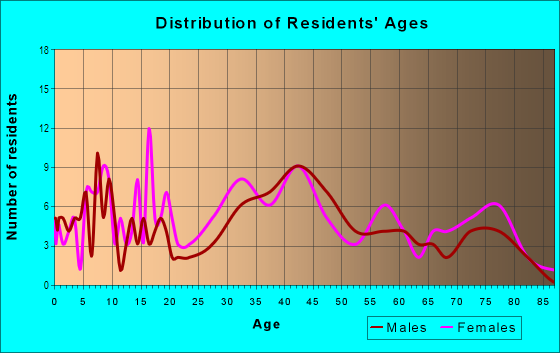
| Males: | 654 |
| Females: | 534 |
Males:
| This neighborhood: | 37.4 years |
| Whole city: | 33.3 years |
| This neighborhood: | 40.8 years |
| Whole city: | 32.9 years |
Average household size:
| Bon Air: | 2.3 people |
| Pittsburgh: | 24.0 people |
Percentage of family households:
| Bon Air: | 33.2% |
| Pittsburgh: | 28.6% |
| Here: | 40.2% |
| Pittsburgh: | 27.2% |
Percentage of married-couple families with children (among all households):
| Bon Air: | 41.8% |
| Pittsburgh: | 24.6% |
Percentage of single-mother households (among all households):
| Bon Air: | 8.6% |
| Pittsburgh: | 14.6% |
Percentage of never married males 15 years old and over:
Percentage of never married females 15 years old and over:
| Bon Air: | 30.9% |
| Pittsburgh: | 28.4% |
Percentage of never married females 15 years old and over:
| Bon Air: | 10.4% |
| city: | 27.6% |
Percentage of people that speak English not well or not at all:
| Bon Air: | 0.0% |
| Pittsburgh: | 1.2% |
Percentage of people born in this state:
Percentage of people born in another U.S. state:
Percentage of native residents but born outside the U.S.:
Percentage of foreign born residents:
| Here: | 77.6% |
| Pittsburgh: | 65.9% |
Percentage of people born in another U.S. state:
| Bon Air: | 13.2% |
| Pittsburgh: | 24.4% |
Percentage of native residents but born outside the U.S.:
| Here: | 4.8% |
| city: | 1.5% |
Percentage of foreign born residents:
| Here: | 8.7% |
| Pittsburgh: | 8.2% |
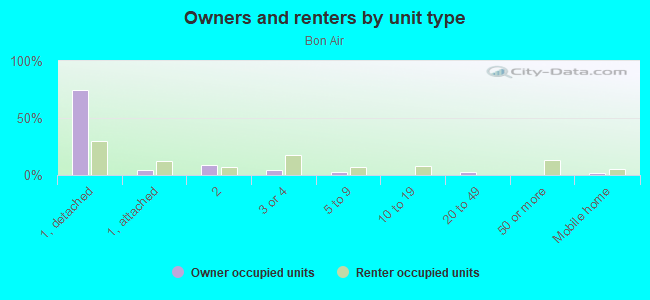
Owner-occupied
Renter-occupied

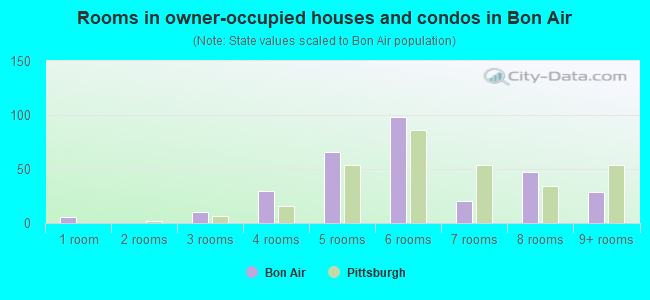
- Rooms in owner-occupied houses and condos in Bon Air
- 61 room
- 02 rooms
- 103 rooms
- 304 rooms
- 665 rooms
- 986 rooms
- 207 rooms
- 478 rooms
- 299+ rooms
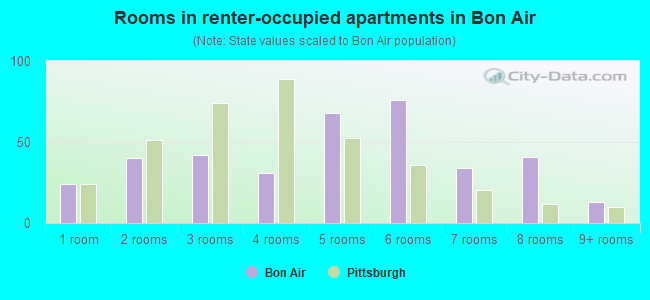
- Rooms in renter-occupied apartments in Bon Air
- 241 room
- 402 rooms
- 423 rooms
- 314 rooms
- 685 rooms
- 766 rooms
- 347 rooms
- 418 rooms
- 139+ rooms
Owner-occupied
Renter-occupied
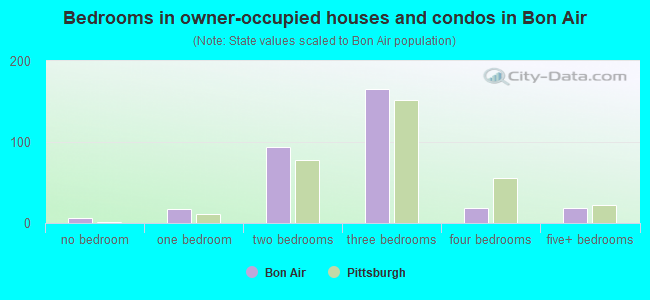
- Bedrooms in owner-occupied houses and condos in Bon Air
- 6no bedroom
- 171 bedroom
- 942 bedrooms
- 1653 bedrooms
- 194 bedrooms
- 185+ bedrooms
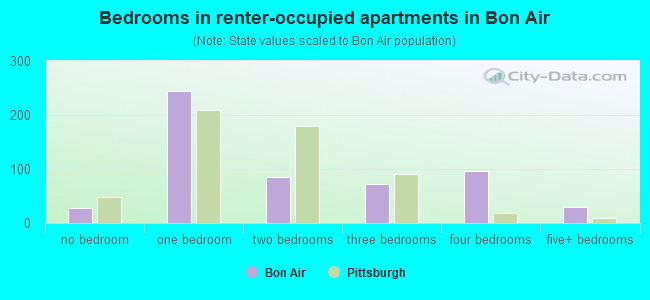
- Bedrooms in renter-occupied apartments in Bon Air
- 27no bedroom
- 2441 bedroom
- 862 bedrooms
- 723 bedrooms
- 974 bedrooms
- 305+ bedrooms
Average number of cars or other vehicles available in houses/condos:
Average number of cars or other vehicles available in apartments:
| This neighborhood: | 1.5 |
| Pittsburgh: | 1.5 |
Average number of cars or other vehicles available in apartments:
| Here: | 1.2 |
| city: | 0.9 |
Percentage of units with a mortgage:
| Bon Air: | 59.9% |
| Pittsburgh: | 56.7% |
Housing prices:
- Average estimated value of detached houses in 2022 (62.5% of all units):
Bon Air: $129,774 Pittsburgh: $225,939
- Average estimated value of townhouses or other attached units in 2022 (6.7% of all units):
This neighborhood: $216,800 city: $258,058
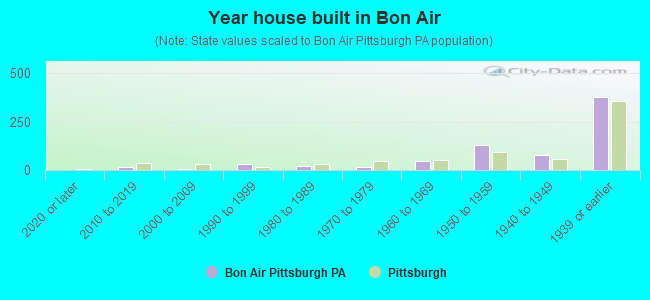
- Year house built in Bon Air
- 02020 or later
- 182010 to 2019
- 62000 to 2009
- 311990 to 1999
- 201980 to 1989
- 181970 to 1979
- 471960 to 1969
- 1301950 to 1959
- 791940 to 1949
- 3751939 or earlier
City-data.com crime index for city in 2019 (higher means more crime):
| City: | 257.1 |
| U.S. average: | 223.9 |
Travel time to work (commute)
![Travel time to work (commute)]()
- 17Less than 5 minutes
- 405 to 9 minutes
- 7110 to 14 minutes
- 15715 to 19 minutes
- 15320 to 24 minutes
- 5725 to 29 minutes
- 11730 to 34 minutes
- 935 to 39 minutes
- 5140 to 44 minutes
- 3645 to 59 minutes
- 4760 to 89 minutes
- 990 or more minutes

Means of transportation to work
![Means of transportation to work]()
- 64.4%401Drove a car alone
- 9.8%61Carpooled
- 9.8%61Bus
- 17.5%109Subway or elevated rail
- 3.5%22Light rail, streetcar or trolley
- 2.6%16Taxi
- 0.6%4Motorcycle
- 2.6%16Bicycle
- 4.2%26Walked
- 3.5%22Other means
- 6.9%43Worked at home

Time leaving home to go to work
![Time leaving home to go to work]()
- 3312:00 a.m. to 4:59 a.m.
- 255:00 a.m. to 5:29 a.m.
- 365:30 a.m. to 5:59 a.m.
- 646:00 a.m. to 6:29 a.m.
- 906:30 a.m. to 6:59 a.m.
- 1117:00 a.m. to 7:29 a.m.
- 797:30 a.m. to 7:59 a.m.
- 1188:00 a.m. to 8:29 a.m.
- 468:30 a.m. to 8:59 a.m.
- 289:00 a.m. to 9:59 a.m.
- 1110:00 a.m. to 10:59 a.m.
- 711:00 a.m. to 11:59 a.m.
- 7012:00 p.m. to 3:59 p.m.
- 444:00 p.m. to 11:59 p.m.

Occupations of males:
- Percentage of males in management occupations (except farmers):
Here: 16.8% city: 11.1%
- Percentage of males in business and financial operations occupations:
Here: 8.3% city: 8.0%
- Percentage of males in computer and mathematical occupations:
Here: 4.4% city: 9.0%
- Percentage of males in architecture and engineering occupations:
Here: 3.9% city: 3.4%
- Percentage of males in life, physical, and social science occupations:
Here: 7.0% city: 2.7%
- Percentage of males in education, training, and library occupations:
Here: 4.1% city: 7.0%
- Percentage of males in healthcare practitioners and technical occupations:
Here: 1.8% city: 6.1%
- Percentage of males in service occupations:
Here: 23.5% city: 14.7%
- Percentage of males in sales and office occupations:
Here: 11.3% city: 12.2%
- Percentage of males in construction, extraction, and maintenance occupations:
Here: 2.9% city: 5.0%
- Percentage of males in production occupations:
Here: 2.4% city: 3.3%
- Percentage of males in transportation occupations:
Here: 3.1% city: 4.4%
- Percentage of males in material moving occupations:
Here: 6.8% city: 3.8%
Occupations of females:
- Percentage of females in management occupations (except farmers):
Here: 4.4% city: 8.7%
- Percentage of females in business and financial operations occupations:
Here: 15.5% city: 8.1%
- Percentage of females in computer and mathematical occupations:
Here: 6.4% city: 2.8%
- Percentage of females in architecture and engineering occupations:
Here: 4.4% city: 1.2%
- Percentage of females in life, physical, and social science occupations:
Here: 1.8% city: 2.1%
- Percentage of females in community and social services occupations:
Here: 1.7% city: 3.4%
- Percentage of females in education, training, and library occupations:
Here: 6.9% city: 9.9%
- Percentage of females in arts, design, entertainment, sports, and media occupations:
Here: 1.1% city: 3.0%
- Percentage of females in healthcare practitioners and technical occupations:
Here: 9.3% city: 10.9%
- Percentage of females in service occupations:
Here: 14.4% city: 20.1%
- Percentage of females in sales and office occupations:
Here: 22.7% city: 23.5%
- Percentage of females in construction, extraction, and maintenance occupations:
Here: 1.1% city: 0.2%
- Percentage of females in production occupations:
Here: 8.7% city: 1.3%
- Percentage of females in transportation occupations:
Here: 2.6% city: 0.8%
- Percentage of females in material moving occupations:
Here: 2.6% city: 1.4%
Percentage of people 16-64 in Armed Forces:
| Bon Air: | 0.7% |
| Pittsburgh: | 0.2% |
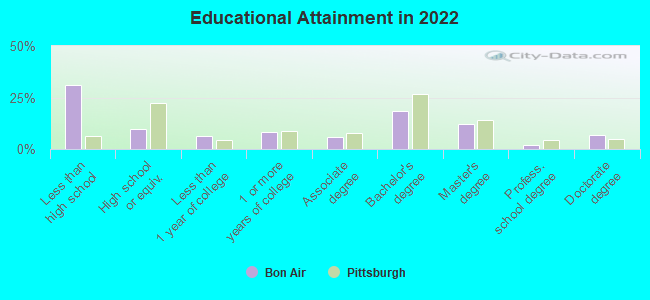
Education in this neighborhood (subdivision or community):
- Percentage of people 3 years and older in K-12 schools:
Bon Air: 14.7% Pittsburgh: 10.4%
- Percentage of people 3 years and older in undergraduate colleges:
Bon Air: 6.4% Pittsburgh: 12.9%
- Percentage of people 3 years and older in grad. or professional schools:
Bon Air: 12.4% Pittsburgh: 4.1%
- Percentage of students K-12 enrolled in private schools:
Bon Air: 22.0% Pittsburgh: 19.6%
Percentage of population below poverty level:
| Bon Air: | 14.8% |
| Pittsburgh: | 19.0% |
Median year owner moved in (as recorded in 2022):
Median year renter moved in (as recorded in 2022):
| Bon Air: | 2006 |
| Pittsburgh: | 2007 |
Median year renter moved in (as recorded in 2022):
| Bon Air: | 2015 |
| Pittsburgh: | 2020 |
Percentage of married-couple families with both working:
| Bon Air: | 67.4% |
| Pittsburgh: | 79.2% |
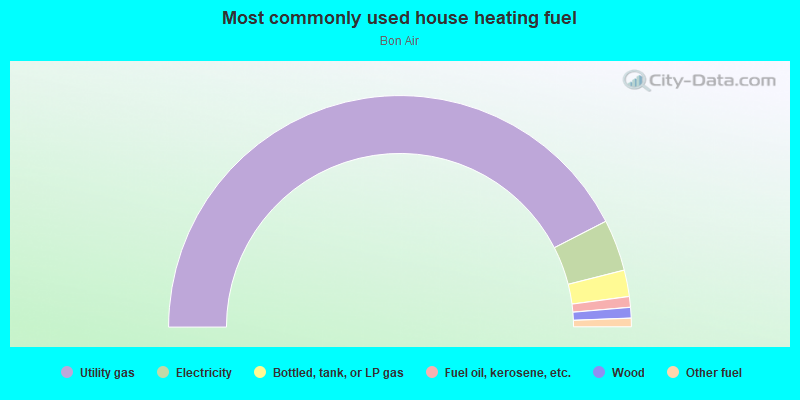
- 84.9%Utility gas
- 7.2%Electricity
- 3.7%Bottled, tank, or LP gas
- 1.5%Fuel oil, kerosene, etc.
- 1.5%Wood
- 1.2%Other fuel
Highways in this neighborhood:
Saw Mill Run Blvd (State Rte 51)
Length: 0.84 miles
Directions: N-S, SE-NW
Address range: 600 to 1299
Directions: N-S, SE-NW
Address range: 600 to 1299
Roads and streets:
Camfield St
Length: 0.53 miles
Directions: N-S, SW-NE
Address range: 1 to 499
Directions: N-S, SW-NE
Address range: 1 to 499
Bon Air Ave
Length: 0.46 miles
Directions: E-W, SW-NE
Address range: 110 to 599
Directions: E-W, SW-NE
Address range: 110 to 599
Conniston Ave
Length: 0.45 miles
Directions: N-S, SE-NW
Address range: 100 to 467
Directions: N-S, SE-NW
Address range: 100 to 467
Vernon Way
Length: 0.27 miles
Direction: E-W
Direction: E-W
Caperton St
Length: 0.25 miles
Direction: E-W
Address range: 200 to 498
Direction: E-W
Address range: 200 to 498
Roseton Ave
Length: 0.25 miles
Directions: E-W, N-S, SE-NW, SW-NE
Address range: 1 to 299
Directions: E-W, N-S, SE-NW, SW-NE
Address range: 1 to 299
Drycove St
Length: 0.24 miles
Directions: E-W, N-S, SW-NE
Address range: 400 to 499
Directions: E-W, N-S, SW-NE
Address range: 400 to 499
Calle Ave
Length: 0.23 miles
Direction: E-W
Address range: 200 to 499
Direction: E-W
Address range: 200 to 499
Tarragonna St
Length: 0.16 miles
Directions: N-S, SE-NW
Address range: 1 to 658
Directions: N-S, SE-NW
Address range: 1 to 658
Institute St
Length: 0.15 miles
Directions: E-W, N-S, SE-NW
Address range: 200 to 399
Directions: E-W, N-S, SE-NW
Address range: 200 to 399
Ensign Ave
Length: 0.15 miles
Directions: SE-NW, SW-NE
Address range: 701 to 1298
Directions: SE-NW, SW-NE
Address range: 701 to 1298
Fordyce St
Length: 0.14 miles
Direction: N-S
Address range: 200 to 299
Direction: N-S
Address range: 200 to 299
Rapello St
Length: 0.12 miles
Directions: SE-NW, SW-NE
Address range: 700 to 799
Directions: SE-NW, SW-NE
Address range: 700 to 799
Timberland Ave
Length: 0.12 miles
Directions: N-S, SE-NW, SW-NE
Address range: 800 to 899
Directions: N-S, SE-NW, SW-NE
Address range: 800 to 899
Edgebrook Ave
Length: 0.11 miles
Direction: E-W
Address range: 1200 to 1599
Direction: E-W
Address range: 1200 to 1599
Reifert St
Length: 0.11 miles
Direction: E-W
Address range: 100 to 126
Direction: E-W
Address range: 100 to 126
Abner Ave
Length: 0.11 miles
Direction: E-W
Address range: 100 to 199
Direction: E-W
Address range: 100 to 199
Schuchert St
Length: 0.10 miles
Direction: E-W
Address range: 100 to 199
Direction: E-W
Address range: 100 to 199
Duart Ave
Length: 0.09 miles
Directions: N-S, SW-NE
Address range: 100 to 119
Directions: N-S, SW-NE
Address range: 100 to 119
Bandi Ave
Length: 0.08 miles
Direction: E-W
Address range: 400 to 499
Direction: E-W
Address range: 400 to 499
Grosser St
Length: 0.08 miles
Direction: E-W
Direction: E-W
Ambrose St
Length: 0.06 miles
Directions: N-S, SE-NW
Address range: 100 to 199
Directions: N-S, SE-NW
Address range: 100 to 199
Tarraganno
Length: 0.03 miles
Direction: N-S
Address range: 647 to 652
Direction: N-S
Address range: 647 to 652
Railroad features:
Pennsylvania RR
Length: 0.78 miles
Directions: N-S, SE-NW, SW-NE
Directions: N-S, SE-NW, SW-NE
Other features:
Saw Mill Run
Length: 0.95 miles
Directions: E-W, N-S, SE-NW
Directions: E-W, N-S, SE-NW