Boston Square neighborhood in Grand Rapids, Michigan (MI), 49507 detailed profile
Settings
X

Business Search - 14 Million verified businesses
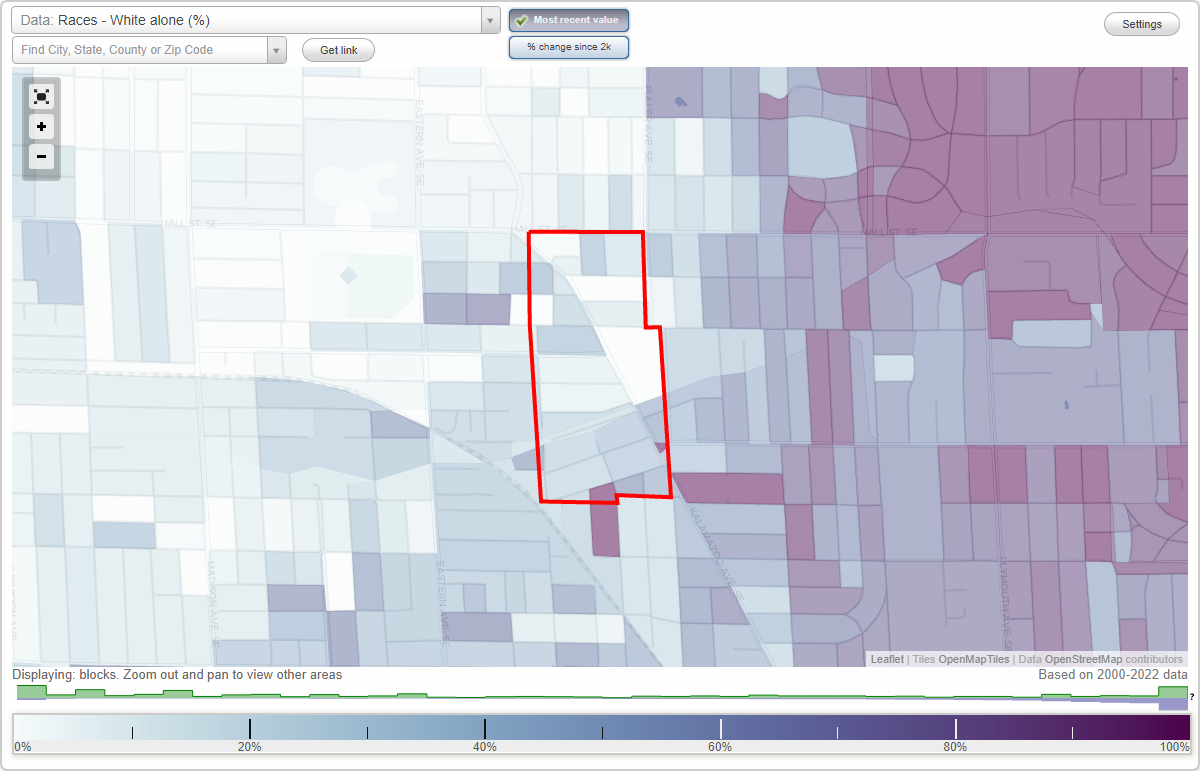
Area: 0.157 square miles
Population: 1,159
Population density:
| Boston Square: | 7,372 people per square mile |
| Grand Rapids: | 4,411 people per square mile |

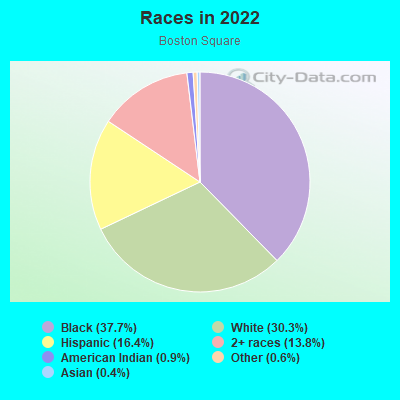
- 47937.7%Black
- 38630.3%White
- 20916.4%Hispanic or Latino
- 17513.8%Two or more races
- 110.9%American Indian
- 70.6%Some other race
- 50.4%Asian
Median household income in 2022:
| Boston Square: | $56,448 |
| Grand Rapids: | $65,660 |
Distribution of median household income
![Distribution of median household income]()
- 23Less than $10,000
- 74$10,000 to $19,999
- 49$20,000 to $29,999
- 34$30,000 to $39,999
- 94$40,000 to $49,999
- 50$50,000 to $59,999
- 41$60,000 to $74,999
- 93$75,000 to $99,999
- 70$100,000 to $124,999
- 30$125,000 to $149,999
- 22$150,000 to $199,999
- 9$200,000 or more

Distribution of owner-occupied house/condo value
![Distribution of owner-occupied house/condo value]()
- 87Less than $50,000
- 75$50,000 to $99,999
- 105$100,000 to $149,999
- 107$150,000 to $199,999
- 42$200,000 to $249,999
- 51$250,000 to $299,999
- 6$300,000 to $399,999
- 9$400,000 to $499,999

Distribution of rent paid by renters
![Distribution of rent paid by renters]()
- 28Less than $100
- 33$100 to $199
- 44$200 to $299
- 33$300 to $399
- 9$400 to $499
- 6$500 to $599
- 6$600 to $699
- 24$700 to $799
- 19$800 to $899
- 25$900 to $999
- 60$1,000 to $1,249
- 13$1,250 to $1,499
- 17$1,500 to $1,999

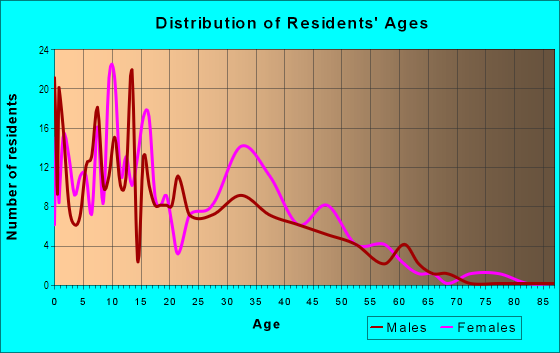
| Males: | 472 |
| Females: | 686 |
Males:
| This neighborhood: | 31.6 years |
| Whole city: | 33.0 years |
| This neighborhood: | 29.8 years |
| Whole city: | 33.3 years |
Average household size:
| Boston Square: | 17.5 people |
| Grand Rapids: | 2.2 people |
Percentage of family households:
| Boston Square: | 52.7% |
| Grand Rapids: | 36.8% |
| Here: | 27.5% |
| Grand Rapids: | 31.2% |
Percentage of married-couple families with children (among all households):
| Boston Square: | 11.6% |
| Grand Rapids: | 25.1% |
Percentage of single-mother households (among all households):
| Boston Square: | 25.7% |
| Grand Rapids: | 14.6% |
Percentage of never married males 15 years old and over:
Percentage of never married females 15 years old and over:
| Boston Square: | 24.1% |
| Grand Rapids: | 23.6% |
Percentage of never married females 15 years old and over:
| Boston Square: | 31.0% |
| city: | 23.9% |
Percentage of people that speak English not well or not at all:
| Boston Square: | 0.0% |
| Grand Rapids: | 4.2% |
Percentage of people born in this state:
Percentage of people born in another U.S. state:
Percentage of native residents but born outside the U.S.:
Percentage of foreign born residents:
| Here: | 74.4% |
| Grand Rapids: | 70.1% |
Percentage of people born in another U.S. state:
| Boston Square: | 22.3% |
| Grand Rapids: | 18.1% |
Percentage of native residents but born outside the U.S.:
| Here: | 1.0% |
| city: | 1.0% |
Percentage of foreign born residents:
| Here: | 2.3% |
| Grand Rapids: | 10.8% |
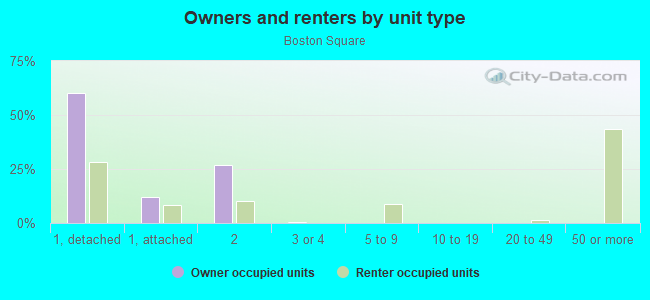
Owner-occupied
Renter-occupied

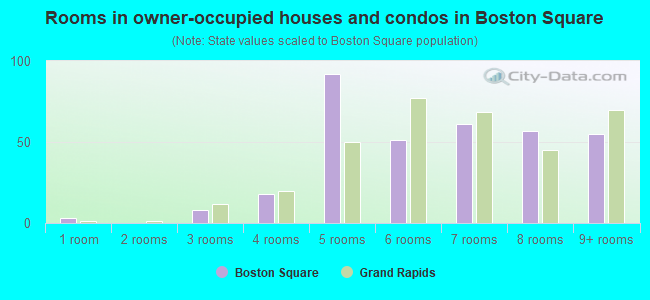
- Rooms in owner-occupied houses and condos in Boston Square
- 31 room
- 02 rooms
- 83 rooms
- 184 rooms
- 925 rooms
- 516 rooms
- 617 rooms
- 578 rooms
- 559+ rooms
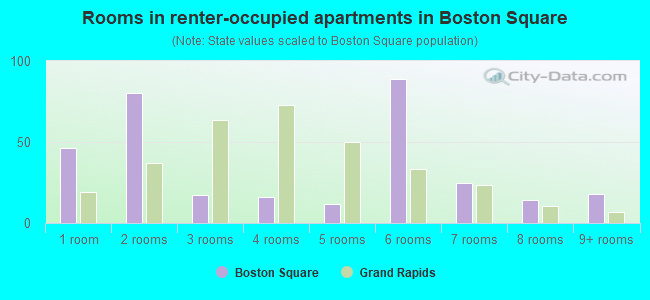
- Rooms in renter-occupied apartments in Boston Square
- 461 room
- 802 rooms
- 173 rooms
- 164 rooms
- 125 rooms
- 896 rooms
- 257 rooms
- 148 rooms
- 189+ rooms
Owner-occupied
Renter-occupied
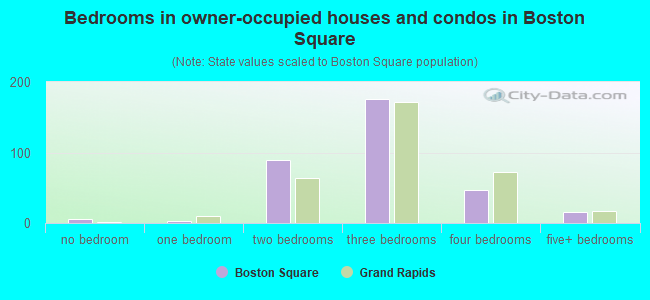
- Bedrooms in owner-occupied houses and condos in Boston Square
- 6no bedroom
- 31 bedroom
- 902 bedrooms
- 1763 bedrooms
- 474 bedrooms
- 165+ bedrooms
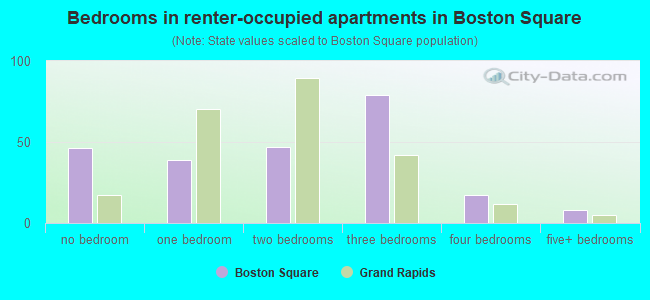
- Bedrooms in renter-occupied apartments in Boston Square
- 46no bedroom
- 391 bedroom
- 472 bedrooms
- 793 bedrooms
- 174 bedrooms
- 85+ bedrooms
Average number of cars or other vehicles available in houses/condos:
Average number of cars or other vehicles available in apartments:
| This neighborhood: | 2.4 |
| Grand Rapids: | 1.8 |
Average number of cars or other vehicles available in apartments:
| Here: | 1.1 |
| city: | 1.3 |
Percentage of units with a mortgage:
| Boston Square: | 69.3% |
| Grand Rapids: | 67.2% |
Average estimated value of detached houses in 2022 (76.2% of all units):
| Boston Square: | $164,890 |
| Grand Rapids: | $216,026 |
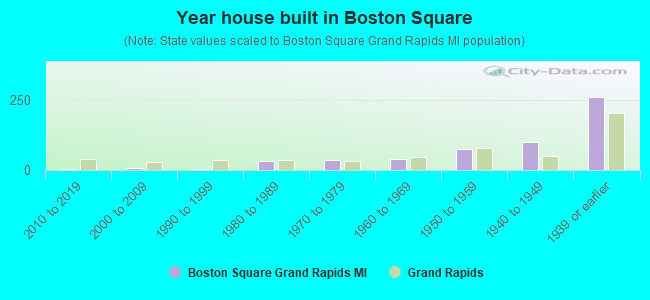
- Year house built in Boston Square
- 02020 or later
- 32010 to 2019
- 82000 to 2009
- 21990 to 1999
- 311980 to 1989
- 361970 to 1979
- 381960 to 1969
- 741950 to 1959
- 981940 to 1949
- 2581939 or earlier
City-data.com crime index for city in 2020 (higher means more crime):
| City: | 309.2 |
| U.S. average: | 219.5 |
Travel time to work (commute)
![Travel time to work (commute)]()
- 1Less than 5 minutes
- 315 to 9 minutes
- 13310 to 14 minutes
- 13015 to 19 minutes
- 12520 to 24 minutes
- 1825 to 29 minutes
- 2730 to 34 minutes
- 235 to 39 minutes
- 340 to 44 minutes
- 4845 to 59 minutes
- 1960 to 89 minutes

Means of transportation to work
![Means of transportation to work]()
- 73.6%462Drove a car alone
- 14.5%91Carpooled
- 5.7%36Bus
- 1.0%6Bicycle
- 1.8%11Walked
- 2.1%13Other means
- 6.5%41Worked at home

Time leaving home to go to work
![Time leaving home to go to work]()
- 5112:00 a.m. to 4:59 a.m.
- 225:00 a.m. to 5:29 a.m.
- 225:30 a.m. to 5:59 a.m.
- 436:00 a.m. to 6:29 a.m.
- 316:30 a.m. to 6:59 a.m.
- 257:00 a.m. to 7:29 a.m.
- 757:30 a.m. to 7:59 a.m.
- 628:00 a.m. to 8:29 a.m.
- 308:30 a.m. to 8:59 a.m.
- 269:00 a.m. to 9:59 a.m.
- 410:00 a.m. to 10:59 a.m.
- 711:00 a.m. to 11:59 a.m.
- 3412:00 p.m. to 3:59 p.m.
- 864:00 p.m. to 11:59 p.m.

Occupations of males:
- Percentage of males in management occupations (except farmers):
Here: 6.8% city: 10.3%
- Percentage of males in computer and mathematical occupations:
Here: 7.0% city: 5.4%
- Percentage of males in architecture and engineering occupations:
Here: 2.2% city: 3.6%
- Percentage of males in community and social services occupations:
Here: 4.9% city: 1.7%
- Percentage of males in education, training, and library occupations:
Here: 2.7% city: 3.9%
- Percentage of males in service occupations:
Here: 32.2% city: 14.6%
- Percentage of males in sales and office occupations:
Here: 5.0% city: 14.1%
- Percentage of males in construction, extraction, and maintenance occupations:
Here: 3.4% city: 6.5%
- Percentage of males in production occupations:
Here: 19.1% city: 11.0%
- Percentage of males in material moving occupations:
Here: 4.1% city: 7.3%
Occupations of females:
- Percentage of females in management occupations (except farmers):
Here: 4.8% city: 7.9%
- Percentage of females in business and financial operations occupations:
Here: 7.4% city: 6.3%
- Percentage of females in computer and mathematical occupations:
Here: 9.8% city: 1.3%
- Percentage of females in community and social services occupations:
Here: 4.1% city: 2.8%
- Percentage of females in education, training, and library occupations:
Here: 3.3% city: 7.2%
- Percentage of females in healthcare practitioners and technical occupations:
Here: 17.1% city: 10.8%
- Percentage of females in service occupations:
Here: 21.1% city: 21.1%
- Percentage of females in sales and office occupations:
Here: 18.5% city: 24.9%
- Percentage of females in production occupations:
Here: 4.8% city: 6.8%
- Percentage of females in material moving occupations:
Here: 7.3% city: 2.7%
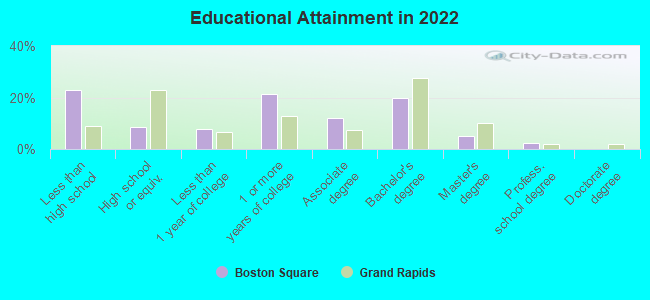
Education in this neighborhood (subdivision or community):
- Percentage of people 3 years and older in K-12 schools:
Boston Square: 31.0% Grand Rapids: 13.5%
- Percentage of people 3 years and older in undergraduate colleges:
Boston Square: 10.9% Grand Rapids: 6.0%
- Percentage of people 3 years and older in grad. or professional schools:
Boston Square: 1.6% Grand Rapids: 2.1%
- Percentage of students K-12 enrolled in private schools:
Boston Square: 22.7% Grand Rapids: 26.5%
Percentage of population below poverty level:
| Boston Square: | 18.5% |
| Grand Rapids: | 15.8% |
Median year owner moved in (as recorded in 2022):
Median year renter moved in (as recorded in 2022):
| Boston Square: | 2011 |
| Grand Rapids: | 2012 |
Median year renter moved in (as recorded in 2022):
| Boston Square: | 2015 |
| Grand Rapids: | 2020 |
Percentage of married-couple families with both working:
| Boston Square: | 67.6% |
| Grand Rapids: | 70.8% |
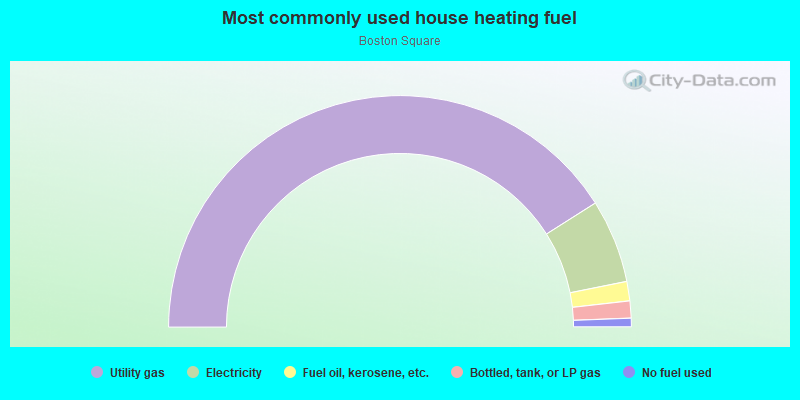
- 82.0%Utility gas
- 11.7%Electricity
- 2.7%Fuel oil, kerosene, etc.
- 2.4%Bottled, tank, or LP gas
- 1.2%No fuel used
Roads and streets:
Kalamazoo Ave SE
Length: 0.60 miles
Directions: E-W, SE-NW
Address range: 1251 to 1640
Directions: E-W, SE-NW
Address range: 1251 to 1640
Dickinson St SE
Length: 0.39 miles
Directions: E-W, SW-NE
Address range: 1000 to 1199
Directions: E-W, SW-NE
Address range: 1000 to 1199
Boston St SE
Length: 0.37 miles
Directions: E-W, SE-NW
Address range: 1000 to 1220
Directions: E-W, SE-NW
Address range: 1000 to 1220
Blaine Ave SE
Length: 0.34 miles
Directions: N-S, SE-NW
Address range: 1400 to 1699
Directions: N-S, SE-NW
Address range: 1400 to 1699
Ramona St SE
Length: 0.34 miles
Direction: E-W
Address range: 1100 to 1199
Direction: E-W
Address range: 1100 to 1199
Cottage Grove St SE
Length: 0.27 miles
Direction: E-W
Address range: 1000 to 1059
Direction: E-W
Address range: 1000 to 1059
Evergreen St SE
Length: 0.25 miles
Direction: E-W
Address range: 1000 to 10007
Direction: E-W
Address range: 1000 to 10007
Oakdale St SE
Length: 0.20 miles
Direction: E-W
Address range: 1000 to 1199
Direction: E-W
Address range: 1000 to 1199
Adams St SE
Length: 0.17 miles
Direction: E-W
Address range: 1000 to 1099
Direction: E-W
Address range: 1000 to 1099
Silver Ave SE
Length: 0.13 miles
Directions: N-S, SE-NW
Address range: 1550 to 1699
Directions: N-S, SE-NW
Address range: 1550 to 1699
Ewing Ave SE
Length: 0.13 miles
Direction: N-S
Address range: 1200 to 1399
Direction: N-S
Address range: 1200 to 1399
Noble St SE
Length: 0.12 miles
Direction: E-W
Address range: 1000 to 1126
Direction: E-W
Address range: 1000 to 1126
Toren St SE
Length: 0.10 miles
Directions: E-W, SW-NE
Address range: 1000 to 1099
Directions: E-W, SW-NE
Address range: 1000 to 1099
Orville St SE
Length: 0.08 miles
Direction: E-W
Address range: 1100 to 1128
Direction: E-W
Address range: 1100 to 1128
Fuller Ave SE
Length: 0.07 miles
Direction: N-S
Address range: 1526 to 1699
Direction: N-S
Address range: 1526 to 1699
Temple St SE
Length: 0.07 miles
Direction: E-W
Address range: 1039 to 1099
Direction: E-W
Address range: 1039 to 1099
Nelson Ave SE
Length: 0.05 miles
Direction: N-S
Address range: 1600 to 1699
Direction: N-S
Address range: 1600 to 1699
Alto Ave SE
Length: 0.04 miles
Direction: N-S
Address range: 1230 to 1299
Direction: N-S
Address range: 1230 to 1299
Railroad features:
Conrail RR
Length: 0.27 miles
Direction: E-W
Direction: E-W