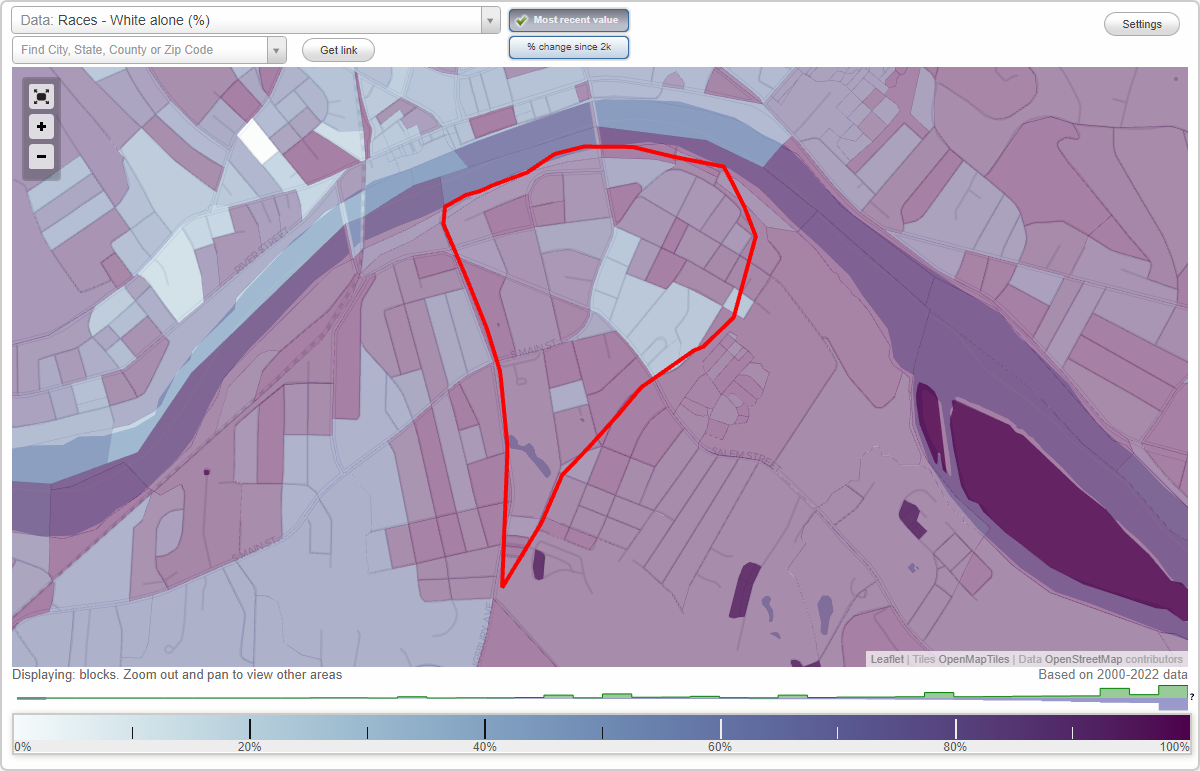
Bradford Common Local Historic District neighborhood in Haverhill, Massachusetts (MA), 01835 detailed profile
Settings
X

Business Search - 14 Million verified businesses
Area: 0.330 square miles
Population: 1,997
Population density:
| Bradford Common Local Historic District: | 6,057 people per square mile |
| Haverhill: | 2,015 people per square mile |

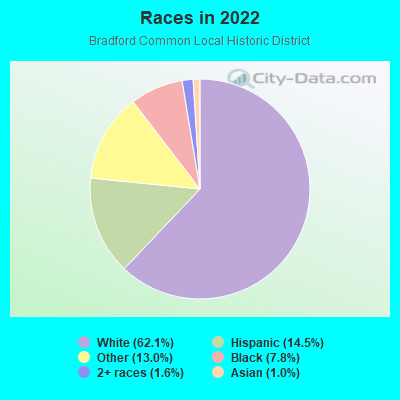
- 1,35862.1%White
- 31714.5%Hispanic or Latino
- 28413.0%Some other race
- 1717.8%Black
- 351.6%Two or more races
- 221.0%Asian
Median household income in 2022:
| Bradford Common Local Historic District: | $82,528 |
| Haverhill: | $85,561 |
Distribution of median household income
![Distribution of median household income]()
- 52Less than $10,000
- 73$10,000 to $19,999
- 37$20,000 to $29,999
- 94$30,000 to $39,999
- 104$40,000 to $49,999
- 92$50,000 to $59,999
- 91$60,000 to $74,999
- 130$75,000 to $99,999
- 125$100,000 to $124,999
- 94$125,000 to $149,999
- 95$150,000 to $199,999
- 40$200,000 or more

Distribution of owner-occupied house/condo value
![Distribution of owner-occupied house/condo value]()
- 59Less than $50,000
- 1$50,000 to $99,999
- 9$100,000 to $149,999
- 21$150,000 to $199,999
- 40$200,000 to $249,999
- 106$250,000 to $299,999
- 128$300,000 to $399,999
- 147$400,000 to $499,999
- 80$500,000 to $749,999
- 16$750,000 to $999,999

Distribution of rent paid by renters
![Distribution of rent paid by renters]()
- 21$400 to $499
- 84$600 to $699
- 19$700 to $799
- 34$900 to $999
- 190$1,000 to $1,249
- 22$1,250 to $1,499
- 31$1,500 to $1,999
- 36$2,000 or more

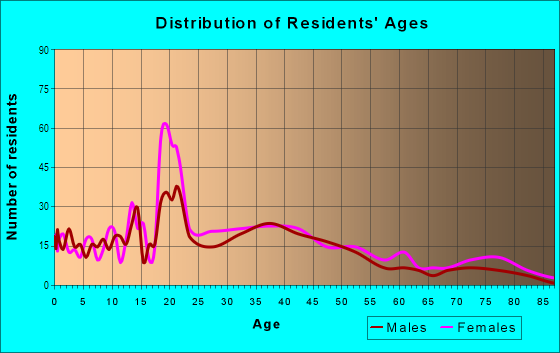
| Males: | 1,021 |
| Females: | 975 |
Males:
| This neighborhood: | 35.8 years |
| Whole city: | 36.5 years |
| This neighborhood: | 46.7 years |
| Whole city: | 39.2 years |
Average household size:
| Bradford Common Local Historic District: | 2.3 people |
| Haverhill: | 2.6 people |
Percentage of family households:
| Bradford Common Local Historic District: | 39.5% |
| Haverhill: | 47.7% |
| Here: | 27.8% |
| Haverhill: | 40.3% |
Percentage of married-couple families with children (among all households):
| Bradford Common Local Historic District: | 18.6% |
| Haverhill: | 27.0% |
Percentage of single-mother households (among all households):
| Bradford Common Local Historic District: | 12.3% |
| Haverhill: | 4.7% |
Percentage of never married males 15 years old and over:
Percentage of never married females 15 years old and over:
| Bradford Common Local Historic District: | 26.2% |
| Haverhill: | 19.6% |
Percentage of never married females 15 years old and over:
| Bradford Common Local Historic District: | 24.7% |
| city: | 18.8% |
Percentage of people that speak English not well or not at all:
| Bradford Common Local Historic District: | 1.8% |
| Haverhill: | 3.7% |
Percentage of people born in this state:
Percentage of people born in another U.S. state:
Percentage of native residents but born outside the U.S.:
Percentage of foreign born residents:
| Here: | 71.7% |
| Haverhill: | 65.4% |
Percentage of people born in another U.S. state:
| Bradford Common Local Historic District: | 18.6% |
| Haverhill: | 14.2% |
Percentage of native residents but born outside the U.S.:
| Here: | 1.1% |
| city: | 3.9% |
Percentage of foreign born residents:
| Here: | 8.6% |
| Haverhill: | 16.6% |
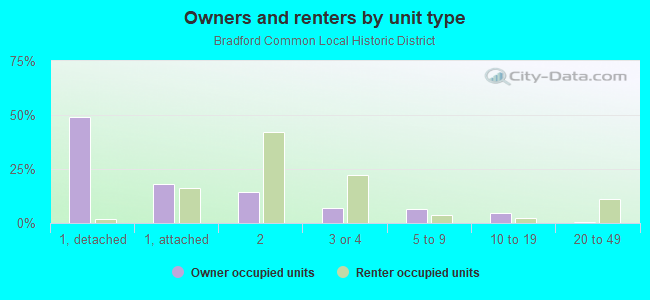
Owner-occupied
Renter-occupied

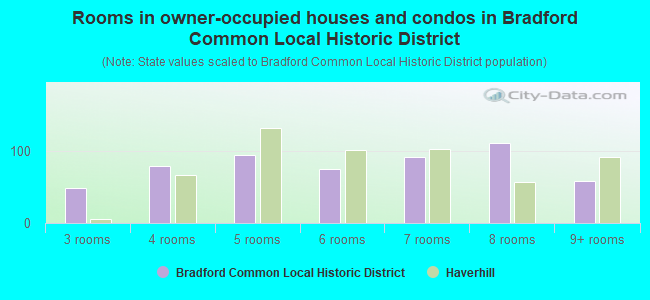
- Rooms in owner-occupied houses and condos in Bradford Common Local Historic District
- 01 room
- 02 rooms
- 483 rooms
- 794 rooms
- 945 rooms
- 746 rooms
- 917 rooms
- 1108 rooms
- 589+ rooms
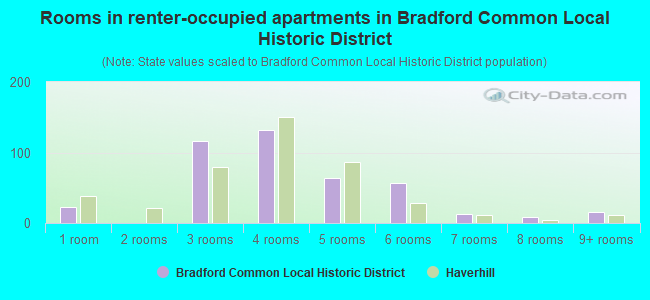
- Rooms in renter-occupied apartments in Bradford Common Local Historic District
- 231 room
- 02 rooms
- 1173 rooms
- 1324 rooms
- 645 rooms
- 576 rooms
- 137 rooms
- 88 rooms
- 159+ rooms
Owner-occupied
Renter-occupied
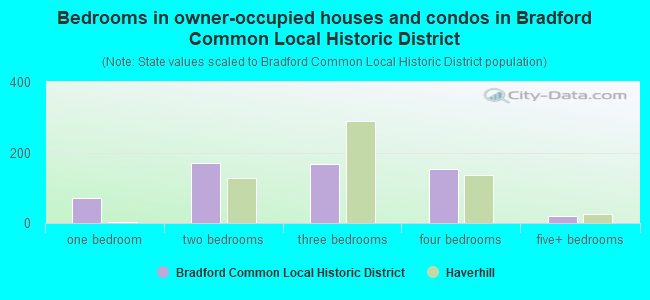
- Bedrooms in owner-occupied houses and condos in Bradford Common Local Historic District
- 0no bedroom
- 701 bedroom
- 1712 bedrooms
- 1663 bedrooms
- 1544 bedrooms
- 215+ bedrooms
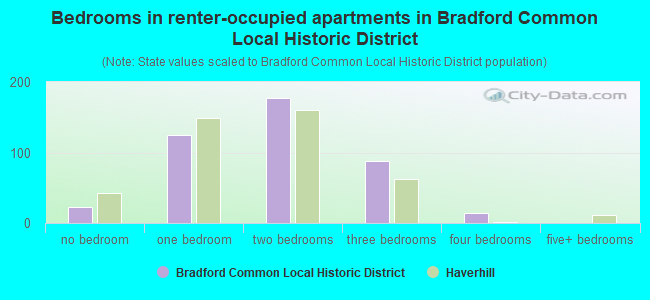
- Bedrooms in renter-occupied apartments in Bradford Common Local Historic District
- 23no bedroom
- 1251 bedroom
- 1772 bedrooms
- 883 bedrooms
- 144 bedrooms
- 05+ bedrooms
Average number of cars or other vehicles available in houses/condos:
Average number of cars or other vehicles available in apartments:
| This neighborhood: | 1.8 |
| Haverhill: | 2.0 |
Average number of cars or other vehicles available in apartments:
| Here: | 1.4 |
| city: | 1.3 |
Percentage of units with a mortgage:
| Bradford Common Local Historic District: | 71.4% |
| Haverhill: | 74.7% |
Housing prices:
- Average estimated value of detached houses in 2022 (34.3% of all units):
Bradford Common Local Historic District: $399,081 Haverhill: $502,054
- Average estimated value of townhouses or other attached units in 2022 (14.7% of all units):
This neighborhood: $319,272 city: $560,519
- Average estimated value of housing units in 2-unit structures in 2022 (31.6% of all units):
This neighborhood: $383,913 Haverhill: $716,811
- Average estimated '22 value of housing units in 3-to-4-unit structures (15.6% of all units):
Bradford Common Local Historic District: $411,640 city: $324,505
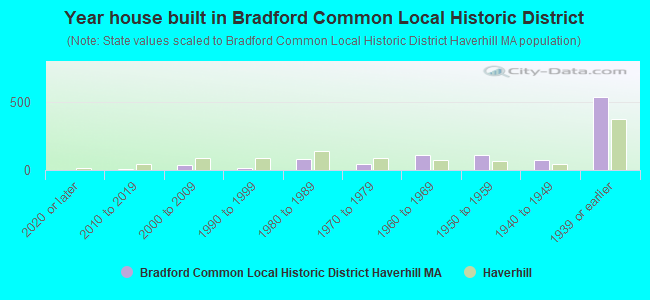
- Year house built in Bradford Common Local Historic District
- 02020 or later
- 92010 to 2019
- 392000 to 2009
- 161990 to 1999
- 841980 to 1989
- 441970 to 1979
- 1121960 to 1969
- 1081950 to 1959
- 731940 to 1949
- 5311939 or earlier
City-data.com crime index for city in 2020 (higher means more crime):
| City: | 165.7 |
| U.S. average: | 219.5 |
Travel time to work (commute)
![Travel time to work (commute)]()
- 27Less than 5 minutes
- 1785 to 9 minutes
- 19810 to 14 minutes
- 12415 to 19 minutes
- 10020 to 24 minutes
- 13525 to 29 minutes
- 19530 to 34 minutes
- 1535 to 39 minutes
- 10440 to 44 minutes
- 20945 to 59 minutes
- 6460 to 89 minutes
- 2190 or more minutes

Means of transportation to work
![Means of transportation to work]()
- 84.4%1,011Drove a car alone
- 4.3%51Carpooled
- 0.7%8Bus
- 3.7%44Long-distance train or commuter rail
- 1.9%23Taxi
- 2.0%24Bicycle
- 2.6%31Walked
- 2.4%29Other means
- 4.4%53Worked at home

Time leaving home to go to work
![Time leaving home to go to work]()
- 6012:00 a.m. to 4:59 a.m.
- 805:00 a.m. to 5:29 a.m.
- 565:30 a.m. to 5:59 a.m.
- 1086:00 a.m. to 6:29 a.m.
- 1386:30 a.m. to 6:59 a.m.
- 1827:00 a.m. to 7:29 a.m.
- 1337:30 a.m. to 7:59 a.m.
- 958:00 a.m. to 8:29 a.m.
- 888:30 a.m. to 8:59 a.m.
- 1269:00 a.m. to 9:59 a.m.
- 3810:00 a.m. to 10:59 a.m.
- 2511:00 a.m. to 11:59 a.m.
- 13112:00 p.m. to 3:59 p.m.
- 824:00 p.m. to 11:59 p.m.

Occupations of males:
- Percentage of males in management occupations (except farmers):
Here: 10.6% city: 11.9%
- Percentage of males in business and financial operations occupations:
Here: 3.2% city: 6.0%
- Percentage of males in arts, design, entertainment, sports, and media occupations:
Here: 7.3% city: 1.6%
- Percentage of males in healthcare practitioners and technical occupations:
Here: 7.0% city: 2.3%
- Percentage of males in service occupations:
Here: 29.0% city: 14.4%
- Percentage of males in sales and office occupations:
Here: 9.1% city: 15.0%
- Percentage of males in construction, extraction, and maintenance occupations:
Here: 10.7% city: 11.1%
- Percentage of males in production occupations:
Here: 8.4% city: 8.4%
- Percentage of males in transportation occupations:
Here: 1.9% city: 6.4%
- Percentage of males in material moving occupations:
Here: 3.6% city: 2.9%
Occupations of females:
- Percentage of females in management occupations (except farmers):
Here: 28.6% city: 11.6%
- Percentage of females in business and financial operations occupations:
Here: 1.4% city: 5.9%
- Percentage of females in computer and mathematical occupations:
Here: 3.4% city: 1.6%
- Percentage of females in community and social services occupations:
Here: 1.7% city: 3.0%
- Percentage of females in legal occupations:
Here: 3.9% city: 0.8%
- Percentage of females in education, training, and library occupations:
Here: 7.5% city: 10.7%
- Percentage of females in arts, design, entertainment, sports, and media occupations:
Here: 1.9% city: 2.0%
- Percentage of females in healthcare practitioners and technical occupations:
Here: 9.8% city: 8.2%
- Percentage of females in service occupations:
Here: 19.5% city: 23.0%
- Percentage of females in sales and office occupations:
Here: 15.9% city: 22.8%
- Percentage of females in production occupations:
Here: 5.2% city: 4.5%
- Percentage of females in material moving occupations:
Here: 1.0% city: 2.1%
Percentage of people 16-64 in Armed Forces:
| Bradford Common Local Historic District: | 0.0% |
| Haverhill: | 0.1% |
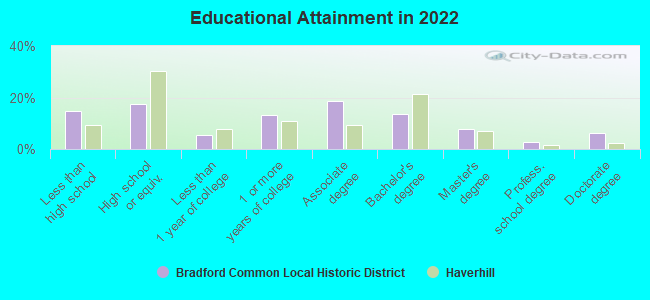
Education in this neighborhood (subdivision or community):
- Percentage of people 3 years and older in K-12 schools:
Bradford Common Local Historic District: 15.7% Haverhill: 14.8%
- Percentage of people 3 years and older in undergraduate colleges:
Bradford Common Local Historic District: 7.0% Haverhill: 5.7%
- Percentage of people 3 years and older in grad. or professional schools:
Bradford Common Local Historic District: 0.8% Haverhill: 0.5%
- Percentage of students K-12 enrolled in private schools:
Bradford Common Local Historic District: 48.9% Haverhill: 16.2%
Percentage of population below poverty level:
| Bradford Common Local Historic District: | 4.1% |
| Haverhill: | 14.4% |
Median year owner moved in (as recorded in 2022):
Median year renter moved in (as recorded in 2022):
| Bradford Common Local Historic District: | 2006 |
| Haverhill: | 2011 |
Median year renter moved in (as recorded in 2022):
| Bradford Common Local Historic District: | 2014 |
| Haverhill: | 2020 |
Percentage of married-couple families with both working:
| Bradford Common Local Historic District: | 49.0% |
| Haverhill: | 77.5% |
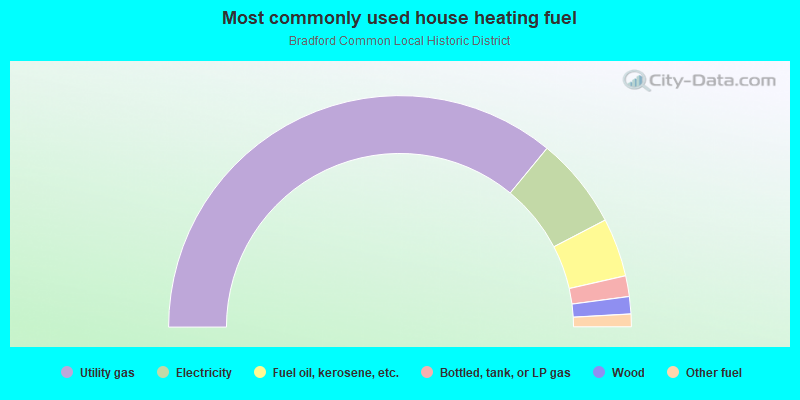
- 72.0%Utility gas
- 12.8%Electricity
- 8.2%Fuel oil, kerosene, etc.
- 2.9%Bottled, tank, or LP gas
- 2.4%Wood
- 1.8%Other fuel
Highways in this neighborhood:
State Hwy 125 (S Main St)
Length: 0.63 miles
Directions: E-W, N-S, SW-NE
Address range: 1 to 316
Directions: E-W, N-S, SW-NE
Address range: 1 to 316
Roads and streets:
S Park St
Length: 0.48 miles
Directions: N-S, SW-NE
Address range: 1 to 164
Directions: N-S, SW-NE
Address range: 1 to 164
Middlesex St
Length: 0.47 miles
Directions: E-W, SW-NE
Address range: 1 to 125
Directions: E-W, SW-NE
Address range: 1 to 125
S Central St
Length: 0.40 miles
Directions: E-W, SE-NW
Address range: 3 to 70
Directions: E-W, SE-NW
Address range: 3 to 70
S Pleasant St
Length: 0.36 miles
Direction: E-W
Address range: 1 to 134
Direction: E-W
Address range: 1 to 134
Chadwick St
Length: 0.34 miles
Direction: N-S
Address range: 1 to 122
Direction: N-S
Address range: 1 to 122
S Kimball St
Length: 0.34 miles
Directions: E-W, SE-NW, SW-NE
Address range: 1 to 44
Directions: E-W, SE-NW, SW-NE
Address range: 1 to 44
S Warren St
Length: 0.27 miles
Direction: SW-NE
Address range: 1 to 68
Direction: SW-NE
Address range: 1 to 68
S Elm St
Length: 0.26 miles
Direction: E-W
Address range: 1 to 65
Direction: E-W
Address range: 1 to 65
Railroad St
Length: 0.25 miles
Directions: E-W, N-S, SE-NW
Address range: 1 to 61
Directions: E-W, N-S, SE-NW
Address range: 1 to 61
S Pine St
Length: 0.25 miles
Direction: SW-NE
Address range: 1 to 63
Direction: SW-NE
Address range: 1 to 63
Salem St
Length: 0.24 miles
Directions: E-W, SE-NW
Address range: 1 to 42
Directions: E-W, SE-NW
Address range: 1 to 42
S River St
Length: 0.23 miles
Direction: E-W
Address range: 1 to 35
Direction: E-W
Address range: 1 to 35
Doane St
Length: 0.20 miles
Direction: E-W
Address range: 1 to 34
Direction: E-W
Address range: 1 to 34
Ferry St
Length: 0.20 miles
Directions: E-W, SW-NE
Address range: 1 to 40
Directions: E-W, SW-NE
Address range: 1 to 40
S Chestnut St
Length: 0.19 miles
Direction: SW-NE
Address range: 1 to 70
Direction: SW-NE
Address range: 1 to 70
Carleton Ave
Length: 0.19 miles
Direction: E-W
Address range: 1 to 99
Direction: E-W
Address range: 1 to 99
Allen St
Length: 0.19 miles
Directions: N-S, SE-NW, SW-NE
Address range: 1 to 98
Directions: N-S, SE-NW, SW-NE
Address range: 1 to 98
Parkview Ln
Length: 0.18 miles
Directions: E-W, N-S, SE-NW, SW-NE
Address range: 1 to 20
Directions: E-W, N-S, SE-NW, SW-NE
Address range: 1 to 20
Hawthorne St
Length: 0.18 miles
Directions: E-W, SW-NE
Address range: 1 to 99
Directions: E-W, SW-NE
Address range: 1 to 99
Church St
Length: 0.17 miles
Direction: E-W
Address range: 2 to 99
Direction: E-W
Address range: 2 to 99
S Grove St
Length: 0.16 miles
Direction: SW-NE
Address range: 1 to 41
Direction: SW-NE
Address range: 1 to 41
S Lincoln St
Length: 0.16 miles
Directions: N-S, SE-NW, SW-NE
Address range: 1 to 56
Directions: N-S, SE-NW, SW-NE
Address range: 1 to 56
Elmwood Ave
Length: 0.16 miles
Directions: E-W, SE-NW
Address range: 1 to 40
Directions: E-W, SE-NW
Address range: 1 to 40
Byron St
Length: 0.14 miles
Direction: N-S
Address range: 1 to 24
Direction: N-S
Address range: 1 to 24
Greystone Ave
Length: 0.14 miles
Directions: N-S, SE-NW, SW-NE
Address range: 1 to 44
Directions: N-S, SE-NW, SW-NE
Address range: 1 to 44
Inland St
Length: 0.12 miles
Directions: E-W, N-S, SE-NW
Address range: 1 to 33
Directions: E-W, N-S, SE-NW
Address range: 1 to 33
S Summer St
Length: 0.11 miles
Direction: N-S
Address range: 1 to 30
Direction: N-S
Address range: 1 to 30
S Charles St
Length: 0.11 miles
Direction: SW-NE
Address range: 1 to 28
Direction: SW-NE
Address range: 1 to 28
Euclid Ave
Length: 0.11 miles
Direction: E-W
Address range: 1 to 99
Direction: E-W
Address range: 1 to 99
Highland St
Length: 0.10 miles
Direction: E-W
Address range: 1 to 99
Direction: E-W
Address range: 1 to 99
Central Ave
Length: 0.08 miles
Direction: SW-NE
Address range: 1 to 22
Direction: SW-NE
Address range: 1 to 22
S Green St
Length: 0.08 miles
Direction: E-W
Address range: 1 to 25
Direction: E-W
Address range: 1 to 25
Pond St
Length: 0.07 miles
Direction: SW-NE
Address range: 1 to 25
Direction: SW-NE
Address range: 1 to 25
Bryant Ave
Length: 0.07 miles
Direction: E-W
Address range: 1 to 99
Direction: E-W
Address range: 1 to 99
Cole Ave
Length: 0.06 miles
Direction: SW-NE
Address range: 1 to 49
Direction: SW-NE
Address range: 1 to 49
Stone Ave
Length: 0.06 miles
Direction: SE-NW
Address range: 1 to 50
Direction: SE-NW
Address range: 1 to 50
S Webster St
Length: 0.05 miles
Direction: SW-NE
Address range: 1 to 10
Direction: SW-NE
Address range: 1 to 10
Cogswell Ave
Length: 0.04 miles
Direction: E-W
Direction: E-W
Railroad features:
Boston and Maine RR
Length: 0.47 miles
Directions: E-W, SE-NW, SW-NE
Directions: E-W, SE-NW, SW-NE