Brandon Place neighborhood in Denver, Colorado (CO), 80229 detailed profile
Settings
X


Business Search - 14 Million verified businesses
Area: 0.053 square miles
Population: 396
Population density:
| Brandon Place: | 7,416 people per square mile |
| Denver: | 4,651 people per square mile |

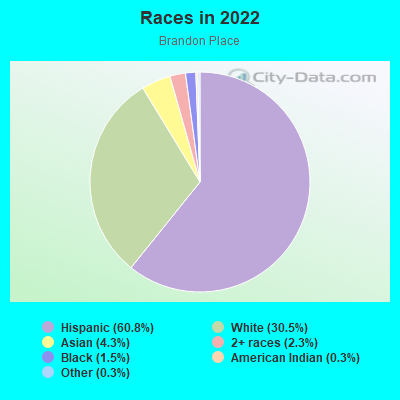
- 23960.8%Hispanic or Latino
- 12030.5%White
- 174.3%Asian
- 92.3%Two or more races
- 61.5%Black
- 10.3%American Indian
- 10.3%Some other race
Median household income in 2022:
| Brandon Place: | $80,904 |
| Denver: | $88,213 |
Distribution of median household income
![Distribution of median household income]()
- 3Less than $10,000
- 11$10,000 to $19,999
- 9$20,000 to $29,999
- 2$30,000 to $39,999
- 11$40,000 to $49,999
- 10$50,000 to $59,999
- 11$60,000 to $74,999
- 28$75,000 to $99,999
- 14$100,000 to $124,999
- 21$125,000 to $149,999
- 14$150,000 to $199,999
- 14$200,000 or more

Distribution of owner-occupied house/condo value
![Distribution of owner-occupied house/condo value]()
- 16Less than $50,000
- 24$50,000 to $99,999
- 2$100,000 to $149,999
- 3$150,000 to $199,999
- 4$200,000 to $249,999
- 4$250,000 to $299,999
- 23$300,000 to $399,999
- 34$400,000 to $499,999
- 17$500,000 to $749,999

Distribution of rent paid by renters
![Distribution of rent paid by renters]()
- 4$800 to $899
- 10$1,000 to $1,249
- 4$1,250 to $1,499
- 8$1,500 to $1,999
- 3$2,000 or more

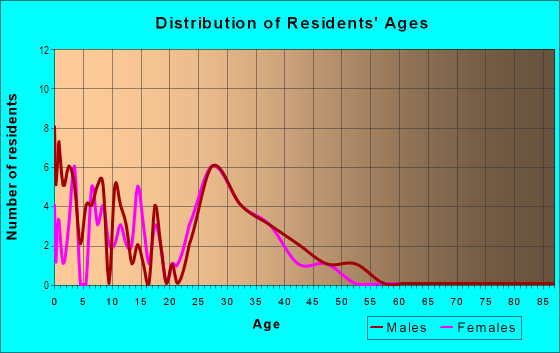
| Males: | 179 |
| Females: | 216 |
Males:
| This neighborhood: | 29.6 years |
| Whole city: | 35.2 years |
| This neighborhood: | 33.0 years |
| Whole city: | 35.1 years |
Average household size:
| Brandon Place: | 3.2 people |
| Denver: | 28.0 people |
Percentage of family households:
| Brandon Place: | 44.6% |
| Denver: | 35.1% |
| Here: | 51.8% |
| Denver: | 32.5% |
Percentage of married-couple families with children (among all households):
| Brandon Place: | 29.3% |
| Denver: | 32.4% |
Percentage of single-mother households (among all households):
| Brandon Place: | 4.6% |
| Denver: | 10.3% |
Percentage of never married males 15 years old and over:
Percentage of never married females 15 years old and over:
| Brandon Place: | 10.1% |
| Denver: | 25.0% |
Percentage of never married females 15 years old and over:
| Brandon Place: | 25.0% |
| city: | 20.8% |
Percentage of people that speak English not well or not at all:
| Brandon Place: | 9.6% |
| Denver: | 3.9% |
Percentage of people born in this state:
Percentage of people born in another U.S. state:
Percentage of native residents but born outside the U.S.:
Percentage of foreign born residents:
| Here: | 53.8% |
| Denver: | 38.5% |
Percentage of people born in another U.S. state:
| Brandon Place: | 22.6% |
| Denver: | 46.1% |
Percentage of native residents but born outside the U.S.:
| Here: | 3.3% |
| city: | 1.7% |
Percentage of foreign born residents:
| Here: | 20.3% |
| Denver: | 13.8% |
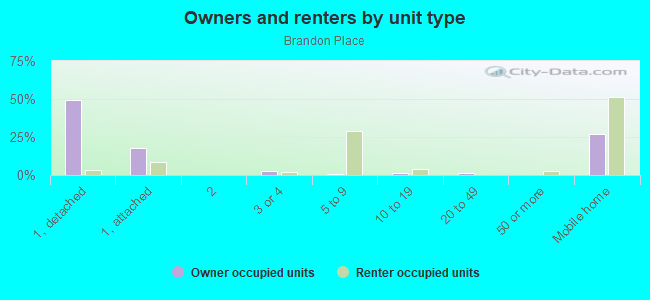
Owner-occupied
Renter-occupied

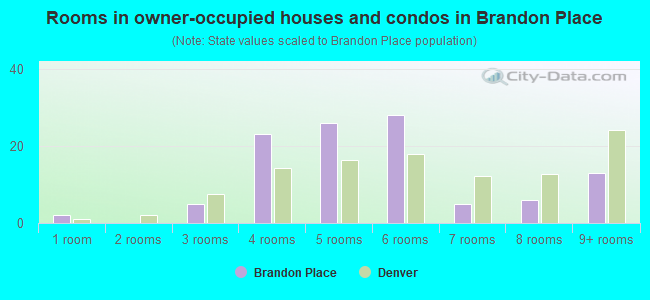
- Rooms in owner-occupied houses and condos in Brandon Place
- 21 room
- 02 rooms
- 53 rooms
- 234 rooms
- 265 rooms
- 286 rooms
- 57 rooms
- 68 rooms
- 139+ rooms
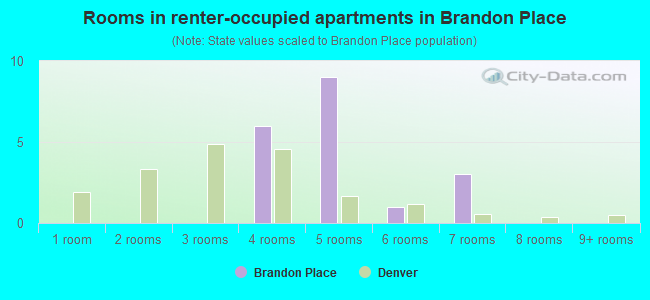
- Rooms in renter-occupied apartments in Brandon Place
- 01 room
- 02 rooms
- 03 rooms
- 64 rooms
- 95 rooms
- 16 rooms
- 37 rooms
- 08 rooms
- 09+ rooms
Owner-occupied
Renter-occupied
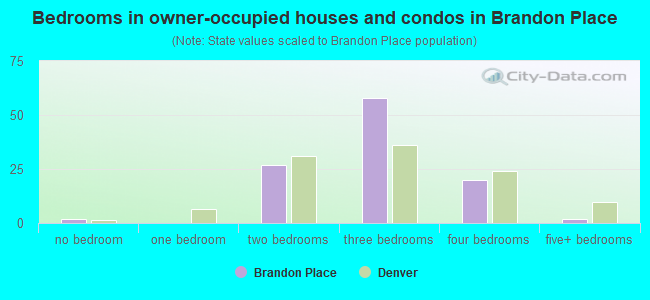
- Bedrooms in owner-occupied houses and condos in Brandon Place
- 2no bedroom
- 01 bedroom
- 272 bedrooms
- 583 bedrooms
- 204 bedrooms
- 25+ bedrooms
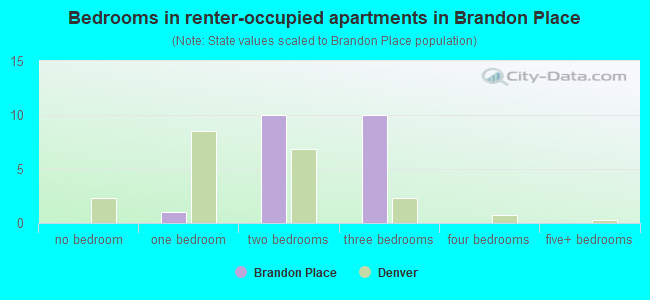
- Bedrooms in renter-occupied apartments in Brandon Place
- 0no bedroom
- 11 bedroom
- 102 bedrooms
- 103 bedrooms
- 04 bedrooms
- 05+ bedrooms
Average number of cars or other vehicles available in houses/condos:
Average number of cars or other vehicles available in apartments:
| This neighborhood: | 2.1 |
| Denver: | 1.9 |
Average number of cars or other vehicles available in apartments:
| Here: | 1.5 |
| city: | 1.3 |
Percentage of units with a mortgage:
| Brandon Place: | 64.1% |
| Denver: | 75.6% |
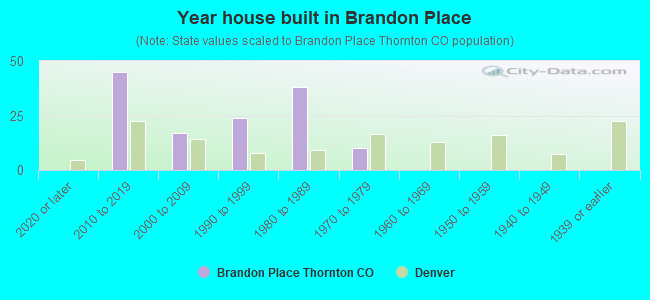
- Year house built in Brandon Place
- 02020 or later
- 452010 to 2019
- 172000 to 2009
- 241990 to 1999
- 381980 to 1989
- 101970 to 1979
- 01960 to 1969
- 01950 to 1959
- 01940 to 1949
- 01939 or earlier
City-data.com crime index for city in 2020 (higher means more crime):
| City: | 519.0 |
| U.S. average: | 219.5 |
Travel time to work (commute)
![Travel time to work (commute)]()
- 3Less than 5 minutes
- 15 to 9 minutes
- 810 to 14 minutes
- 2415 to 19 minutes
- 1820 to 24 minutes
- 425 to 29 minutes
- 3830 to 34 minutes
- 635 to 39 minutes
- 1540 to 44 minutes
- 2545 to 59 minutes
- 860 to 89 minutes
- 890 or more minutes

Means of transportation to work
![Means of transportation to work]()
- 74.0%161Drove a car alone
- 16.5%36Carpooled
- 3.2%7Bus
- 0.5%1Light rail, streetcar or trolley
- 0.9%2Bicycle
- 5.1%11Worked at home

Time leaving home to go to work
![Time leaving home to go to work]()
- 1412:00 a.m. to 4:59 a.m.
- 65:00 a.m. to 5:29 a.m.
- 55:30 a.m. to 5:59 a.m.
- 246:00 a.m. to 6:29 a.m.
- 126:30 a.m. to 6:59 a.m.
- 207:00 a.m. to 7:29 a.m.
- 187:30 a.m. to 7:59 a.m.
- 138:00 a.m. to 8:29 a.m.
- 18:30 a.m. to 8:59 a.m.
- 49:00 a.m. to 9:59 a.m.
- 110:00 a.m. to 10:59 a.m.
- 311:00 a.m. to 11:59 a.m.
- 1112:00 p.m. to 3:59 p.m.
- 144:00 p.m. to 11:59 p.m.

Occupations of males:
- Percentage of males in management occupations (except farmers):
Here: 7.2% city: 15.4%
- Percentage of males in business and financial operations occupations:
Here: 6.5% city: 8.3%
- Percentage of males in computer and mathematical occupations:
Here: 5.6% city: 7.4%
- Percentage of males in architecture and engineering occupations:
Here: 10.9% city: 4.5%
- Percentage of males in education, training, and library occupations:
Here: 3.0% city: 3.1%
- Percentage of males in arts, design, entertainment, sports, and media occupations:
Here: 1.4% city: 3.1%
- Percentage of males in healthcare practitioners and technical occupations:
Here: 3.3% city: 3.5%
- Percentage of males in service occupations:
Here: 15.8% city: 11.9%
- Percentage of males in sales and office occupations:
Here: 2.1% city: 15.4%
- Percentage of males in construction, extraction, and maintenance occupations:
Here: 19.0% city: 8.0%
- Percentage of males in production occupations:
Here: 2.1% city: 3.2%
- Percentage of males in transportation occupations:
Here: 15.8% city: 4.2%
- Percentage of males in material moving occupations:
Here: 4.3% city: 3.5%
Occupations of females:
- Percentage of females in management occupations (except farmers):
Here: 10.1% city: 14.0%
- Percentage of females in business and financial operations occupations:
Here: 6.6% city: 10.0%
- Percentage of females in computer and mathematical occupations:
Here: 1.9% city: 2.9%
- Percentage of females in community and social services occupations:
Here: 1.6% city: 3.0%
- Percentage of females in education, training, and library occupations:
Here: 1.9% city: 7.9%
- Percentage of females in healthcare practitioners and technical occupations:
Here: 6.0% city: 10.2%
- Percentage of females in service occupations:
Here: 28.6% city: 16.2%
- Percentage of females in sales and office occupations:
Here: 36.0% city: 21.4%
- Percentage of females in farming, fishing, and forestry occupations:
Here: 1.0% city: 0.1%
- Percentage of females in construction, extraction, and maintenance occupations:
Here: 1.2% city: 0.4%
- Percentage of females in material moving occupations:
Here: 7.2% city: 1.4%
Percentage of people 16-64 in Armed Forces:
| Brandon Place: | 0.2% |
| Denver: | 0.3% |
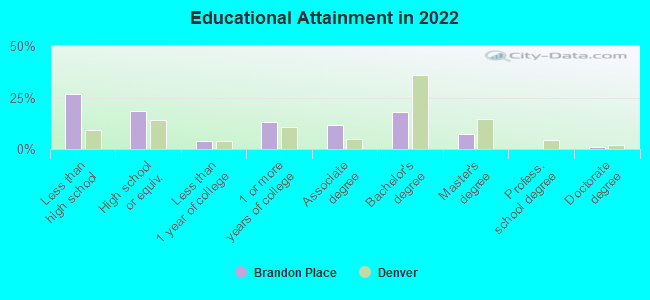
Education in this neighborhood (subdivision or community):
- Percentage of people 3 years and older in K-12 schools:
Brandon Place: 15.5% Denver: 12.7%
- Percentage of people 3 years and older in undergraduate colleges:
Brandon Place: 7.6% Denver: 4.1%
- Percentage of people 3 years and older in grad. or professional schools:
Brandon Place: 0.8% Denver: 2.2%
- Percentage of students K-12 enrolled in private schools:
Brandon Place: 5.1% Denver: 11.0%
Percentage of population below poverty level:
| Brandon Place: | 7.6% |
| Denver: | 11.8% |
Median year owner moved in (as recorded in 2022):
Median year renter moved in (as recorded in 2022):
| Brandon Place: | 2014 |
| Denver: | 2014 |
Median year renter moved in (as recorded in 2022):
| Brandon Place: | 2016 |
| Denver: | 2021 |
Percentage of married-couple families with both working:
| Brandon Place: | 65.1% |
| Denver: | 74.1% |
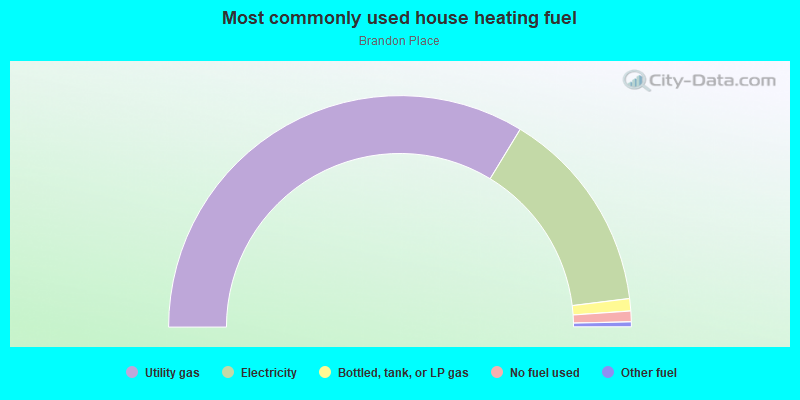
- 67.4%Utility gas
- 28.7%Electricity
- 1.7%Bottled, tank, or LP gas
- 1.5%No fuel used
- 0.7%Other fuel
Roads and streets:
E 94th Pl
Length: 0.53 miles
Directions: E-W, N-S, SE-NW, SW-NE
Address range: 4062 to 4599
Directions: E-W, N-S, SE-NW, SW-NE
Address range: 4062 to 4599
E 94th Dr
Length: 0.36 miles
Directions: E-W, SE-NW
Address range: 4200 to 4699
Directions: E-W, SE-NW
Address range: 4200 to 4699
Albion St
Length: 0.10 miles
Directions: N-S, SW-NE
Address range: 9430 to 9599
Directions: N-S, SW-NE
Address range: 9430 to 9599
Clemont St
Length: 0.08 miles
Direction: N-S
Address range: 9429 to 9485
Direction: N-S
Address range: 9429 to 9485
Birch St
Length: 0.08 miles
Direction: N-S
Address range: 9425 to 9498
Direction: N-S
Address range: 9425 to 9498
Bellaire St
Length: 0.06 miles
Directions: N-S, SE-NW
Address range: 9421 to 9484
Directions: N-S, SE-NW
Address range: 9421 to 9484
Cherry St
Length: 0.06 miles
Directions: N-S, SW-NE
Address range: 9400 to 9499
Directions: N-S, SW-NE
Address range: 9400 to 9499