Briarwood neighborhood in Laurel, Maryland (MD), 20708 detailed profile
Settings
X


Business Search - 14 Million verified businesses
Area: 0.247 square miles
Population: 1,536
Population density:
| Briarwood: | 6,230 people per square mile |
| Laurel: | 7,825 people per square mile |

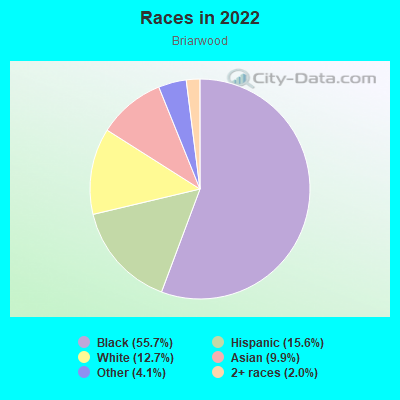
- 85855.7%Black
- 24115.6%Hispanic or Latino
- 19612.7%White
- 1529.9%Asian
- 634.1%Some other race
- 312.0%Two or more races
Median household income in 2022:
| Briarwood: | $61,866 |
| Laurel: | $92,035 |
Distribution of median household income
![Distribution of median household income]()
- 30Less than $10,000
- 40$10,000 to $19,999
- 98$20,000 to $29,999
- 246$30,000 to $39,999
- 112$40,000 to $49,999
- 53$50,000 to $59,999
- 48$60,000 to $74,999
- 76$75,000 to $99,999
- 74$100,000 to $124,999
- 41$125,000 to $149,999
- 37$150,000 to $199,999
- 74$200,000 or more

Distribution of owner-occupied house/condo value
![Distribution of owner-occupied house/condo value]()
- 52$150,000 to $199,999
- 11$200,000 to $249,999
- 7$250,000 to $299,999
- 34$300,000 to $399,999
- 49$400,000 to $499,999
- 100$500,000 to $749,999

Distribution of rent paid by renters
![Distribution of rent paid by renters]()
- 38$100 to $199
- 20$300 to $399
- 24$400 to $499
- 15$600 to $699
- 8$700 to $799
- 30$900 to $999
- 56$1,000 to $1,249
- 151$1,250 to $1,499
- 193$1,500 to $1,999
- 43$2,000 or more

Median rent in 2022:
| Briarwood: | $1,559 |
| Laurel: | $1,707 |
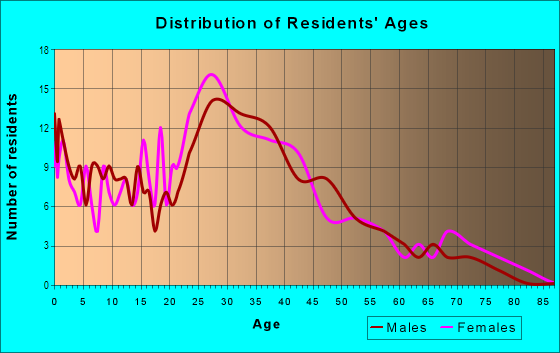
| Males: | 734 |
| Females: | 802 |
Males:
| This neighborhood: | 32.1 years |
| Whole city: | 36.3 years |
| This neighborhood: | 43.6 years |
| Whole city: | 36.4 years |
Average household size:
| Briarwood: | 2.3 people |
| Laurel: | 2.5 people |
Percentage of family households:
| Briarwood: | 46.8% |
| Laurel: | 45.9% |
| Here: | 33.8% |
| Laurel: | 36.1% |
Percentage of married-couple families with children (among all households):
| Briarwood: | 19.1% |
| Laurel: | 23.9% |
Percentage of single-mother households (among all households):
| Briarwood: | 23.5% |
| Laurel: | 14.6% |
Percentage of never married males 15 years old and over:
Percentage of never married females 15 years old and over:
| Briarwood: | 15.4% |
| Laurel: | 18.2% |
Percentage of never married females 15 years old and over:
| Briarwood: | 25.2% |
| city: | 22.7% |
Percentage of people that speak English not well or not at all:
| Briarwood: | 5.7% |
| Laurel: | 7.1% |
Percentage of people born in this state:
Percentage of people born in another U.S. state:
Percentage of native residents but born outside the U.S.:
Percentage of foreign born residents:
| Here: | 36.3% |
| Laurel: | 33.6% |
Percentage of people born in another U.S. state:
| Briarwood: | 33.5% |
| Laurel: | 36.1% |
Percentage of native residents but born outside the U.S.:
| Here: | 1.8% |
| city: | 1.4% |
Percentage of foreign born residents:
| Here: | 28.4% |
| Laurel: | 29.0% |
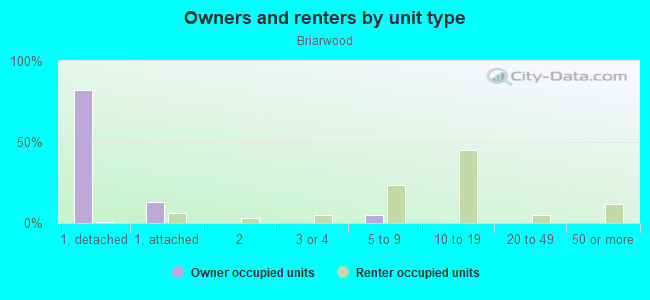
Owner-occupied
Renter-occupied

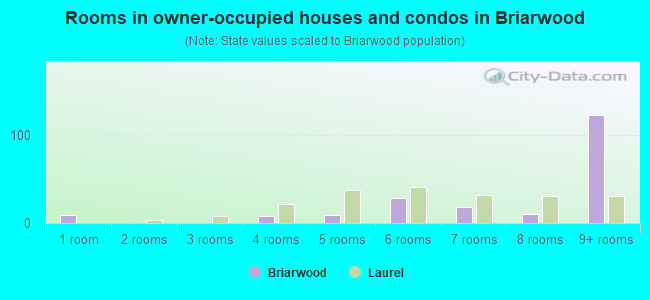
- Rooms in owner-occupied houses and condos in Briarwood
- 91 room
- 02 rooms
- 03 rooms
- 84 rooms
- 95 rooms
- 286 rooms
- 187 rooms
- 108 rooms
- 1239+ rooms
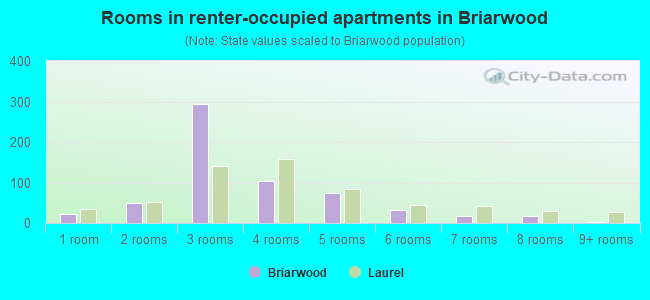
- Rooms in renter-occupied apartments in Briarwood
- 211 room
- 492 rooms
- 2933 rooms
- 1044 rooms
- 755 rooms
- 326 rooms
- 187 rooms
- 178 rooms
- 29+ rooms
Owner-occupied
Renter-occupied
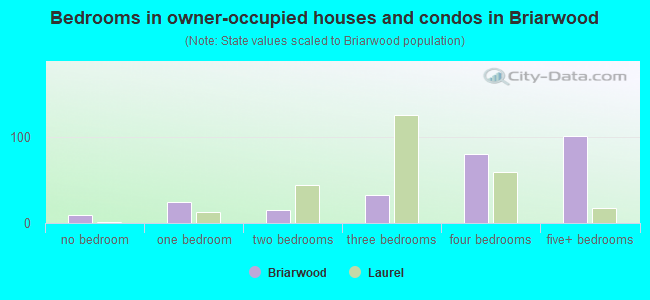
- Bedrooms in owner-occupied houses and condos in Briarwood
- 9no bedroom
- 241 bedroom
- 152 bedrooms
- 333 bedrooms
- 814 bedrooms
- 1015+ bedrooms
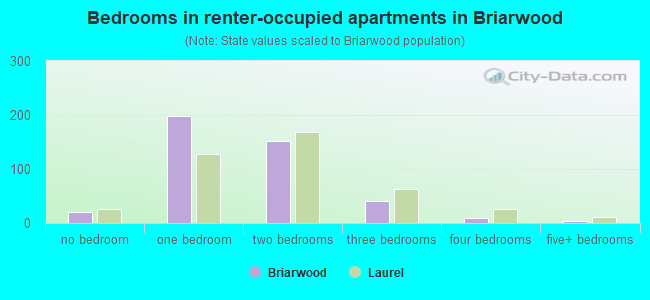
- Bedrooms in renter-occupied apartments in Briarwood
- 21no bedroom
- 1981 bedroom
- 1522 bedrooms
- 403 bedrooms
- 94 bedrooms
- 45+ bedrooms
Average number of cars or other vehicles available in houses/condos:
Average number of cars or other vehicles available in apartments:
| This neighborhood: | |
| Laurel: |
Average number of cars or other vehicles available in apartments:
| Here: | 1.2 |
| city: | 1.3 |
Percentage of units with a mortgage:
| Briarwood: | 68.3% |
| Laurel: | 82.5% |
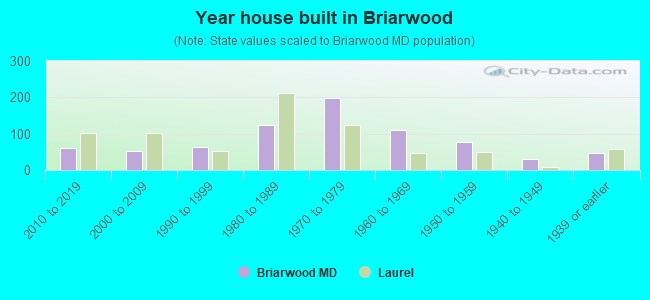
- Year house built in Briarwood
- 02020 or later
- 612010 to 2019
- 522000 to 2009
- 631990 to 1999
- 1231980 to 1989
- 1971970 to 1979
- 1101960 to 1969
- 761950 to 1959
- 291940 to 1949
- 461939 or earlier
City-data.com crime index for city in 2020 (higher means more crime):
| City: | 232.4 |
| U.S. average: | 219.5 |
Travel time to work (commute)
![Travel time to work (commute)]()
- 4Less than 5 minutes
- 345 to 9 minutes
- 5210 to 14 minutes
- 5315 to 19 minutes
- 9620 to 24 minutes
- 4725 to 29 minutes
- 12030 to 34 minutes
- 1935 to 39 minutes
- 5140 to 44 minutes
- 15945 to 59 minutes
- 9160 to 89 minutes
- 2990 or more minutes

Means of transportation to work
![Means of transportation to work]()
- 72.2%618Drove a car alone
- 10.4%89Carpooled
- 3.0%26Bus
- 0.6%5Subway or elevated rail
- 11.1%95Long-distance train or commuter rail
- 16.5%141Taxi
- 1.5%13Bicycle
- 2.8%24Walked
- 10.3%88Worked at home

Time leaving home to go to work
![Time leaving home to go to work]()
- 3512:00 a.m. to 4:59 a.m.
- 345:00 a.m. to 5:29 a.m.
- 485:30 a.m. to 5:59 a.m.
- 486:00 a.m. to 6:29 a.m.
- 596:30 a.m. to 6:59 a.m.
- 747:00 a.m. to 7:29 a.m.
- 597:30 a.m. to 7:59 a.m.
- 618:00 a.m. to 8:29 a.m.
- 588:30 a.m. to 8:59 a.m.
- 579:00 a.m. to 9:59 a.m.
- 3210:00 a.m. to 10:59 a.m.
- 9611:00 a.m. to 11:59 a.m.
- 4212:00 p.m. to 3:59 p.m.
- 954:00 p.m. to 11:59 p.m.

Occupations of males:
- Percentage of males in management occupations (except farmers):
Here: 9.1% city: 10.4%
- Percentage of males in business and financial operations occupations:
Here: 2.8% city: 5.3%
- Percentage of males in computer and mathematical occupations:
Here: 11.0% city: 10.2%
- Percentage of males in architecture and engineering occupations:
Here: 3.7% city: 2.9%
- Percentage of males in life, physical, and social science occupations:
Here: 1.5% city: 2.3%
- Percentage of males in community and social services occupations:
Here: 3.4% city: 2.4%
- Percentage of males in legal occupations:
Here: 1.2% city: 2.1%
- Percentage of males in education, training, and library occupations:
Here: 3.7% city: 4.1%
- Percentage of males in arts, design, entertainment, sports, and media occupations:
Here: 1.3% city: 1.1%
- Percentage of males in service occupations:
Here: 17.5% city: 11.2%
- Percentage of males in sales and office occupations:
Here: 5.4% city: 14.0%
- Percentage of males in construction, extraction, and maintenance occupations:
Here: 12.9% city: 9.4%
- Percentage of males in production occupations:
Here: 9.5% city: 3.6%
- Percentage of males in transportation occupations:
Here: 10.2% city: 7.7%
- Percentage of males in material moving occupations:
Here: 5.5% city: 4.2%
Occupations of females:
- Percentage of females in management occupations (except farmers):
Here: 16.5% city: 14.6%
- Percentage of females in business and financial operations occupations:
Here: 2.5% city: 9.2%
- Percentage of females in computer and mathematical occupations:
Here: 6.5% city: 4.7%
- Percentage of females in community and social services occupations:
Here: 1.4% city: 3.0%
- Percentage of females in education, training, and library occupations:
Here: 7.7% city: 9.6%
- Percentage of females in healthcare practitioners and technical occupations:
Here: 6.2% city: 11.9%
- Percentage of females in service occupations:
Here: 21.3% city: 15.4%
- Percentage of females in sales and office occupations:
Here: 28.9% city: 21.6%
- Percentage of females in construction, extraction, and maintenance occupations:
Here: 3.5% city: 0.0%
- Percentage of females in production occupations:
Here: 1.6% city: 1.2%
- Percentage of females in transportation occupations:
Here: 1.3% city: 0.6%
- Percentage of females in material moving occupations:
Here: 1.1% city: 2.9%
Percentage of people 16-64 in Armed Forces:
| Briarwood: | 0.7% |
| Laurel: | 1.2% |
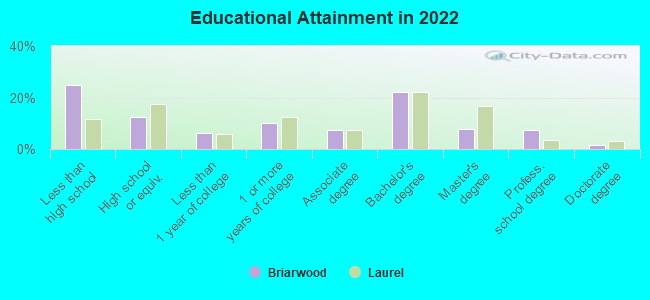
Education in this neighborhood (subdivision or community):
- Percentage of people 3 years and older in K-12 schools:
Briarwood: 15.0% Laurel: 16.8%
- Percentage of people 3 years and older in undergraduate colleges:
Briarwood: 5.9% Laurel: 6.3%
- Percentage of people 3 years and older in grad. or professional schools:
Briarwood: 2.4% Laurel: 3.9%
- Percentage of students K-12 enrolled in private schools:
Briarwood: 45.8% Laurel: 15.0%
Percentage of population below poverty level:
| Briarwood: | 9.6% |
| Laurel: | 10.6% |
Median year renter moved in (as recorded in 2022):
| Briarwood: | 2018 |
| Laurel: | 2018 |
Percentage of married-couple families with both working:
| Briarwood: | 94.7% |
| Laurel: | 76.8% |
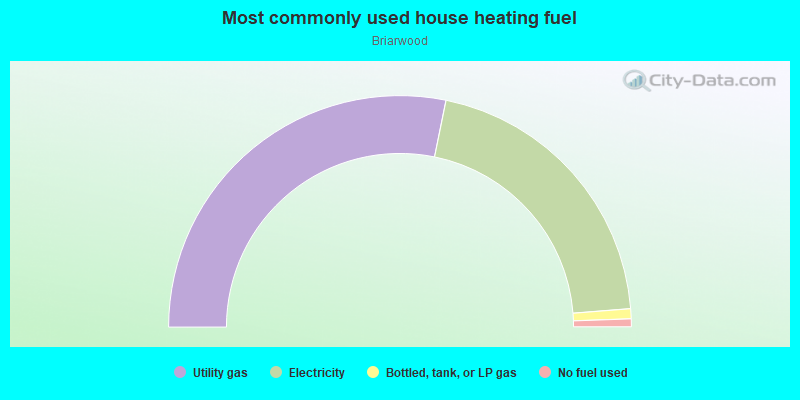
- 56.4%Utility gas
- 41.1%Electricity
- 1.4%Bottled, tank, or LP gas
- 1.1%No fuel used
Highways in this neighborhood:
Laurel Bowie Rd (State Hwy 197)
Length: 0.36 miles
Direction: N-S
Address range: 13700 to 13798
Direction: N-S
Address range: 13700 to 13798
Roads and streets:
Briarwood Dr
Length: 1.07 miles
Directions: E-W, N-S, SE-NW, SW-NE
Address range: 13600 to 14037
Directions: E-W, N-S, SE-NW, SW-NE
Address range: 13600 to 14037
Briarcroft Ln
Length: 0.72 miles
Directions: E-W, SW-NE
Address range: 8500 to 8999
Directions: E-W, SW-NE
Address range: 8500 to 8999
Briarchip St
Length: 0.49 miles
Directions: E-W, N-S, SE-NW, SW-NE
Address range: 9100 to 9233
Directions: E-W, N-S, SE-NW, SW-NE
Address range: 9100 to 9233
Engleman Dr
Length: 0.32 miles
Directions: E-W, SE-NW, SW-NE
Address range: 13600 to 13799
Directions: E-W, SE-NW, SW-NE
Address range: 13600 to 13799
Tupelo Ave
Length: 0.16 miles
Direction: E-W
Address range: 8600 to 8617
Direction: E-W
Address range: 8600 to 8617
Briarcroft Ct
Length: 0.04 miles
Direction: N-S
Address range: 13500 to 13599
Direction: N-S
Address range: 13500 to 13599
Briarwood Ct
Length: 0.04 miles
Direction: E-W
Address range: 8600 to 8610
Direction: E-W
Address range: 8600 to 8610
Briarchip Ct
Length: 0.03 miles
Direction: N-S
Address range: 14000 to 14010
Direction: N-S
Address range: 14000 to 14010
Railroad features:
Csx RR
Length: 0.27 miles
Direction: SW-NE
Direction: SW-NE
Other features:
Patuxent River Tributary
Length: 0.50 miles
Directions: E-W, SE-NW, SW-NE
Directions: E-W, SE-NW, SW-NE