Brighton Avenue (Brighton Ave) neighborhood in Albany, California (CA), 94706 detailed profile
Settings
X


Business Search - 14 Million verified businesses
Area: 0.053 square miles
Population: 1,528
Population density:
| Brighton Avenue (Brighton Ave): | 29,077 people per square mile |
| Albany: | 11,771 people per square mile |

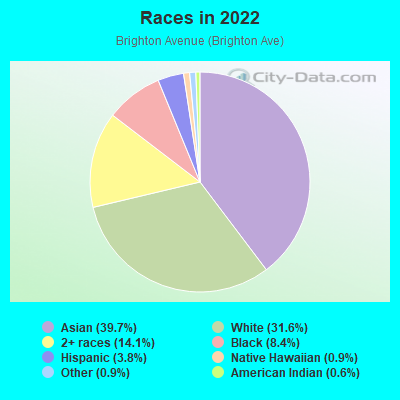
- 61239.7%Asian
- 48731.6%White
- 21714.1%Two or more races
- 1308.4%Black
- 583.8%Hispanic or Latino
- 140.9%Native Hawaiian and Other
Pacific Islander - 140.9%Some other race
- 90.6%American Indian
Median household income in 2022:
| Brighton Avenue (Brighton Ave): | $127,941 |
| Albany: | $124,469 |
Distribution of median household income
![Distribution of median household income]()
- 45Less than $10,000
- 11$10,000 to $19,999
- 16$20,000 to $29,999
- 20$30,000 to $39,999
- 18$40,000 to $49,999
- 9$50,000 to $59,999
- 32$60,000 to $74,999
- 73$75,000 to $99,999
- 68$100,000 to $124,999
- 5$125,000 to $149,999
- 125$150,000 to $199,999
- 198$200,000 or more

Distribution of owner-occupied house/condo value
![Distribution of owner-occupied house/condo value]()
- 45Less than $50,000
- 10$300,000 to $399,999
- 42$500,000 to $749,999
- 18$750,000 to $999,999
- 108$1,000,000 or more

Distribution of rent paid by renters
![Distribution of rent paid by renters]()
- 7$800 to $899
- 22$1,000 to $1,249
- 18$1,250 to $1,499
- 35$1,500 to $1,999
- 292$2,000 or more

Median rent in 2022:
| Brighton Avenue (Brighton Ave): | $2,419 |
| Albany: | $2,001 |
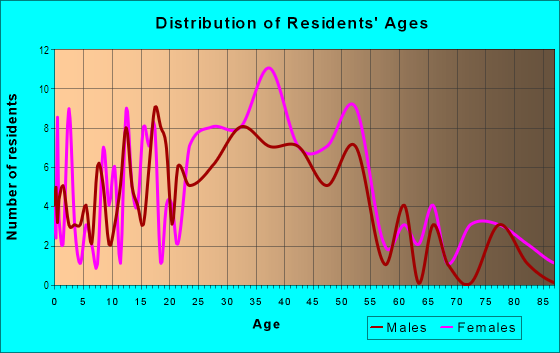
| Males: | 723 |
| Females: | 804 |
Males:
| This neighborhood: | 38.0 years |
| Whole city: | 36.7 years |
| This neighborhood: | 41.0 years |
| Whole city: | 37.8 years |
Average household size:
| Brighton Avenue (Brighton Ave): | 2.5 people |
| Albany: | 2.5 people |
Percentage of family households:
| Brighton Avenue (Brighton Ave): | 62.0% |
| Albany: | 53.9% |
| Here: | 48.4% |
| Albany: | 52.7% |
Percentage of married-couple families with children (among all households):
| Brighton Avenue (Brighton Ave): | 31.1% |
| Albany: | 30.7% |
Percentage of single-mother households (among all households):
| Brighton Avenue (Brighton Ave): | 3.3% |
| Albany: | 6.2% |
Percentage of never married males 15 years old and over:
Percentage of never married females 15 years old and over:
| Brighton Avenue (Brighton Ave): | 22.8% |
| Albany: | 15.4% |
Percentage of never married females 15 years old and over:
| Brighton Avenue (Brighton Ave): | 19.6% |
| city: | 16.2% |
Percentage of people that speak English not well or not at all:
| Brighton Avenue (Brighton Ave): | 4.9% |
| Albany: | 3.4% |
Percentage of people born in this state:
Percentage of people born in another U.S. state:
Percentage of native residents but born outside the U.S.:
Percentage of foreign born residents:
| Here: | 35.1% |
| Albany: | 46.0% |
Percentage of people born in another U.S. state:
| Brighton Avenue (Brighton Ave): | 25.4% |
| Albany: | 25.0% |
Percentage of native residents but born outside the U.S.:
| Here: | 2.0% |
| city: | 2.0% |
Percentage of foreign born residents:
| Here: | 37.5% |
| Albany: | 27.0% |
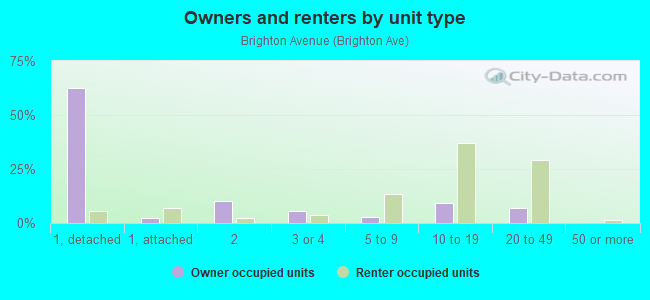
Owner-occupied
Renter-occupied

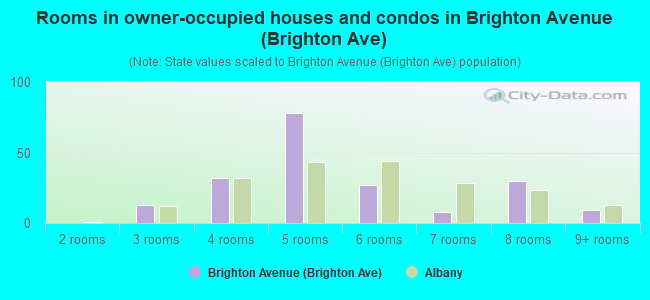
- Rooms in owner-occupied houses and condos in Brighton Avenue <
> - 01 room
- 02 rooms
- 133 rooms
- 324 rooms
- 785 rooms
- 276 rooms
- 87 rooms
- 308 rooms
- 99+ rooms
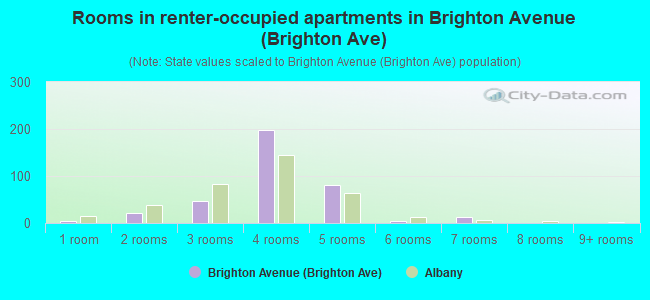
- Rooms in renter-occupied apartments in Brighton Avenue <
> - 51 room
- 222 rooms
- 473 rooms
- 1984 rooms
- 805 rooms
- 56 rooms
- 127 rooms
- 08 rooms
- 09+ rooms
Owner-occupied
Renter-occupied
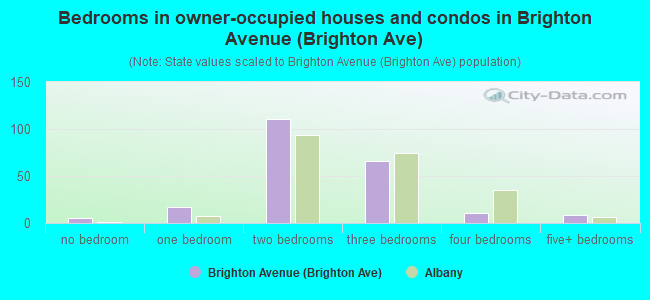
- Bedrooms in owner-occupied houses and condos in Brighton Avenue <
> - 5no bedroom
- 171 bedroom
- 1112 bedrooms
- 663 bedrooms
- 114 bedrooms
- 95+ bedrooms
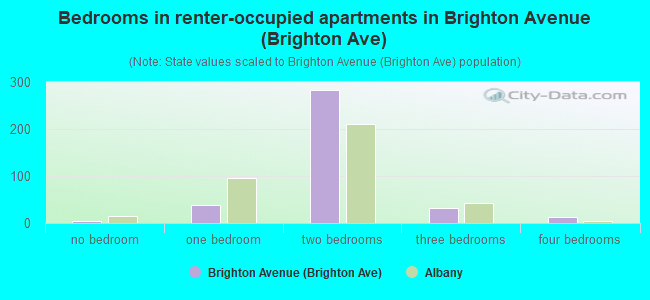
- Bedrooms in renter-occupied apartments in Brighton Avenue <
> - 5no bedroom
- 381 bedroom
- 2822 bedrooms
- 323 bedrooms
- 124 bedrooms
- 05+ bedrooms
Average number of cars or other vehicles available in houses/condos:
Average number of cars or other vehicles available in apartments:
| This neighborhood: | 1.6 |
| Albany: | 1.7 |
Average number of cars or other vehicles available in apartments:
| Here: | 1.3 |
| city: | 1.2 |
Percentage of units with a mortgage:
| Brighton Avenue (Brighton Ave): | 78.2% |
| Albany: | 63.1% |
Housing prices:
- Average estimated value of detached houses in 2022 (30.4% of all units):
Brighton Avenue (Brighton Ave): $1,147,614 Albany: $1,319,775
- Average estimated value of townhouses or other attached units in 2022 (5.7% of all units):
This neighborhood: $10,037 city: $961,729
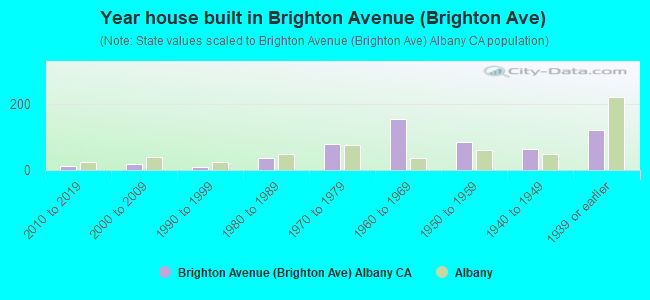
- Year house built in Brighton Avenue <
> - 02020 or later
- 122010 to 2019
- 172000 to 2009
- 91990 to 1999
- 371980 to 1989
- 781970 to 1979
- 1541960 to 1969
- 861950 to 1959
- 631940 to 1949
- 1231939 or earlier
City-data.com crime index for city in 2020 (higher means more crime):
| City: | 155.8 |
| U.S. average: | 219.5 |
Travel time to work (commute)
![Travel time to work (commute)]()
- 27Less than 5 minutes
- 395 to 9 minutes
- 4310 to 14 minutes
- 3415 to 19 minutes
- 6020 to 24 minutes
- 1225 to 29 minutes
- 5430 to 34 minutes
- 1035 to 39 minutes
- 2840 to 44 minutes
- 11045 to 59 minutes
- 6660 to 89 minutes
- 1090 or more minutes

Means of transportation to work
![Means of transportation to work]()
- 40.8%387Drove a car alone
- 1.7%16Carpooled
- 1.4%13Bus
- 13.8%131Subway or elevated rail
- 1.7%16Long-distance train or commuter rail
- 2.8%27Light rail, streetcar or trolley
- 0.5%5Motorcycle
- 0.7%7Bicycle
- 6.8%64Walked
- 31.0%294Worked at home

Time leaving home to go to work
![Time leaving home to go to work]()
- 1312:00 a.m. to 4:59 a.m.
- 95:00 a.m. to 5:29 a.m.
- 155:30 a.m. to 5:59 a.m.
- 356:00 a.m. to 6:29 a.m.
- 366:30 a.m. to 6:59 a.m.
- 607:00 a.m. to 7:29 a.m.
- 237:30 a.m. to 7:59 a.m.
- 848:00 a.m. to 8:29 a.m.
- 338:30 a.m. to 8:59 a.m.
- 379:00 a.m. to 9:59 a.m.
- 1610:00 a.m. to 10:59 a.m.
- 4211:00 a.m. to 11:59 a.m.
- 3512:00 p.m. to 3:59 p.m.
- 44:00 p.m. to 11:59 p.m.

Occupations of males:
- Percentage of males in management occupations (except farmers):
Here: 19.1% city: 14.2%
- Percentage of males in business and financial operations occupations:
Here: 3.5% city: 5.6%
- Percentage of males in computer and mathematical occupations:
Here: 7.9% city: 9.7%
- Percentage of males in architecture and engineering occupations:
Here: 5.1% city: 7.5%
- Percentage of males in life, physical, and social science occupations:
Here: 4.5% city: 7.6%
- Percentage of males in community and social services occupations:
Here: 1.5% city: 1.8%
- Percentage of males in legal occupations:
Here: 7.1% city: 2.8%
- Percentage of males in education, training, and library occupations:
Here: 6.4% city: 12.0%
- Percentage of males in arts, design, entertainment, sports, and media occupations:
Here: 2.7% city: 6.3%
- Percentage of males in healthcare practitioners and technical occupations:
Here: 4.2% city: 2.3%
- Percentage of males in service occupations:
Here: 12.5% city: 6.5%
- Percentage of males in sales and office occupations:
Here: 22.2% city: 14.4%
- Percentage of males in construction, extraction, and maintenance occupations:
Here: 1.9% city: 3.3%
Occupations of females:
- Percentage of females in management occupations (except farmers):
Here: 10.9% city: 10.5%
- Percentage of females in business and financial operations occupations:
Here: 16.5% city: 13.0%
- Percentage of females in computer and mathematical occupations:
Here: 3.0% city: 4.3%
- Percentage of females in architecture and engineering occupations:
Here: 1.6% city: 3.7%
- Percentage of females in community and social services occupations:
Here: 4.7% city: 2.5%
- Percentage of females in legal occupations:
Here: 2.1% city: 4.1%
- Percentage of females in education, training, and library occupations:
Here: 5.8% city: 15.8%
- Percentage of females in arts, design, entertainment, sports, and media occupations:
Here: 12.9% city: 5.8%
- Percentage of females in healthcare practitioners and technical occupations:
Here: 5.0% city: 7.9%
- Percentage of females in service occupations:
Here: 20.8% city: 12.1%
- Percentage of females in sales and office occupations:
Here: 16.6% city: 13.8%
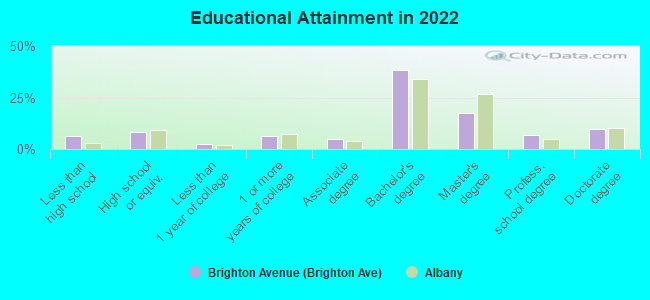
Education in this neighborhood (subdivision or community):
- Percentage of people 3 years and older in K-12 schools:
Brighton Avenue (Brighton Ave): 24.8% Albany: 18.5%
- Percentage of people 3 years and older in undergraduate colleges:
Brighton Avenue (Brighton Ave): 5.0% Albany: 6.9%
- Percentage of people 3 years and older in grad. or professional schools:
Brighton Avenue (Brighton Ave): 1.1% Albany: 5.0%
- Percentage of students K-12 enrolled in private schools:
Brighton Avenue (Brighton Ave): 2.4% Albany: 7.7%
Percentage of population below poverty level:
| Brighton Avenue (Brighton Ave): | 6.0% |
| Albany: | 9.1% |
Median year owner moved in (as recorded in 2022):
Median year renter moved in (as recorded in 2022):
| Brighton Avenue (Brighton Ave): | 2007 |
| Albany: | 2002 |
Median year renter moved in (as recorded in 2022):
| Brighton Avenue (Brighton Ave): | 2017 |
| Albany: | 2018 |
Percentage of married-couple families with both working:
| Brighton Avenue (Brighton Ave): | 79.8% |
| Albany: | 74.0% |
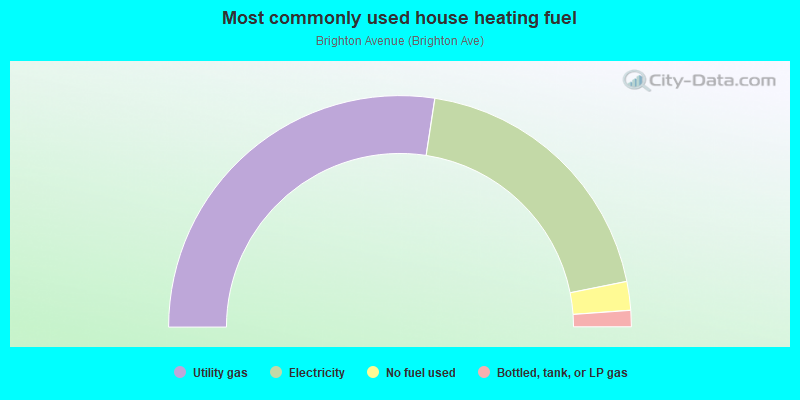
- 54.9%Utility gas
- 38.9%Electricity
- 4.0%No fuel used
- 2.3%Bottled, tank, or LP gas
Roads and streets:
Brighton Ave
Length: 0.31 miles
Direction: E-W
Address range: 1113 to 1253
Direction: E-W
Address range: 1113 to 1253
Garfield Ave
Length: 0.30 miles
Direction: E-W
Address range: 1109 to 1299
Direction: E-W
Address range: 1109 to 1299
Talbot Ave
Length: 0.12 miles
Direction: N-S
Address range: 500 to 599
Direction: N-S
Address range: 500 to 599
Masonic Ave
Length: 0.12 miles
Direction: N-S
Address range: 500 to 599
Direction: N-S
Address range: 500 to 599
Stannage Ave
Length: 0.12 miles
Direction: N-S
Address range: 500 to 599
Direction: N-S
Address range: 500 to 599
Cornell Ave
Length: 0.12 miles
Direction: N-S
Address range: 500 to 599
Direction: N-S
Address range: 500 to 599
Kains Ave
Length: 0.12 miles
Direction: N-S
Address range: 500 to 599
Direction: N-S
Address range: 500 to 599
Evelyn Ave
Length: 0.12 miles
Direction: N-S
Address range: 500 to 599
Direction: N-S
Address range: 500 to 599