Broadmoor neighborhood in Des Moines, Iowa (IA), 50310 detailed profile
Settings
X


Business Search - 14 Million verified businesses
Area: 0.130 square miles
Population: 722
Population density:
| Broadmoor: | 5,536 people per square mile |
| Des Moines: | 2,783 people per square mile |

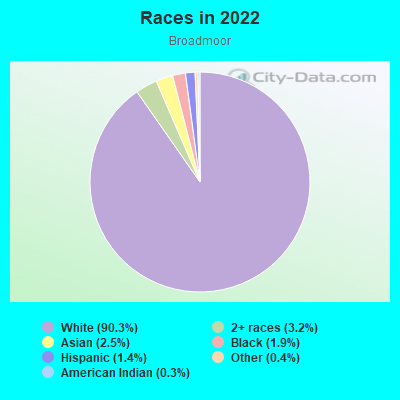
- 65090.3%White
- 233.2%Two or more races
- 182.5%Asian
- 141.9%Black
- 101.4%Hispanic or Latino
- 30.4%Some other race
- 20.3%American Indian
Median household income in 2022:
| Broadmoor: | $90,884 |
| Des Moines: | $58,018 |
Distribution of median household income
![Distribution of median household income]()
- 7Less than $10,000
- 24$10,000 to $19,999
- 13$20,000 to $29,999
- 47$30,000 to $39,999
- 36$40,000 to $49,999
- 15$50,000 to $59,999
- 24$60,000 to $74,999
- 93$75,000 to $99,999
- 40$100,000 to $124,999
- 20$125,000 to $149,999
- 46$150,000 to $199,999
- 44$200,000 or more

Distribution of owner-occupied house/condo value
![Distribution of owner-occupied house/condo value]()
- 11Less than $50,000
- 10$50,000 to $99,999
- 11$100,000 to $149,999
- 58$150,000 to $199,999
- 64$200,000 to $249,999
- 86$250,000 to $299,999
- 52$300,000 to $399,999
- 4$400,000 to $499,999
- 2$500,000 to $749,999
- 2$1,000,000 or more

Distribution of rent paid by renters
![Distribution of rent paid by renters]()
- 8$200 to $299
- 13$300 to $399
- 2$400 to $499
- 35$500 to $599
- 8$600 to $699
- 19$700 to $799
- 26$800 to $899
- 38$900 to $999
- 13$1,000 to $1,249
- 56$1,250 to $1,499
- 8$1,500 to $1,999
- 20$2,000 or more

Median rent in 2022:
| Broadmoor: | $942 |
| Des Moines: | $873 |
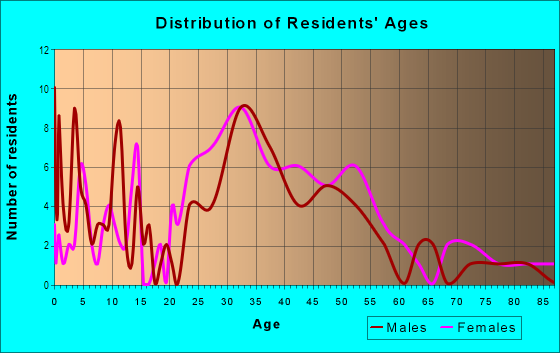
| Males: | 357 |
| Females: | 364 |
Males:
| This neighborhood: | 35.6 years |
| Whole city: | 34.7 years |
| This neighborhood: | 50.8 years |
| Whole city: | 35.5 years |
Average household size:
| Broadmoor: | 1.9 people |
| Des Moines: | 2.2 people |
Percentage of family households:
| Broadmoor: | 38.6% |
| Des Moines: | 40.8% |
| Here: | 38.9% |
| Des Moines: | 32.7% |
Percentage of married-couple families with children (among all households):
| Broadmoor: | 37.3% |
| Des Moines: | 26.2% |
Percentage of single-mother households (among all households):
| Broadmoor: | 10.0% |
| Des Moines: | 14.0% |
Percentage of never married males 15 years old and over:
Percentage of never married females 15 years old and over:
| Broadmoor: | 13.7% |
| Des Moines: | 21.4% |
Percentage of never married females 15 years old and over:
| Broadmoor: | 9.9% |
| city: | 19.3% |
Percentage of people born in this state:
Percentage of people born in another U.S. state:
Percentage of native residents but born outside the U.S.:
Percentage of foreign born residents:
| Here: | 64.7% |
| Des Moines: | 64.1% |
Percentage of people born in another U.S. state:
| Broadmoor: | 23.3% |
| Des Moines: | 19.2% |
Percentage of native residents but born outside the U.S.:
| Here: | 0.4% |
| city: | 0.5% |
Percentage of foreign born residents:
| Here: | 11.6% |
| Des Moines: | 16.2% |
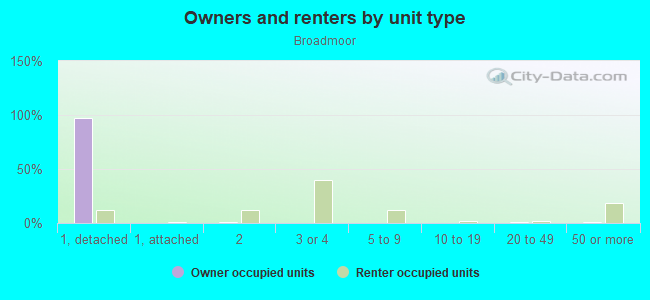
Owner-occupied
Renter-occupied

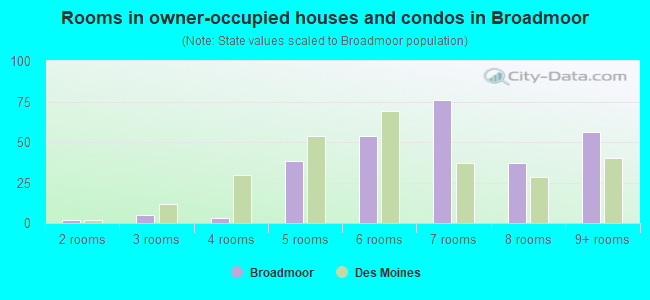
- Rooms in owner-occupied houses and condos in Broadmoor
- 01 room
- 22 rooms
- 53 rooms
- 34 rooms
- 385 rooms
- 546 rooms
- 767 rooms
- 378 rooms
- 569+ rooms
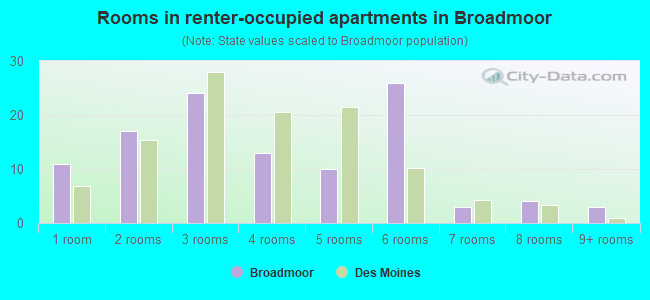
- Rooms in renter-occupied apartments in Broadmoor
- 111 room
- 172 rooms
- 243 rooms
- 134 rooms
- 105 rooms
- 266 rooms
- 37 rooms
- 48 rooms
- 39+ rooms
Owner-occupied
Renter-occupied
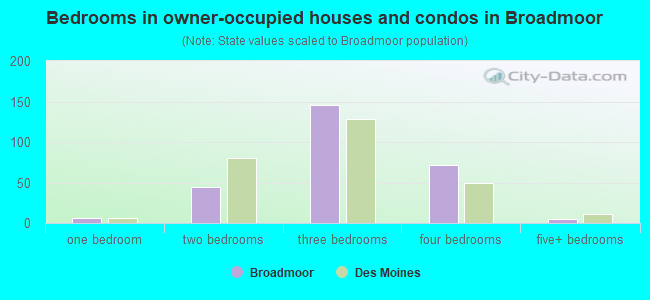
- Bedrooms in owner-occupied houses and condos in Broadmoor
- 0no bedroom
- 61 bedroom
- 452 bedrooms
- 1463 bedrooms
- 714 bedrooms
- 55+ bedrooms
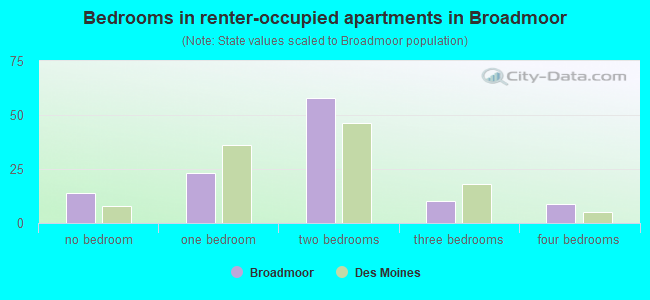
- Bedrooms in renter-occupied apartments in Broadmoor
- 14no bedroom
- 231 bedroom
- 582 bedrooms
- 103 bedrooms
- 94 bedrooms
- 05+ bedrooms
Average number of cars or other vehicles available in houses/condos:
Average number of cars or other vehicles available in apartments:
| This neighborhood: | 1.7 |
| Des Moines: | 1.9 |
Average number of cars or other vehicles available in apartments:
| Here: | 0.9 |
| city: | 1.2 |
Percentage of units with a mortgage:
| Broadmoor: | 85.4% |
| Des Moines: | 69.7% |
Average estimated value of detached houses in 2022 (72.4% of all units):
| Broadmoor: | $211,589 |
| Des Moines: | $201,532 |
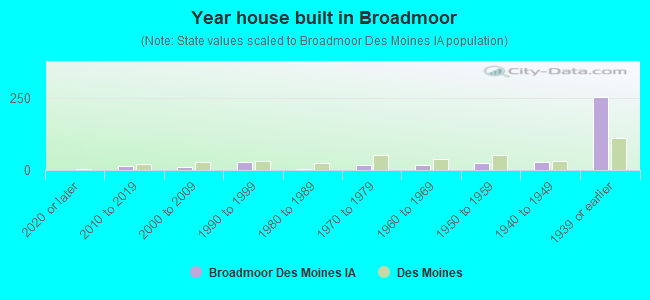
- Year house built in Broadmoor
- 02020 or later
- 132010 to 2019
- 92000 to 2009
- 271990 to 1999
- 31980 to 1989
- 191970 to 1979
- 171960 to 1969
- 251950 to 1959
- 271940 to 1949
- 2541939 or earlier
City-data.com crime index for city in 2020 (higher means more crime):
| City: | 422.4 |
| U.S. average: | 219.5 |
Travel time to work (commute)
![Travel time to work (commute)]()
- 4Less than 5 minutes
- 475 to 9 minutes
- 6110 to 14 minutes
- 9815 to 19 minutes
- 5920 to 24 minutes
- 1725 to 29 minutes
- 2030 to 34 minutes
- 1135 to 39 minutes
- 640 to 44 minutes
- 345 to 59 minutes
- 360 to 89 minutes

Means of transportation to work
![Means of transportation to work]()
- 76.1%307Drove a car alone
- 1.2%5Carpooled
- 0.5%2Bus
- 3.0%12Subway or elevated rail
- 0.2%1Motorcycle
- 0.7%3Bicycle
- 0.5%2Walked
- 2.7%11Other means
- 21.8%88Worked at home

Time leaving home to go to work
![Time leaving home to go to work]()
- 412:00 a.m. to 4:59 a.m.
- 105:00 a.m. to 5:29 a.m.
- 255:30 a.m. to 5:59 a.m.
- 86:00 a.m. to 6:29 a.m.
- 206:30 a.m. to 6:59 a.m.
- 577:00 a.m. to 7:29 a.m.
- 777:30 a.m. to 7:59 a.m.
- 358:00 a.m. to 8:29 a.m.
- 348:30 a.m. to 8:59 a.m.
- 79:00 a.m. to 9:59 a.m.
- 310:00 a.m. to 10:59 a.m.
- 2811:00 a.m. to 11:59 a.m.
- 2112:00 p.m. to 3:59 p.m.
- 234:00 p.m. to 11:59 p.m.

Occupations of males:
- Percentage of males in management occupations (except farmers):
Here: 24.6% city: 9.3%
- Percentage of males in business and financial operations occupations:
Here: 15.3% city: 5.5%
- Percentage of males in computer and mathematical occupations:
Here: 3.5% city: 6.0%
- Percentage of males in life, physical, and social science occupations:
Here: 3.3% city: 1.1%
- Percentage of males in community and social services occupations:
Here: 60.8% city: 1.0%
- Percentage of males in legal occupations:
Here: 4415.2% city: 1.4%
- Percentage of males in education, training, and library occupations:
Here: 1.1% city: 2.1%
- Percentage of males in arts, design, entertainment, sports, and media occupations:
Here: 3.6% city: 1.6%
- Percentage of males in healthcare practitioners and technical occupations:
Here: 9.0% city: 2.2%
- Percentage of males in service occupations:
Here: 8.8% city: 13.1%
- Percentage of males in sales and office occupations:
Here: 10.5% city: 15.2%
- Percentage of males in farming, fishing, and forestry occupations:
Here: 73.6% city: 0.3%
- Percentage of males in construction, extraction, and maintenance occupations:
Here: 4.4% city: 10.0%
- Percentage of males in production occupations:
Here: 33870.3% city: 9.9%
- Percentage of males in transportation occupations:
Here: 14.9% city: 6.3%
- Percentage of males in material moving occupations:
Here: 7019.5% city: 7.2%
Occupations of females:
- Percentage of females in management occupations (except farmers):
Here: 17.4% city: 8.5%
- Percentage of females in business and financial operations occupations:
Here: 5.0% city: 7.3%
- Percentage of females in computer and mathematical occupations:
Here: 9397.7% city: 2.5%
- Percentage of females in architecture and engineering occupations:
Here: 3.1% city: 0.6%
- Percentage of females in life, physical, and social science occupations:
Here: 1.9% city: 0.7%
- Percentage of females in community and social services occupations:
Here: 5.2% city: 2.1%
- Percentage of females in legal occupations:
Here: 4.3% city: 1.3%
- Percentage of females in education, training, and library occupations:
Here: 6.4% city: 7.0%
- Percentage of females in arts, design, entertainment, sports, and media occupations:
Here: 4.8% city: 2.6%
- Percentage of females in healthcare practitioners and technical occupations:
Here: 8.9% city: 7.6%
- Percentage of females in service occupations:
Here: 23.4% city: 23.4%
- Percentage of females in sales and office occupations:
Here: 21.3% city: 27.7%
- Percentage of females in construction, extraction, and maintenance occupations:
Here: 6.0% city: 0.5%
- Percentage of females in production occupations:
Here: 36792.6% city: 5.0%
- Percentage of females in material moving occupations:
Here: 69.5% city: 2.1%
Percentage of people 16-64 in Armed Forces:
| Broadmoor: | 0.0% |
| Des Moines: | 0.1% |
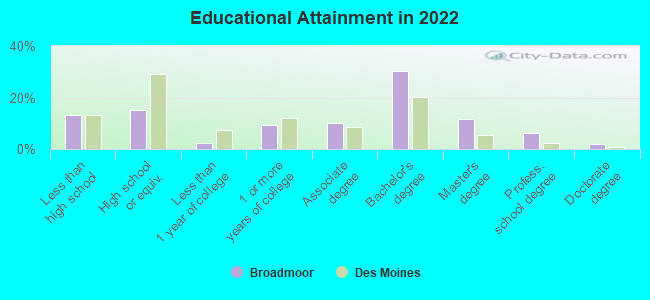
Education in this neighborhood (subdivision or community):
- Percentage of people 3 years and older in K-12 schools:
Broadmoor: 11.4% Des Moines: 17.5%
- Percentage of people 3 years and older in undergraduate colleges:
Broadmoor: 2.1% Des Moines: 3.7%
- Percentage of people 3 years and older in grad. or professional schools:
Broadmoor: 2.3% Des Moines: 1.6%
- Percentage of students K-12 enrolled in private schools:
Broadmoor: 50.0% Des Moines: 6.9%
Percentage of population below poverty level:
| Broadmoor: | 3.9% |
| Des Moines: | 14.7% |
Median year owner moved in (as recorded in 2022):
Median year renter moved in (as recorded in 2022):
| Broadmoor: | 2006 |
| Des Moines: | 2011 |
Median year renter moved in (as recorded in 2022):
| Broadmoor: | 2018 |
| Des Moines: | 2020 |
Percentage of married-couple families with both working:
| Broadmoor: | 63.2% |
| Des Moines: | 73.4% |
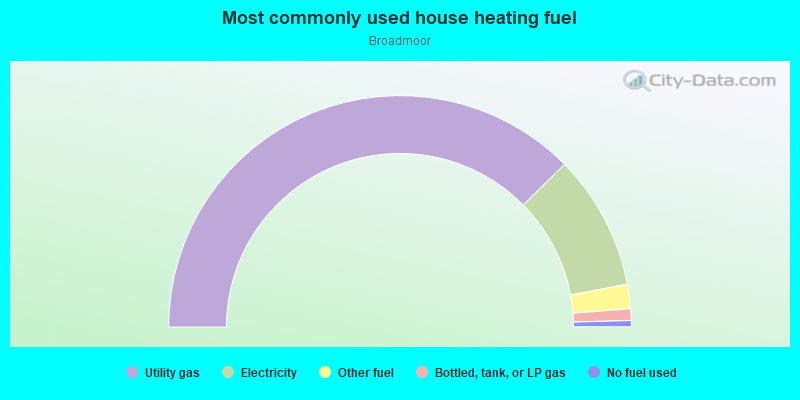
- 75.2%Utility gas
- 18.9%Electricity
- 3.4%Other fuel
- 1.6%Bottled, tank, or LP gas
- 0.9%No fuel used
Roads and streets:
Holcomb Ave
Length: 0.58 miles
Direction: E-W
Address range: 3400 to 4049
Direction: E-W
Address range: 3400 to 4049
Hickman Rd
Length: 0.58 miles
Direction: E-W
Address range: 3400 to 4029
Direction: E-W
Address range: 3400 to 4029
38th St
Length: 0.30 miles
Directions: N-S, SE-NW, SW-NE
Address range: 2300 to 2689
Directions: N-S, SE-NW, SW-NE
Address range: 2300 to 2689
40th St
Length: 0.25 miles
Directions: N-S, SW-NE
Address range: 2300 to 2700
Directions: N-S, SW-NE
Address range: 2300 to 2700
39th St
Length: 0.24 miles
Directions: N-S, SE-NW
Address range: 2300 to 2619
Directions: N-S, SE-NW
Address range: 2300 to 2619
37th St
Length: 0.24 miles
Direction: N-S
Address range: 2300 to 2699
Direction: N-S
Address range: 2300 to 2699
40th Pl
Length: 0.12 miles
Direction: N-S
Address range: 2300 to 2499
Direction: N-S
Address range: 2300 to 2499
34th St
Length: 0.12 miles
Direction: N-S
Address range: 2300 to 2499
Direction: N-S
Address range: 2300 to 2499
36th St
Length: 0.12 miles
Direction: N-S
Address range: 2300 to 2499
Direction: N-S
Address range: 2300 to 2499
35th St
Length: 0.12 miles
Direction: N-S
Address range: 2300 to 2499
Direction: N-S
Address range: 2300 to 2499