Bryant Gardens neighborhood in White Plains, New York (NY), 10605 detailed profile
Settings
X

Business Search - 14 Million verified businesses
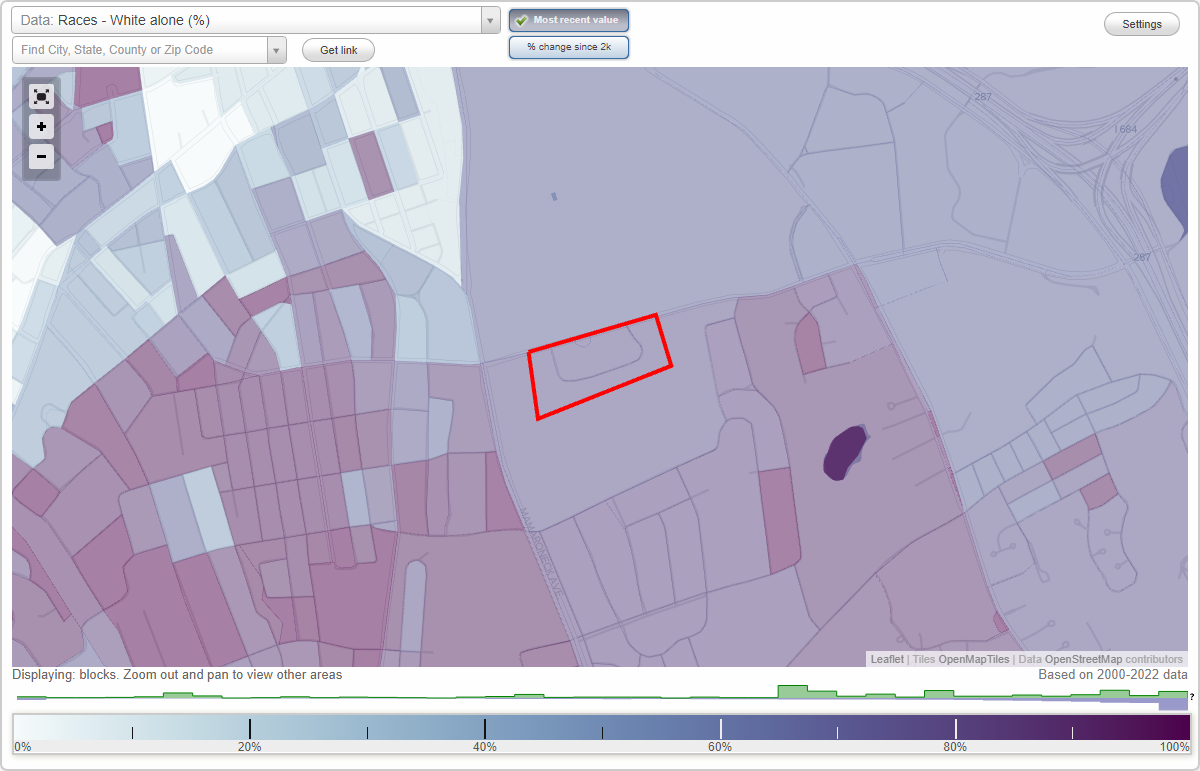
Area: 0.041 square miles
Population: 161
Population density:
| Bryant Gardens: | 3,915 people per square mile |
| White Plains: | 6,063 people per square mile |

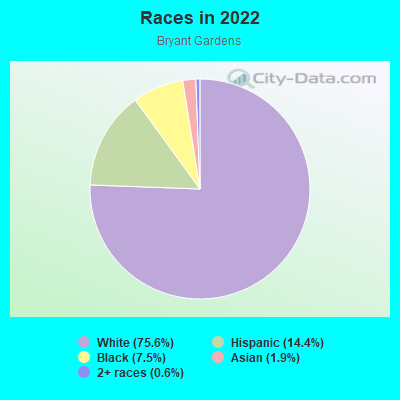
- 12175.6%White
- 2314.4%Hispanic or Latino
- 127.5%Black
- 31.9%Asian
- 10.6%Two or more races
Median household income in 2022:
| Bryant Gardens: | $101,581 |
| White Plains: | $109,551 |
Distribution of median household income
![Distribution of median household income]()
- 2Less than $10,000
- 5$10,000 to $19,999
- 11$20,000 to $29,999
- 3$30,000 to $39,999
- 2$40,000 to $49,999
- 4$50,000 to $59,999
- 3$60,000 to $74,999
- 8$75,000 to $99,999
- 10$100,000 to $124,999
- 6$125,000 to $149,999
- 9$150,000 to $199,999
- 17$200,000 or more

Distribution of owner-occupied house/condo value
![Distribution of owner-occupied house/condo value]()
- 1Less than $50,000
- 5$50,000 to $99,999
- 13$150,000 to $199,999
- 2$200,000 to $249,999
- 4$250,000 to $299,999
- 1$300,000 to $399,999
- 2$400,000 to $499,999
- 5$500,000 to $749,999
- 15$750,000 to $999,999
- 21$1,000,000 or more

Distribution of rent paid by renters
![Distribution of rent paid by renters]()
- 2$500 to $599
- 2$800 to $899
- 1$1,000 to $1,249
- 7$1,250 to $1,499
- 3$2,000 or more

Median rent in 2022:
| Bryant Gardens: | $1,366 |
| White Plains: | $1,882 |
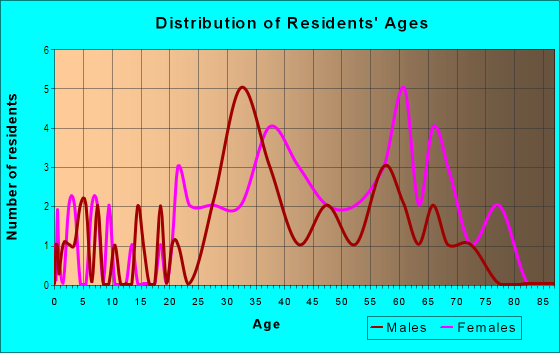
| Males: | 75 |
| Females: | 85 |
Males:
| This neighborhood: | 46.5 years |
| Whole city: | 39.3 years |
| This neighborhood: | 55.4 years |
| Whole city: | 43.5 years |
Average household size:
| Bryant Gardens: | 2.0 people |
| White Plains: | 2.4 people |
Percentage of family households:
| Bryant Gardens: | 28.2% |
| White Plains: | 39.3% |
| Here: | 40.6% |
| White Plains: | 45.6% |
Percentage of married-couple families with children (among all households):
| Bryant Gardens: | 45.2% |
| White Plains: | 30.7% |
Percentage of single-mother households (among all households):
| Bryant Gardens: | 1.3% |
| White Plains: | 7.0% |
Percentage of never married males 15 years old and over:
Percentage of never married females 15 years old and over:
| Bryant Gardens: | 16.7% |
| White Plains: | 17.7% |
Percentage of never married females 15 years old and over:
| Bryant Gardens: | 22.3% |
| city: | 19.7% |
Percentage of people that speak English not well or not at all:
| Bryant Gardens: | 0.0% |
| White Plains: | 8.0% |
Percentage of people born in this state:
Percentage of people born in another U.S. state:
Percentage of native residents but born outside the U.S.:
Percentage of foreign born residents:
| Here: | 65.8% |
| White Plains: | 55.2% |
Percentage of people born in another U.S. state:
| Bryant Gardens: | 14.3% |
| White Plains: | 11.7% |
Percentage of native residents but born outside the U.S.:
| Here: | 2.7% |
| city: | 2.3% |
Percentage of foreign born residents:
| Here: | 17.1% |
| White Plains: | 30.9% |
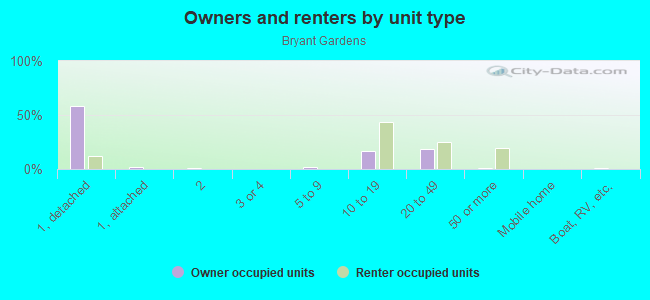
Owner-occupied
Renter-occupied

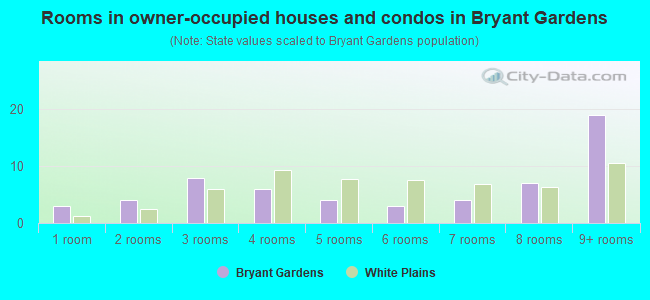
- Rooms in owner-occupied houses and condos in Bryant Gardens
- 31 room
- 42 rooms
- 83 rooms
- 64 rooms
- 45 rooms
- 36 rooms
- 47 rooms
- 78 rooms
- 199+ rooms
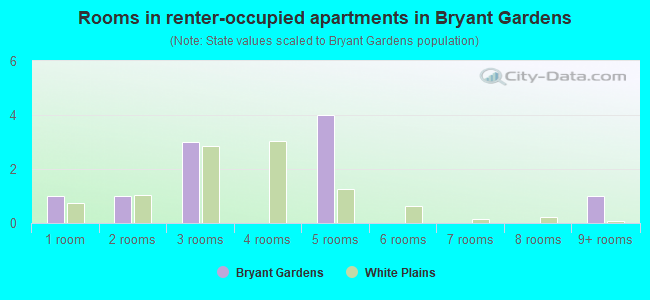
- Rooms in renter-occupied apartments in Bryant Gardens
- 11 room
- 12 rooms
- 33 rooms
- 04 rooms
- 45 rooms
- 06 rooms
- 07 rooms
- 08 rooms
- 19+ rooms
Owner-occupied
Renter-occupied
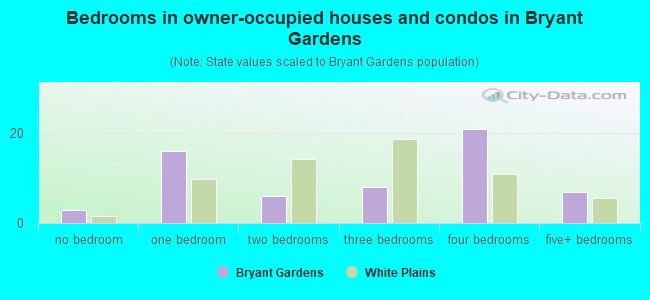
- Bedrooms in owner-occupied houses and condos in Bryant Gardens
- 3no bedroom
- 161 bedroom
- 62 bedrooms
- 83 bedrooms
- 214 bedrooms
- 75+ bedrooms
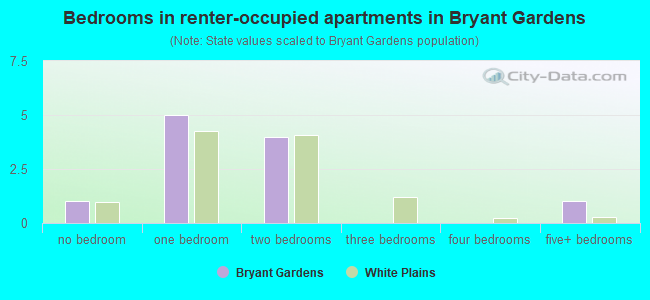
- Bedrooms in renter-occupied apartments in Bryant Gardens
- 1no bedroom
- 51 bedroom
- 42 bedrooms
- 03 bedrooms
- 04 bedrooms
- 15+ bedrooms
Average number of cars or other vehicles available in houses/condos:
Average number of cars or other vehicles available in apartments:
| This neighborhood: | 1.6 |
| White Plains: | 1.8 |
Average number of cars or other vehicles available in apartments:
| Here: | 0.8 |
| city: | 1.1 |
Percentage of units with a mortgage:
| Bryant Gardens: | 63.3% |
| White Plains: | 58.0% |
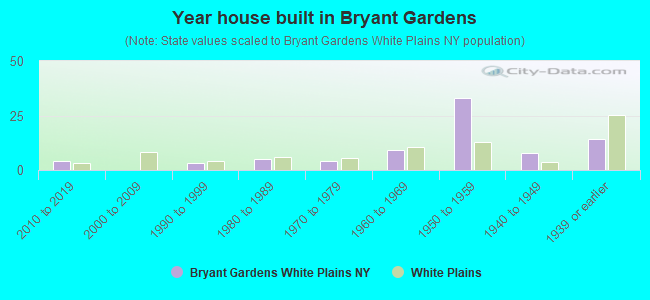
- Year house built in Bryant Gardens
- 02020 or later
- 42010 to 2019
- 02000 to 2009
- 31990 to 1999
- 51980 to 1989
- 41970 to 1979
- 91960 to 1969
- 331950 to 1959
- 81940 to 1949
- 141939 or earlier
City-data.com crime index for city in 2020 (higher means more crime):
| City: | 109.1 |
| U.S. average: | 219.5 |
Travel time to work (commute)
![Travel time to work (commute)]()
- 45 to 9 minutes
- 710 to 14 minutes
- 815 to 19 minutes
- 520 to 24 minutes
- 225 to 29 minutes
- 930 to 34 minutes
- 745 to 59 minutes
- 460 to 89 minutes

Means of transportation to work
![Means of transportation to work]()
- 50.5%34Drove a car alone
- 5.9%4Carpooled
- 11.9%8Long-distance train or commuter rail
- 4.5%3Bicycle
- 1.5%1Walked
- 20.8%14Worked at home

Time leaving home to go to work
![Time leaving home to go to work]()
- 212:00 a.m. to 4:59 a.m.
- 15:30 a.m. to 5:59 a.m.
- 36:00 a.m. to 6:29 a.m.
- 77:00 a.m. to 7:29 a.m.
- 87:30 a.m. to 7:59 a.m.
- 68:00 a.m. to 8:29 a.m.
- 78:30 a.m. to 8:59 a.m.
- 99:00 a.m. to 9:59 a.m.
- 212:00 p.m. to 3:59 p.m.
- 14:00 p.m. to 11:59 p.m.

Occupations of males:
- Percentage of males in management occupations (except farmers):
Here: 27.4% city: 13.4%
- Percentage of males in business and financial operations occupations:
Here: 6.1% city: 9.8%
- Percentage of males in architecture and engineering occupations:
Here: 5.5% city: 2.5%
- Percentage of males in legal occupations:
Here: 15.2% city: 4.8%
- Percentage of males in education, training, and library occupations:
Here: 2.3% city: 4.6%
- Percentage of males in arts, design, entertainment, sports, and media occupations:
Here: 1.3% city: 1.7%
- Percentage of males in healthcare practitioners and technical occupations:
Here: 4.6% city: 3.9%
- Percentage of males in service occupations:
Here: 8.6% city: 15.5%
- Percentage of males in sales and office occupations:
Here: 24.8% city: 14.1%
- Percentage of males in farming, fishing, and forestry occupations:
Here: 1.3% city: 0.1%
- Percentage of males in transportation occupations:
Here: 1.5% city: 3.9%
Occupations of females:
- Percentage of females in management occupations (except farmers):
Here: 17.5% city: 9.8%
- Percentage of females in business and financial operations occupations:
Here: 17.3% city: 8.3%
- Percentage of females in life, physical, and social science occupations:
Here: 1.3% city: 1.5%
- Percentage of females in community and social services occupations:
Here: 11.0% city: 3.0%
- Percentage of females in legal occupations:
Here: 1.7% city: 4.4%
- Percentage of females in education, training, and library occupations:
Here: 8.5% city: 12.2%
- Percentage of females in arts, design, entertainment, sports, and media occupations:
Here: 2.9% city: 2.9%
- Percentage of females in healthcare practitioners and technical occupations:
Here: 9.8% city: 11.2%
- Percentage of females in service occupations:
Here: 5.4% city: 22.1%
- Percentage of females in sales and office occupations:
Here: 24.6% city: 20.9%
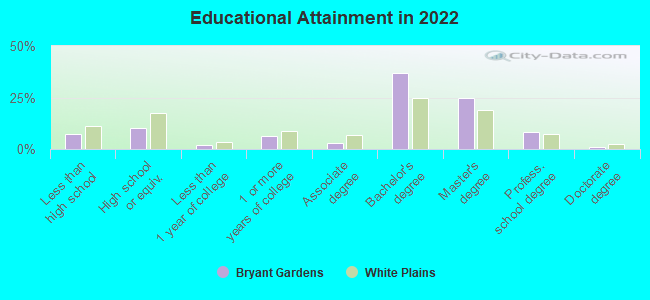
Education in this neighborhood (subdivision or community):
- Percentage of people 3 years and older in K-12 schools:
Bryant Gardens: 15.1% White Plains: 13.2%
- Percentage of people 3 years and older in undergraduate colleges:
Bryant Gardens: 1.3% White Plains: 5.0%
- Percentage of people 3 years and older in grad. or professional schools:
Bryant Gardens: 1.3% White Plains: 1.8%
- Percentage of students K-12 enrolled in private schools:
Bryant Gardens: 20.8% White Plains: 19.8%
Percentage of population below poverty level:
| Bryant Gardens: | 13.3% |
| White Plains: | 10.0% |
Median year owner moved in (as recorded in 2022):
Median year renter moved in (as recorded in 2022):
| Bryant Gardens: | 2003 |
| White Plains: | 2006 |
Median year renter moved in (as recorded in 2022):
| Bryant Gardens: | 2012 |
| White Plains: | 2015 |
Percentage of married-couple families with both working:
| Bryant Gardens: | 84.0% |
| White Plains: | 77.5% |
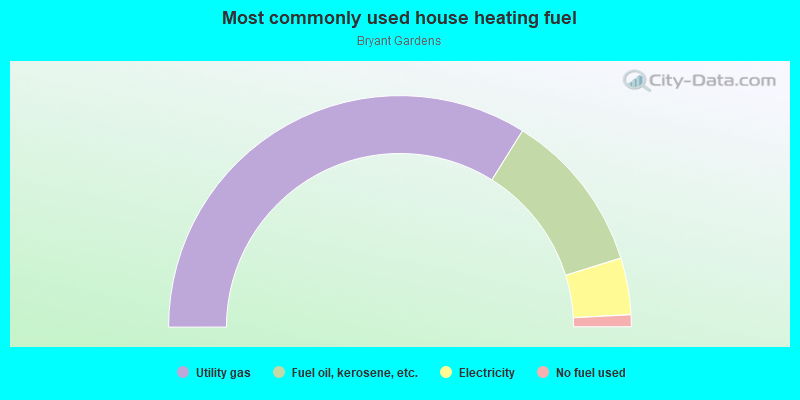
- 67.8%Utility gas
- 22.6%Fuel oil, kerosene, etc.
- 7.9%Electricity
- 1.7%No fuel used
Roads and streets:
Mammoroneck Ave Exn
Length: 0.00 miles
Direction: E-W
Direction: E-W