Burbank Gardens neighborhood in Santa Rosa, California (CA), 95404 detailed profile
Settings
X


Business Search - 14 Million verified businesses
Area: 0.136 square miles
Population: 991
Population density:
| Burbank Gardens: | 7,286 people per square mile |
| Santa Rosa: | 4,416 people per square mile |

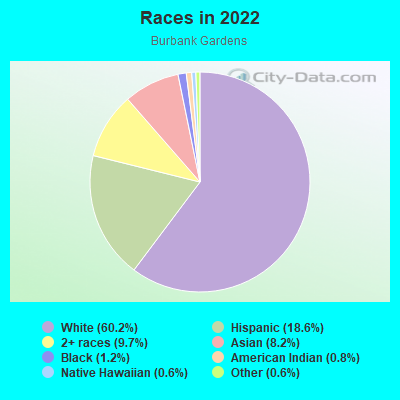
- 69860.2%White
- 21618.6%Hispanic or Latino
- 1139.7%Two or more races
- 958.2%Asian
- 141.2%Black
- 90.8%American Indian
- 70.6%Native Hawaiian and Other
Pacific Islander - 70.6%Some other race

Median household income in 2022:
| Burbank Gardens: | $65,750 |
| Santa Rosa: | $95,403 |
Distribution of median household income
![Distribution of median household income]()
- 45Less than $10,000
- 59$10,000 to $19,999
- 52$20,000 to $29,999
- 100$30,000 to $39,999
- 63$40,000 to $49,999
- 35$50,000 to $59,999
- 26$60,000 to $74,999
- 59$75,000 to $99,999
- 36$100,000 to $124,999
- 44$125,000 to $149,999
- 34$150,000 to $199,999
- 24$200,000 or more

Distribution of owner-occupied house/condo value
![Distribution of owner-occupied house/condo value]()
- 17Less than $50,000
- 23$50,000 to $99,999
- 7$250,000 to $299,999
- 14$300,000 to $399,999
- 67$400,000 to $499,999
- 89$500,000 to $749,999
- 17$750,000 to $999,999
- 41$1,000,000 or more

Distribution of rent paid by renters
![Distribution of rent paid by renters]()
- 27$200 to $299
- 74$300 to $399
- 29$400 to $499
- 21$700 to $799
- 2$800 to $899
- 9$900 to $999
- 20$1,000 to $1,249
- 85$1,250 to $1,499
- 65$1,500 to $1,999
- 132$2,000 or more

Median rent in 2022:
| Burbank Gardens: | $1,630 |
| Santa Rosa: | $1,701 |
| Males: | 494 |
| Females: | 496 |
Males:
| This neighborhood: | 39.2 years |
| Whole city: | 39.4 years |
| This neighborhood: | 38.1 years |
| Whole city: | 42.1 years |
Average household size:
| Burbank Gardens: | 2.0 people |
| Santa Rosa: | 2.5 people |
Percentage of family households:
| Burbank Gardens: | 33.9% |
| Santa Rosa: | 42.7% |
| Here: | 27.6% |
| Santa Rosa: | 46.6% |
Percentage of married-couple families with children (among all households):
| Burbank Gardens: | 16.8% |
| Santa Rosa: | 26.3% |
Percentage of single-mother households (among all households):
| Burbank Gardens: | 32.4% |
| Santa Rosa: | 7.8% |
Percentage of never married males 15 years old and over:
Percentage of never married females 15 years old and over:
| Burbank Gardens: | 23.3% |
| Santa Rosa: | 18.1% |
Percentage of never married females 15 years old and over:
| Burbank Gardens: | 14.1% |
| city: | 16.3% |
Percentage of people that speak English not well or not at all:
| Burbank Gardens: | 1.9% |
| Santa Rosa: | 7.9% |
Percentage of people born in this state:
Percentage of people born in another U.S. state:
Percentage of native residents but born outside the U.S.:
Percentage of foreign born residents:
| Here: | 67.9% |
| Santa Rosa: | 61.5% |
Percentage of people born in another U.S. state:
| Burbank Gardens: | 25.1% |
| Santa Rosa: | 17.6% |
Percentage of native residents but born outside the U.S.:
| Here: | 0.7% |
| city: | 0.7% |
Percentage of foreign born residents:
| Here: | 6.3% |
| Santa Rosa: | 20.3% |
Owner-occupied
Renter-occupied

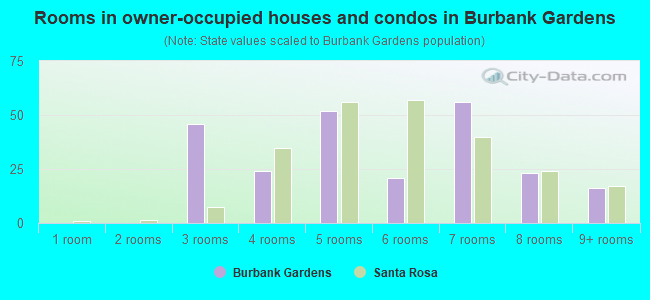
- Rooms in owner-occupied houses and condos in Burbank Gardens
- 01 room
- 02 rooms
- 463 rooms
- 244 rooms
- 525 rooms
- 216 rooms
- 567 rooms
- 238 rooms
- 169+ rooms
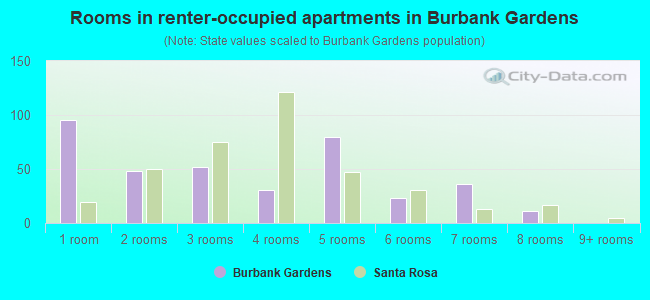
- Rooms in renter-occupied apartments in Burbank Gardens
- 951 room
- 482 rooms
- 523 rooms
- 314 rooms
- 805 rooms
- 236 rooms
- 367 rooms
- 118 rooms
- 09+ rooms
Owner-occupied
Renter-occupied
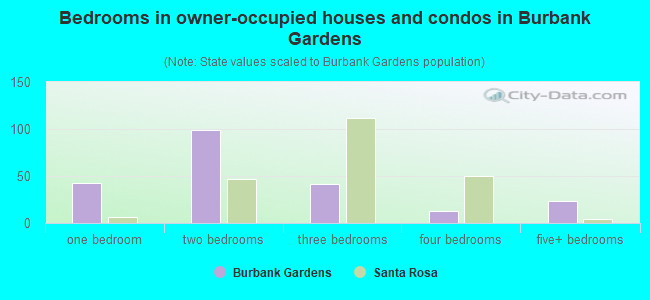
- Bedrooms in owner-occupied houses and condos in Burbank Gardens
- 0no bedroom
- 431 bedroom
- 992 bedrooms
- 413 bedrooms
- 134 bedrooms
- 235+ bedrooms
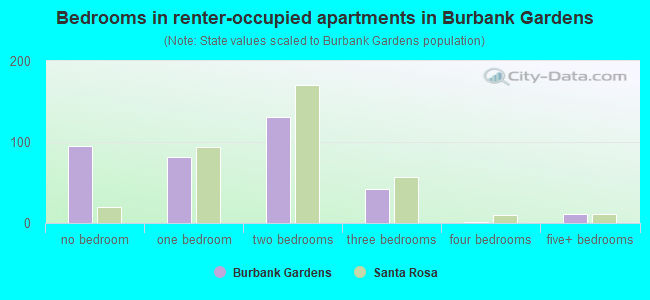
- Bedrooms in renter-occupied apartments in Burbank Gardens
- 95no bedroom
- 821 bedroom
- 1312 bedrooms
- 423 bedrooms
- 14 bedrooms
- 115+ bedrooms
Average number of cars or other vehicles available in houses/condos:
Average number of cars or other vehicles available in apartments:
| This neighborhood: | 2.1 |
| Santa Rosa: | 2.1 |
Average number of cars or other vehicles available in apartments:
| Here: | 1.3 |
| city: | 1.7 |
Percentage of units with a mortgage:
| Burbank Gardens: | 78.8% |
| Santa Rosa: | 64.0% |
Average estimated value of detached houses in 2022 (76.5% of all units):
| Burbank Gardens: | $578,072 |
| Santa Rosa: | $764,936 |
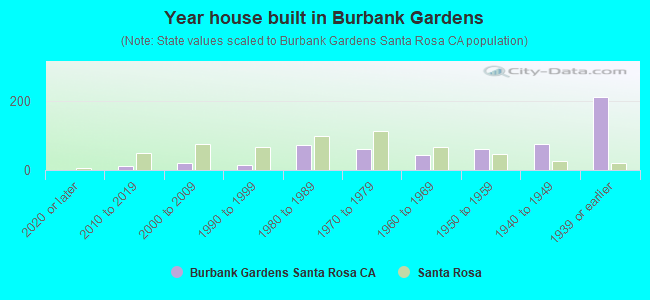
- Year house built in Burbank Gardens
- 02020 or later
- 132010 to 2019
- 202000 to 2009
- 141990 to 1999
- 731980 to 1989
- 611970 to 1979
- 431960 to 1969
- 621950 to 1959
- 751940 to 1949
- 2121939 or earlier
City-data.com crime index for city in 2020 (higher means more crime):
| City: | 235.1 |
| U.S. average: | 219.5 |
Travel time to work (commute)
![Travel time to work (commute)]()
- 13Less than 5 minutes
- 715 to 9 minutes
- 10310 to 14 minutes
- 10915 to 19 minutes
- 6520 to 24 minutes
- 1425 to 29 minutes
- 5030 to 34 minutes
- 735 to 39 minutes
- 1640 to 44 minutes
- 3045 to 59 minutes
- 960 to 89 minutes
- 390 or more minutes

Means of transportation to work
![Means of transportation to work]()
- 75.5%372Drove a car alone
- 12.6%62Carpooled
- 1.4%7Bus
- 0.6%3Long-distance train or commuter rail
- 1.0%5Light rail, streetcar or trolley
- 0.4%2Motorcycle
- 3.0%15Bicycle
- 12.0%59Walked
- 9.1%45Worked at home

Time leaving home to go to work
![Time leaving home to go to work]()
- 312:00 a.m. to 4:59 a.m.
- 165:00 a.m. to 5:29 a.m.
- 315:30 a.m. to 5:59 a.m.
- 136:00 a.m. to 6:29 a.m.
- 256:30 a.m. to 6:59 a.m.
- 677:00 a.m. to 7:29 a.m.
- 607:30 a.m. to 7:59 a.m.
- 948:00 a.m. to 8:29 a.m.
- 438:30 a.m. to 8:59 a.m.
- 329:00 a.m. to 9:59 a.m.
- 3710:00 a.m. to 10:59 a.m.
- 811:00 a.m. to 11:59 a.m.
- 2112:00 p.m. to 3:59 p.m.
- 254:00 p.m. to 11:59 p.m.

Occupations of males:
- Percentage of males in management occupations (except farmers):
Here: 17.6% city: 11.1%
- Percentage of males in computer and mathematical occupations:
Here: 3.7% city: 3.1%
- Percentage of males in architecture and engineering occupations:
Here: 6.2% city: 4.1%
- Percentage of males in arts, design, entertainment, sports, and media occupations:
Here: 7.7% city: 2.2%
- Percentage of males in healthcare practitioners and technical occupations:
Here: 4.2% city: 3.8%
- Percentage of males in service occupations:
Here: 21.5% city: 16.2%
- Percentage of males in sales and office occupations:
Here: 17.9% city: 15.3%
- Percentage of males in farming, fishing, and forestry occupations:
Here: 3.4% city: 1.9%
- Percentage of males in construction, extraction, and maintenance occupations:
Here: 6.7% city: 12.2%
- Percentage of males in transportation occupations:
Here: 2.3% city: 3.9%
- Percentage of males in material moving occupations:
Here: 4.0% city: 4.1%
Occupations of females:
- Percentage of females in management occupations (except farmers):
Here: 10.3% city: 11.3%
- Percentage of females in business and financial operations occupations:
Here: 19.3% city: 5.9%
- Percentage of females in life, physical, and social science occupations:
Here: 1.1% city: 1.2%
- Percentage of females in education, training, and library occupations:
Here: 3.5% city: 7.1%
- Percentage of females in arts, design, entertainment, sports, and media occupations:
Here: 6.3% city: 2.4%
- Percentage of females in healthcare practitioners and technical occupations:
Here: 3.7% city: 8.5%
- Percentage of females in service occupations:
Here: 28.3% city: 23.0%
- Percentage of females in sales and office occupations:
Here: 25.9% city: 25.9%
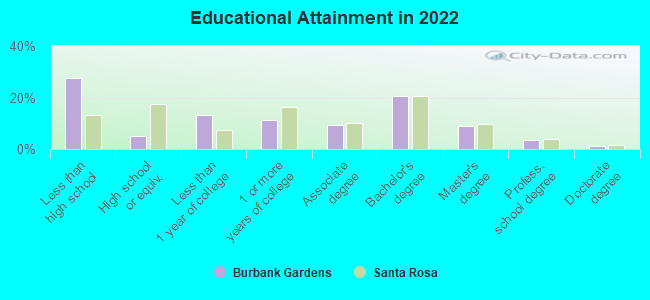
Education in this neighborhood (subdivision or community):
- Percentage of people 3 years and older in K-12 schools:
Burbank Gardens: 21.6% Santa Rosa: 15.4%
- Percentage of people 3 years and older in undergraduate colleges:
Burbank Gardens: 5.1% Santa Rosa: 5.1%
- Percentage of people 3 years and older in grad. or professional schools:
Burbank Gardens: 5.5% Santa Rosa: 1.4%
- Percentage of students K-12 enrolled in private schools:
Burbank Gardens: 12.3% Santa Rosa: 7.1%
Percentage of population below poverty level:
| Burbank Gardens: | 10.3% |
| Santa Rosa: | 9.5% |
Median year owner moved in (as recorded in 2022):
Median year renter moved in (as recorded in 2022):
| Burbank Gardens: | 2007 |
| Santa Rosa: | 2011 |
Median year renter moved in (as recorded in 2022):
| Burbank Gardens: | 2017 |
| Santa Rosa: | 2019 |
Percentage of married-couple families with both working:
| Burbank Gardens: | 89.1% |
| Santa Rosa: | 73.4% |
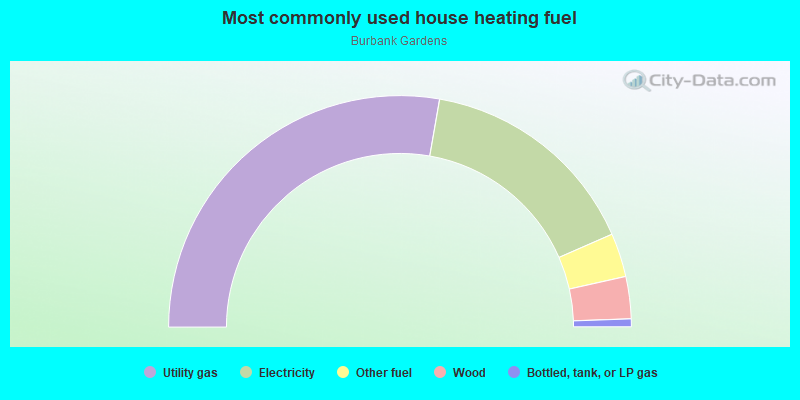
- 55.5%Utility gas
- 31.4%Electricity
- 6.1%Other fuel
- 5.9%Wood
- 1.1%Bottled, tank, or LP gas
Roads and streets:
Hendley St
Length: 0.40 miles
Direction: SE-NW
Address range: 1 to 699
Direction: SE-NW
Address range: 1 to 699
Brown St
Length: 0.39 miles
Direction: N-S
Address range: 88 to 799
Direction: N-S
Address range: 88 to 799
Oak St
Length: 0.38 miles
Direction: E-W
Address range: 600 to 799
Direction: E-W
Address range: 600 to 799
Pine St
Length: 0.36 miles
Direction: E-W
Address range: 600 to 799
Direction: E-W
Address range: 600 to 799
Mill St
Length: 0.34 miles
Direction: E-W
Address range: 600 to 799
Direction: E-W
Address range: 600 to 799
Wheeler St
Length: 0.32 miles
Direction: E-W
Address range: 600 to 799
Direction: E-W
Address range: 600 to 799
Santa Rosa Ave
Length: 0.31 miles
Direction: N-S
Address range: 200 to 699
Direction: N-S
Address range: 200 to 699
Charles St
Length: 0.30 miles
Direction: E-W
Address range: 600 to 799
Direction: E-W
Address range: 600 to 799
Tupper St
Length: 0.24 miles
Direction: E-W
Address range: 600 to 799
Direction: E-W
Address range: 600 to 799
Sonoma Ave
Length: 0.11 miles
Directions: E-W, SW-NE
Directions: E-W, SW-NE
Rae St
Length: 0.09 miles
Direction: E-W
Direction: E-W
Other features:
Matanzas Crk
Length: 0.09 miles
Directions: E-W, N-S, SW-NE
Directions: E-W, N-S, SW-NE
Santa Rosa Crk
Length: 0.06 miles
Directions: E-W, SW-NE
Directions: E-W, SW-NE