Burlingame neighborhood in San Diego, California (CA), 92104 detailed profile
Settings
X


Business Search - 14 Million verified businesses
Area: 0.103 square miles
Population: 2,381
Population density:
| Burlingame: | 23,177 people per square mile |
| San Diego: | 4,258 people per square mile |

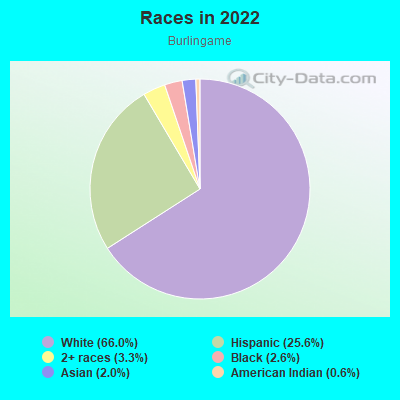
- 1,57366.0%White
- 61025.6%Hispanic or Latino
- 793.3%Two or more races
- 622.6%Black
- 472.0%Asian
- 140.6%American Indian
Median household income in 2022:
| Burlingame: | $90,446 |
| San Diego: | $100,010 |
Distribution of median household income
![Distribution of median household income]()
- 118Less than $10,000
- 24$10,000 to $19,999
- 96$20,000 to $29,999
- 47$30,000 to $39,999
- 47$40,000 to $49,999
- 129$50,000 to $59,999
- 36$60,000 to $74,999
- 241$75,000 to $99,999
- 80$100,000 to $124,999
- 85$125,000 to $149,999
- 136$150,000 to $199,999
- 141$200,000 or more

Distribution of owner-occupied house/condo value
![Distribution of owner-occupied house/condo value]()
- 8$250,000 to $299,999
- 6$300,000 to $399,999
- 13$400,000 to $499,999
- 43$500,000 to $749,999
- 125$750,000 to $999,999
- 221$1,000,000 or more

Distribution of rent paid by renters
![Distribution of rent paid by renters]()
- 41$100 to $199
- 15$200 to $299
- 17$500 to $599
- 19$600 to $699
- 22$700 to $799
- 23$1,000 to $1,249
- 64$1,250 to $1,499
- 297$1,500 to $1,999
- 222$2,000 or more

Median rent in 2022:
| Burlingame: | $1,801 |
| San Diego: | $1,971 |
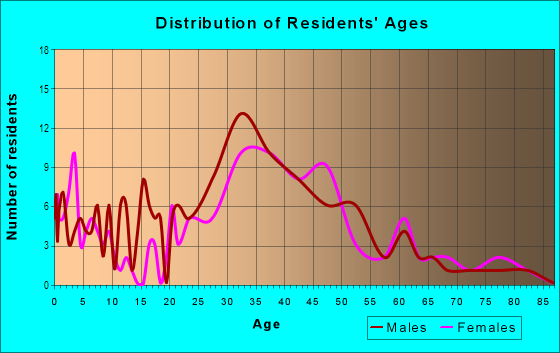
| Males: | 1,187 |
| Females: | 1,193 |
Males:
| This neighborhood: | 35.7 years |
| Whole city: | 35.4 years |
| This neighborhood: | 33.2 years |
| Whole city: | 37.2 years |
Average household size:
| Burlingame: | 2.3 people |
| San Diego: | 2.5 people |
Percentage of family households:
| Burlingame: | 34.1% |
| San Diego: | 41.7% |
| Here: | 31.4% |
| San Diego: | 43.2% |
Percentage of married-couple families with children (among all households):
| Burlingame: | 30.6% |
| San Diego: | 27.8% |
Percentage of single-mother households (among all households):
| Burlingame: | 24.0% |
| San Diego: | 7.9% |
Percentage of never married males 15 years old and over:
Percentage of never married females 15 years old and over:
| Burlingame: | 26.9% |
| San Diego: | 23.4% |
Percentage of never married females 15 years old and over:
| Burlingame: | 27.9% |
| city: | 18.8% |
Percentage of people that speak English not well or not at all:
| Burlingame: | 1.1% |
| San Diego: | 5.9% |
Percentage of people born in this state:
Percentage of people born in another U.S. state:
Percentage of native residents but born outside the U.S.:
Percentage of foreign born residents:
| Here: | 48.7% |
| San Diego: | 48.1% |
Percentage of people born in another U.S. state:
| Burlingame: | 43.5% |
| San Diego: | 24.9% |
Percentage of native residents but born outside the U.S.:
| Here: | 1.7% |
| city: | 2.4% |
Percentage of foreign born residents:
| Here: | 6.1% |
| San Diego: | 24.6% |
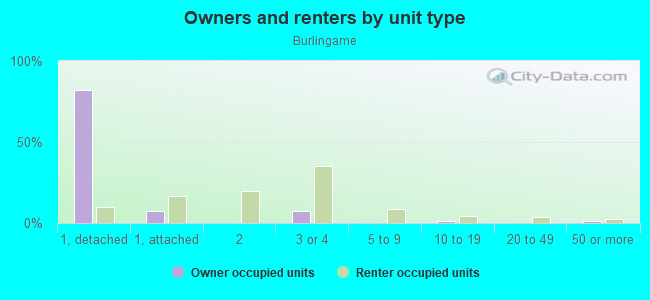
Owner-occupied
Renter-occupied

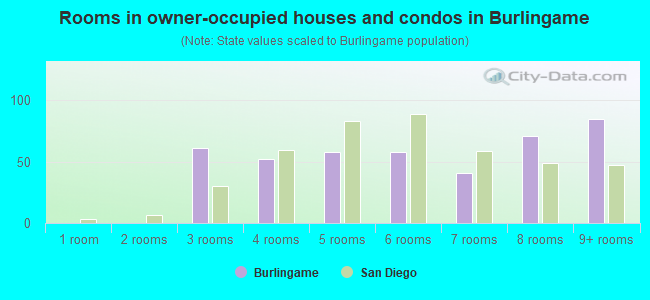
- Rooms in owner-occupied houses and condos in Burlingame
- 01 room
- 02 rooms
- 613 rooms
- 524 rooms
- 585 rooms
- 586 rooms
- 417 rooms
- 718 rooms
- 859+ rooms
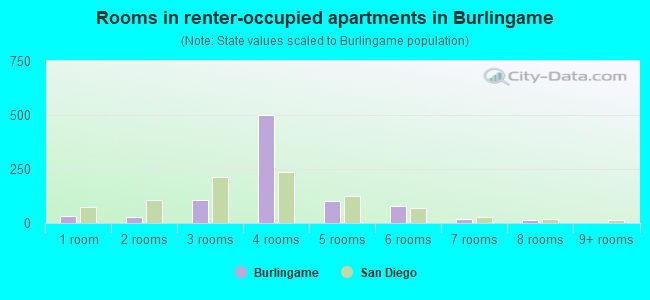
- Rooms in renter-occupied apartments in Burlingame
- 311 room
- 302 rooms
- 1073 rooms
- 5004 rooms
- 1015 rooms
- 776 rooms
- 207 rooms
- 168 rooms
- 09+ rooms
Owner-occupied
Renter-occupied
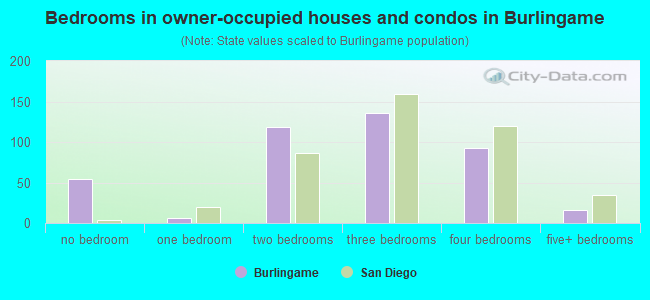
- Bedrooms in owner-occupied houses and condos in Burlingame
- 54no bedroom
- 61 bedroom
- 1192 bedrooms
- 1363 bedrooms
- 934 bedrooms
- 165+ bedrooms
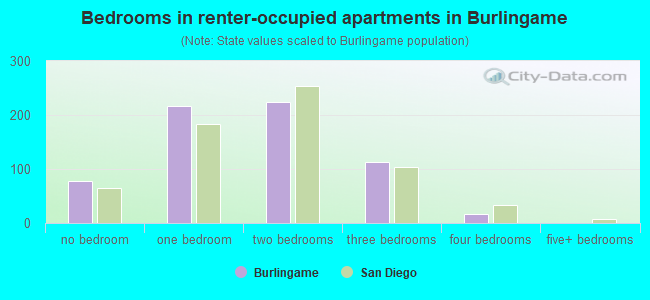
- Bedrooms in renter-occupied apartments in Burlingame
- 77no bedroom
- 2161 bedroom
- 2242 bedrooms
- 1133 bedrooms
- 174 bedrooms
- 05+ bedrooms
Average number of cars or other vehicles available in houses/condos:
Average number of cars or other vehicles available in apartments:
| This neighborhood: | 2.0 |
| San Diego: | 2.1 |
Average number of cars or other vehicles available in apartments:
| Here: | 1.5 |
| city: | 1.6 |
Percentage of units with a mortgage:
| Burlingame: | 76.3% |
| San Diego: | 69.2% |
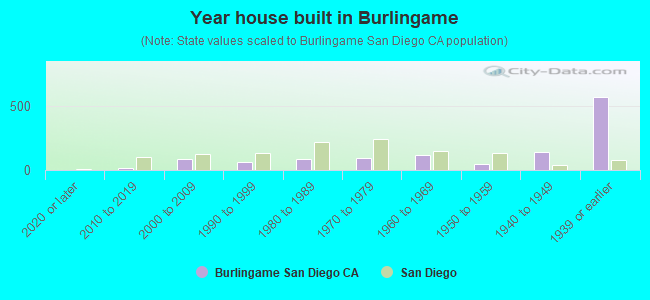
- Year house built in Burlingame
- 02020 or later
- 162010 to 2019
- 842000 to 2009
- 621990 to 1999
- 891980 to 1989
- 931970 to 1979
- 1201960 to 1969
- 431950 to 1959
- 1421940 to 1949
- 5651939 or earlier
City-data.com crime index for city in 2020 (higher means more crime):
| City: | 197.8 |
| U.S. average: | 219.5 |
Travel time to work (commute)
![Travel time to work (commute)]()
- 10Less than 5 minutes
- 935 to 9 minutes
- 30110 to 14 minutes
- 30015 to 19 minutes
- 18020 to 24 minutes
- 4025 to 29 minutes
- 12230 to 34 minutes
- 4135 to 39 minutes
- 3140 to 44 minutes
- 3645 to 59 minutes
- 6860 to 89 minutes

Means of transportation to work
![Means of transportation to work]()
- 70.5%1,025Drove a car alone
- 9.2%133Carpooled
- 4.5%66Bus
- 0.4%6Long-distance train or commuter rail
- 6.3%91Ferryboat
- 1.0%14Motorcycle
- 3.4%49Bicycle
- 3.2%47Walked
- 0.6%8Other means
- 15.4%224Worked at home

Time leaving home to go to work
![Time leaving home to go to work]()
- 11512:00 a.m. to 4:59 a.m.
- 465:00 a.m. to 5:29 a.m.
- 455:30 a.m. to 5:59 a.m.
- 1426:00 a.m. to 6:29 a.m.
- 826:30 a.m. to 6:59 a.m.
- 1057:00 a.m. to 7:29 a.m.
- 1637:30 a.m. to 7:59 a.m.
- 1358:00 a.m. to 8:29 a.m.
- 998:30 a.m. to 8:59 a.m.
- 999:00 a.m. to 9:59 a.m.
- 4810:00 a.m. to 10:59 a.m.
- 1411:00 a.m. to 11:59 a.m.
- 1412:00 p.m. to 3:59 p.m.
- 1144:00 p.m. to 11:59 p.m.

Occupations of males:
- Percentage of males in management occupations (except farmers):
Here: 9.0% city: 12.7%
- Percentage of males in business and financial operations occupations:
Here: 3.7% city: 6.6%
- Percentage of males in architecture and engineering occupations:
Here: 5.1% city: 6.5%
- Percentage of males in life, physical, and social science occupations:
Here: 4.9% city: 2.6%
- Percentage of males in legal occupations:
Here: 2.2% city: 1.7%
- Percentage of males in education, training, and library occupations:
Here: 3.0% city: 3.8%
- Percentage of males in arts, design, entertainment, sports, and media occupations:
Here: 5.7% city: 2.9%
- Percentage of males in healthcare practitioners and technical occupations:
Here: 5.4% city: 3.8%
- Percentage of males in service occupations:
Here: 15.2% city: 14.6%
- Percentage of males in sales and office occupations:
Here: 14.8% city: 13.9%
- Percentage of males in farming, fishing, and forestry occupations:
Here: 1.0% city: 0.2%
- Percentage of males in construction, extraction, and maintenance occupations:
Here: 4.9% city: 5.9%
- Percentage of males in production occupations:
Here: 3.0% city: 4.6%
- Percentage of males in transportation occupations:
Here: 14.0% city: 3.9%
- Percentage of males in material moving occupations:
Here: 1.0% city: 3.3%
Occupations of females:
- Percentage of females in management occupations (except farmers):
Here: 11.6% city: 10.2%
- Percentage of females in business and financial operations occupations:
Here: 4.1% city: 9.0%
- Percentage of females in computer and mathematical occupations:
Here: 2.4% city: 3.3%
- Percentage of females in architecture and engineering occupations:
Here: 4.9% city: 1.7%
- Percentage of females in life, physical, and social science occupations:
Here: 1.3% city: 3.2%
- Percentage of females in community and social services occupations:
Here: 4.0% city: 2.5%
- Percentage of females in legal occupations:
Here: 2.6% city: 1.8%
- Percentage of females in education, training, and library occupations:
Here: 8.2% city: 8.2%
- Percentage of females in arts, design, entertainment, sports, and media occupations:
Here: 1.3% city: 2.9%
- Percentage of females in healthcare practitioners and technical occupations:
Here: 12.0% city: 9.7%
- Percentage of females in service occupations:
Here: 26.2% city: 19.9%
- Percentage of females in sales and office occupations:
Here: 20.7% city: 22.0%
Percentage of people 16-64 in Armed Forces:
| Burlingame: | 2.9% |
| San Diego: | 4.0% |
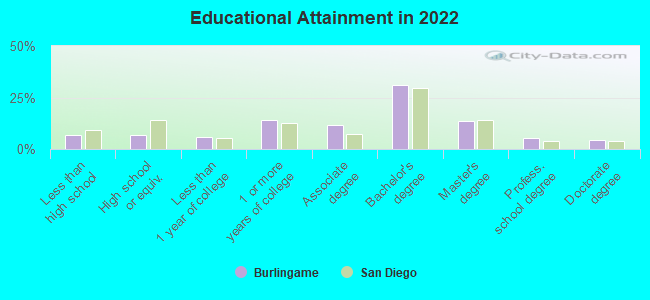
Education in this neighborhood (subdivision or community):
- Percentage of people 3 years and older in K-12 schools:
Burlingame: 14.8% San Diego: 13.8%
- Percentage of people 3 years and older in undergraduate colleges:
Burlingame: 7.9% San Diego: 8.5%
- Percentage of people 3 years and older in grad. or professional schools:
Burlingame: 2.5% San Diego: 2.3%
- Percentage of students K-12 enrolled in private schools:
Burlingame: 19.2% San Diego: 13.6%
Percentage of population below poverty level:
| Burlingame: | 9.4% |
| San Diego: | 11.3% |
Median year owner moved in (as recorded in 2022):
Median year renter moved in (as recorded in 2022):
| Burlingame: | 2004 |
| San Diego: | 2010 |
Median year renter moved in (as recorded in 2022):
| Burlingame: | 2016 |
| San Diego: | 2020 |
Percentage of married-couple families with both working:
| Burlingame: | 103.3% |
| San Diego: | 66.0% |
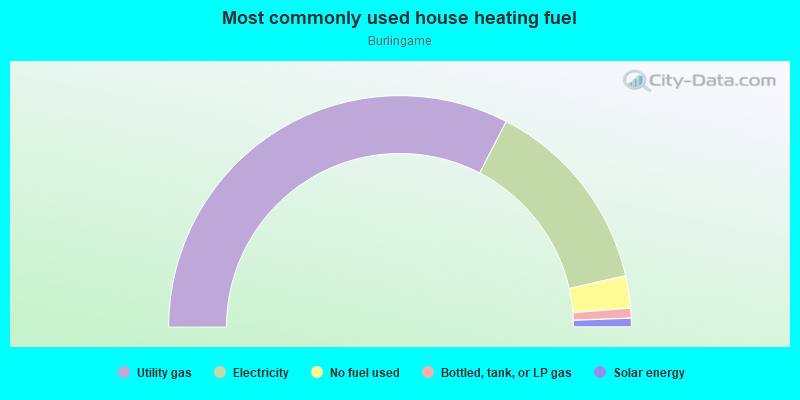
- 65.2%Utility gas
- 27.7%Electricity
- 4.5%No fuel used
- 1.4%Bottled, tank, or LP gas
- 1.2%Solar energy
Roads and streets:
San Marcos Ave
Length: 0.41 miles
Directions: E-W, N-S, SE-NW, SW-NE
Address range: 2400 to 2699
Directions: E-W, N-S, SE-NW, SW-NE
Address range: 2400 to 2699
32nd St
Length: 0.32 miles
Direction: N-S
Address range: 2300 to 2799
Direction: N-S
Address range: 2300 to 2799
Olive St
Length: 0.25 miles
Direction: E-W
Address range: 3015 to 3199
Direction: E-W
Address range: 3015 to 3199
Nutmeg St
Length: 0.24 miles
Direction: E-W
Address range: 3100 to 3199
Direction: E-W
Address range: 3100 to 3199
Laurel St
Length: 0.24 miles
Directions: E-W, SW-NE
Address range: 3028 to 3199
Directions: E-W, SW-NE
Address range: 3028 to 3199
Kalmia St
Length: 0.23 miles
Direction: E-W
Address range: 3033 to 3199
Direction: E-W
Address range: 3033 to 3199
Maple St
Length: 0.19 miles
Directions: E-W, SW-NE
Address range: 3100 to 3199
Directions: E-W, SW-NE
Address range: 3100 to 3199
31st St
Length: 0.15 miles
Directions: N-S, SE-NW
Address range: 2300 to 2399
Directions: N-S, SE-NW
Address range: 2300 to 2399
Juniper St
Length: 0.15 miles
Direction: E-W
Address range: 3100 to 3199
Direction: E-W
Address range: 3100 to 3199
Pamo Ave
Length: 0.14 miles
Direction: N-S
Address range: 2400 to 2549
Direction: N-S
Address range: 2400 to 2549
Capitan Ave
Length: 0.12 miles
Directions: N-S, SW-NE
Address range: 2400 to 2499
Directions: N-S, SW-NE
Address range: 2400 to 2499
Dulzura Ave
Length: 0.10 miles
Direction: N-S
Address range: 2400 to 2499
Direction: N-S
Address range: 2400 to 2499
Nutmeg Pl
Length: 0.07 miles
Directions: E-W, N-S, SE-NW
Address range: 2700 to 2751
Directions: E-W, N-S, SE-NW
Address range: 2700 to 2751
Burlingame Dr
Length: 0.05 miles
Directions: N-S, SW-NE
Address range: 3050 to 3099
Directions: N-S, SW-NE
Address range: 3050 to 3099