Burlingame Village neighborhood in Burlingame, California (CA), 94010 detailed profile
Settings
X


Business Search - 14 Million verified businesses
Area: 0.080 square miles
Population: 1,275
Population density:
| Burlingame Village: | 15,988 people per square mile |
| Burlingame: | 7,151 people per square mile |

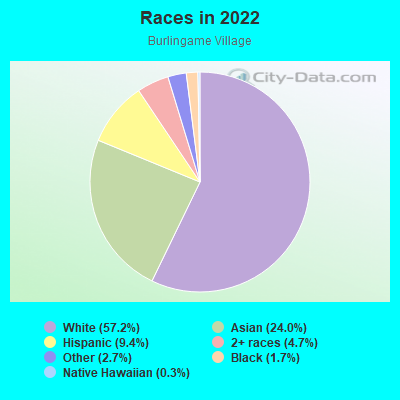
- 73257.2%White
- 30724.0%Asian
- 1209.4%Hispanic or Latino
- 604.7%Two or more races
- 342.7%Some other race
- 221.7%Black
- 40.3%Native Hawaiian and Other
Pacific Islander
Median household income in 2022:
| Burlingame Village: | $132,825 |
| Burlingame: | $165,940 |
Distribution of median household income
![Distribution of median household income]()
- 29Less than $10,000
- 30$10,000 to $19,999
- 17$20,000 to $29,999
- 13$30,000 to $39,999
- 14$40,000 to $49,999
- 5$50,000 to $59,999
- 36$60,000 to $74,999
- 29$75,000 to $99,999
- 31$100,000 to $124,999
- 34$125,000 to $149,999
- 63$150,000 to $199,999
- 182$200,000 or more

Distribution of owner-occupied house/condo value
![Distribution of owner-occupied house/condo value]()
- 9Less than $50,000
- 1$100,000 to $149,999
- 8$300,000 to $399,999
- 5$500,000 to $749,999
- 7$750,000 to $999,999
- 285$1,000,000 or more

Distribution of rent paid by renters
![Distribution of rent paid by renters]()
- 6$100 to $199
- 30$300 to $399
- 17$1,000 to $1,249
- 2$1,250 to $1,499
- 30$1,500 to $1,999
- 98$2,000 or more

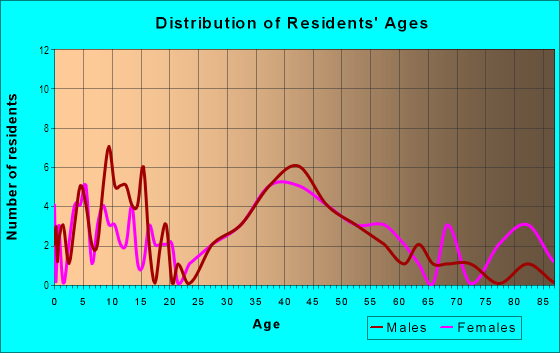
| Males: | 634 |
| Females: | 641 |
Males:
| This neighborhood: | 42.3 years |
| Whole city: | 39.7 years |
| This neighborhood: | 38.3 years |
| Whole city: | 41.7 years |
Average household size:
| Burlingame Village: | 11.7 people |
| Burlingame: | 2.5 people |
Percentage of family households:
| Burlingame Village: | 54.5% |
| Burlingame: | 45.6% |
| Here: | 63.4% |
| Burlingame: | 51.2% |
Percentage of married-couple families with children (among all households):
| Burlingame Village: | 33.4% |
| Burlingame: | 34.1% |
Percentage of single-mother households (among all households):
| Burlingame Village: | 2.0% |
| Burlingame: | 3.6% |
Percentage of never married males 15 years old and over:
Percentage of never married females 15 years old and over:
| Burlingame Village: | 15.0% |
| Burlingame: | 18.3% |
Percentage of never married females 15 years old and over:
| Burlingame Village: | 10.9% |
| city: | 13.4% |
Percentage of people that speak English not well or not at all:
| Burlingame Village: | 1.5% |
| Burlingame: | 4.7% |
Percentage of people born in this state:
Percentage of people born in another U.S. state:
Percentage of native residents but born outside the U.S.:
Percentage of foreign born residents:
| Here: | 52.0% |
| Burlingame: | 52.5% |
Percentage of people born in another U.S. state:
| Burlingame Village: | 13.3% |
| Burlingame: | 16.0% |
Percentage of native residents but born outside the U.S.:
| Here: | 2.3% |
| city: | 1.6% |
Percentage of foreign born residents:
| Here: | 32.4% |
| Burlingame: | 30.0% |
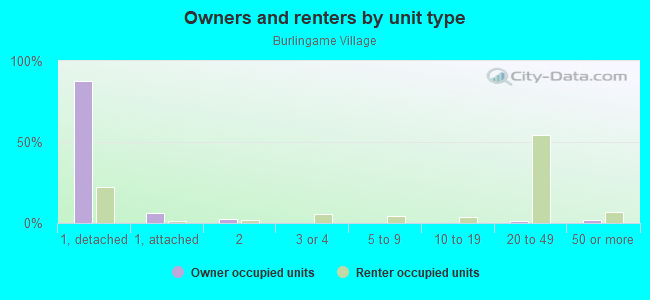
Owner-occupied
Renter-occupied

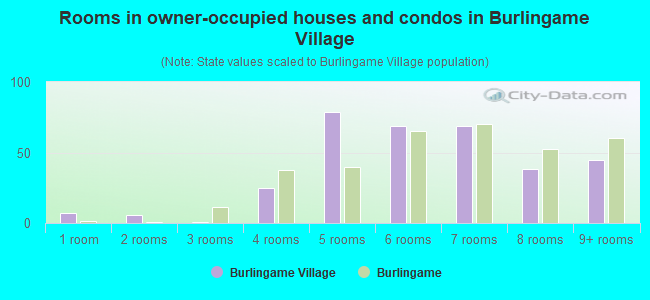
- Rooms in owner-occupied houses and condos in Burlingame Village
- 71 room
- 62 rooms
- 13 rooms
- 254 rooms
- 795 rooms
- 696 rooms
- 697 rooms
- 388 rooms
- 459+ rooms
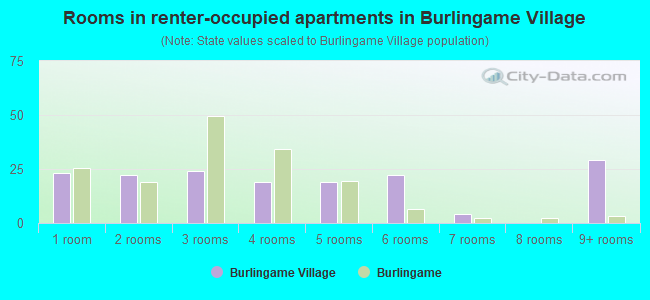
- Rooms in renter-occupied apartments in Burlingame Village
- 231 room
- 222 rooms
- 243 rooms
- 194 rooms
- 195 rooms
- 226 rooms
- 47 rooms
- 08 rooms
- 299+ rooms
Owner-occupied
Renter-occupied
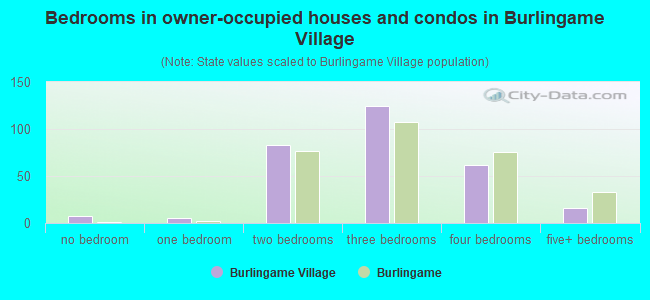
- Bedrooms in owner-occupied houses and condos in Burlingame Village
- 7no bedroom
- 51 bedroom
- 832 bedrooms
- 1243 bedrooms
- 624 bedrooms
- 165+ bedrooms
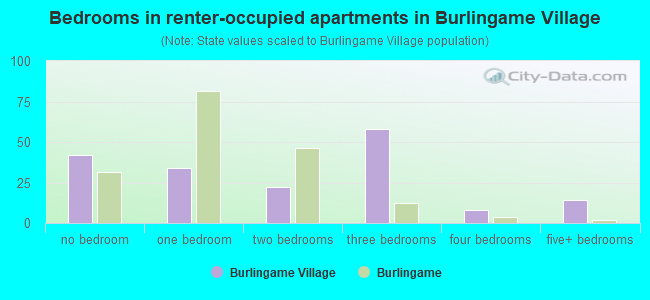
- Bedrooms in renter-occupied apartments in Burlingame Village
- 42no bedroom
- 341 bedroom
- 222 bedrooms
- 583 bedrooms
- 84 bedrooms
- 145+ bedrooms
Average number of cars or other vehicles available in houses/condos:
Average number of cars or other vehicles available in apartments:
| This neighborhood: | 2.2 |
| Burlingame: | 2.2 |
Average number of cars or other vehicles available in apartments:
| Here: | 1.4 |
| city: | 1.4 |
Percentage of units with a mortgage:
| Burlingame Village: | 74.0% |
| Burlingame: | 71.7% |
Housing prices:
- Average estimated value of detached houses in 2022 (72.5% of all units):
Burlingame Village: $2,271,175 California: $988,808
- Average estimated value of townhouses or other attached units in 2022 (3.3% of all units):
This neighborhood: $852,145 California: $838,546
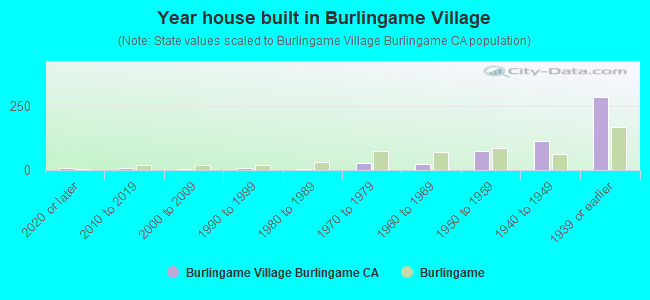
- Year house built in Burlingame Village
- 92020 or later
- 72010 to 2019
- 32000 to 2009
- 71990 to 1999
- 21980 to 1989
- 271970 to 1979
- 251960 to 1969
- 731950 to 1959
- 1141940 to 1949
- 2831939 or earlier
City-data.com crime index for city in 2020 (higher means more crime):
| City: | 236.7 |
| U.S. average: | 219.5 |
Travel time to work (commute)
![Travel time to work (commute)]()
- 1Less than 5 minutes
- 175 to 9 minutes
- 2310 to 14 minutes
- 3215 to 19 minutes
- 3020 to 24 minutes
- 1525 to 29 minutes
- 3330 to 34 minutes
- 635 to 39 minutes
- 740 to 44 minutes
- 3745 to 59 minutes
- 3260 to 89 minutes
- 290 or more minutes

Means of transportation to work
![Means of transportation to work]()
- 58.0%379Drove a car alone
- 4.1%27Carpooled
- 3.2%21Bus
- 11.0%72Subway or elevated rail
- 2.0%13Long-distance train or commuter rail
- 1.4%9Light rail, streetcar or trolley
- 2.9%19Taxi
- 1.1%7Motorcycle
- 0.8%5Walked
- 1.1%7Other means
- 17.1%112Worked at home

Time leaving home to go to work
![Time leaving home to go to work]()
- 612:00 a.m. to 4:59 a.m.
- 115:00 a.m. to 5:29 a.m.
- 65:30 a.m. to 5:59 a.m.
- 246:00 a.m. to 6:29 a.m.
- 206:30 a.m. to 6:59 a.m.
- 177:00 a.m. to 7:29 a.m.
- 267:30 a.m. to 7:59 a.m.
- 228:00 a.m. to 8:29 a.m.
- 278:30 a.m. to 8:59 a.m.
- 329:00 a.m. to 9:59 a.m.
- 1110:00 a.m. to 10:59 a.m.
- 1411:00 a.m. to 11:59 a.m.
- 2012:00 p.m. to 3:59 p.m.
- 54:00 p.m. to 11:59 p.m.

Occupations of males:
- Percentage of males in management occupations (except farmers):
Here: 30.5% city: 21.1%
- Percentage of males in business and financial operations occupations:
Here: 15.9% city: 8.6%
- Percentage of males in computer and mathematical occupations:
Here: 6.4% city: 7.1%
- Percentage of males in architecture and engineering occupations:
Here: 8.5% city: 4.9%
- Percentage of males in life, physical, and social science occupations:
Here: 1.8% city: 3.3%
- Percentage of males in community and social services occupations:
Here: 1.3% city: 1.3%
- Percentage of males in legal occupations:
Here: 2.1% city: 3.3%
- Percentage of males in education, training, and library occupations:
Here: 6.2% city: 3.4%
- Percentage of males in service occupations:
Here: 13.2% city: 12.7%
- Percentage of males in sales and office occupations:
Here: 7.3% city: 12.6%
- Percentage of males in construction, extraction, and maintenance occupations:
Here: 2.2% city: 6.1%
- Percentage of males in production occupations:
Here: 2.4% city: 1.8%
- Percentage of males in transportation occupations:
Here: 2.1% city: 3.9%
Occupations of females:
- Percentage of females in management occupations (except farmers):
Here: 17.5% city: 20.8%
- Percentage of females in business and financial operations occupations:
Here: 4.9% city: 10.1%
- Percentage of females in computer and mathematical occupations:
Here: 4.2% city: 4.3%
- Percentage of females in life, physical, and social science occupations:
Here: 3.2% city: 4.3%
- Percentage of females in community and social services occupations:
Here: 4.3% city: 1.0%
- Percentage of females in legal occupations:
Here: 4.2% city: 3.4%
- Percentage of females in education, training, and library occupations:
Here: 8.0% city: 7.2%
- Percentage of females in arts, design, entertainment, sports, and media occupations:
Here: 2.1% city: 2.1%
- Percentage of females in healthcare practitioners and technical occupations:
Here: 9.2% city: 10.3%
- Percentage of females in service occupations:
Here: 9.3% city: 11.2%
- Percentage of females in sales and office occupations:
Here: 27.5% city: 19.2%
- Percentage of females in production occupations:
Here: 1.7% city: 1.0%
- Percentage of females in transportation occupations:
Here: 1.4% city: 1.8%
- Percentage of females in material moving occupations:
Here: 2.6% city: 0.9%
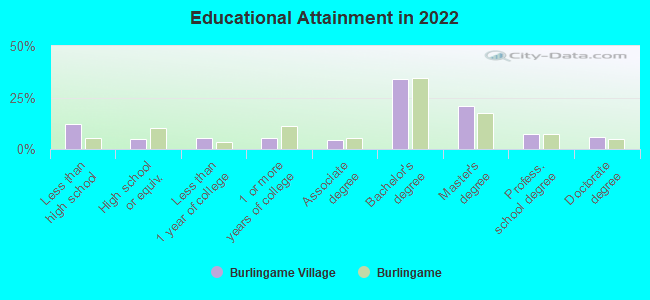
Education in this neighborhood (subdivision or community):
- Percentage of people 3 years and older in K-12 schools:
Burlingame Village: 23.5% Burlingame: 17.3%
- Percentage of people 3 years and older in undergraduate colleges:
Burlingame Village: 2.3% Burlingame: 4.6%
- Percentage of people 3 years and older in grad. or professional schools:
Burlingame Village: 1.4% Burlingame: 1.3%
- Percentage of students K-12 enrolled in private schools:
Burlingame Village: 38.8% Burlingame: 20.4%
Percentage of population below poverty level:
| Burlingame Village: | 4.5% |
| Burlingame: | 5.0% |
Median year owner moved in (as recorded in 2022):
| Burlingame Village: | 2001 |
| Burlingame: | 2002 |
Percentage of married-couple families with both working:
| Burlingame Village: | 83.0% |
| Burlingame: | 75.6% |
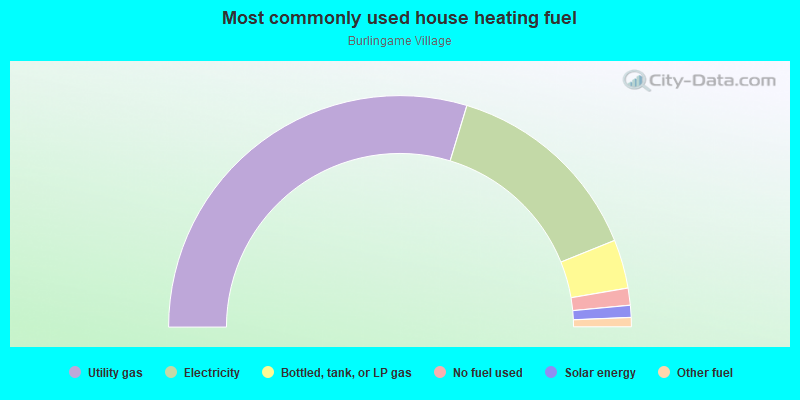
- 59.4%Utility gas
- 28.5%Electricity
- 6.8%Bottled, tank, or LP gas
- 2.4%No fuel used
- 1.7%Solar energy
- 1.3%Other fuel
Highways in this neighborhood:
State Hwy 82 (Mission St, el Camino Real)
Length: 0.40 miles
Direction: SE-NW
Address range: 1532 to 1598
Direction: SE-NW
Address range: 1532 to 1598
Roads and streets:
Westmoor Rd
Length: 0.36 miles
Direction: SE-NW
Address range: 1500 to 1671
Direction: SE-NW
Address range: 1500 to 1671
Eastmoor Rd
Length: 0.26 miles
Directions: E-W, N-S, SE-NW, SW-NE
Address range: 1100 to 1599
Directions: E-W, N-S, SE-NW, SW-NE
Address range: 1100 to 1599
California Dr
Length: 0.22 miles
Directions: E-W, SE-NW
Address range: 1600 to 1699
Directions: E-W, SE-NW
Address range: 1600 to 1699
Rosedale Ave
Length: 0.18 miles
Direction: SW-NE
Address range: 1100 to 1199
Direction: SW-NE
Address range: 1100 to 1199
Dufferin Ave
Length: 0.15 miles
Direction: SW-NE
Address range: 1100 to 1199
Direction: SW-NE
Address range: 1100 to 1199
Meadow Ln
Length: 0.11 miles
Direction: SE-NW
Address range: 1500 to 1599
Direction: SE-NW
Address range: 1500 to 1599
Hamilton Ln
Length: 0.10 miles
Direction: SW-NE
Address range: 1100 to 1199
Direction: SW-NE
Address range: 1100 to 1199
Clovelly Ln
Length: 0.09 miles
Direction: SW-NE
Address range: 1100 to 1199
Direction: SW-NE
Address range: 1100 to 1199
Killarney Ln
Length: 0.09 miles
Direction: SW-NE
Address range: 1100 to 1199
Direction: SW-NE
Address range: 1100 to 1199