Burnt Mills Knolls neighborhood in Silver Spring, Maryland (MD), 20901, 20903 detailed profile
Settings
X


Business Search - 14 Million verified businesses
Area: 0.407 square miles
Population: 1,922
Population density:
| Burnt Mills Knolls: | 4,719 people per square mile |
| Silver Spring: | 7,993 people per square mile |

- 82342.8%Hispanic or Latino
- 47224.5%Black
- 45023.4%White
- 1578.2%Asian
- 180.9%Two or more races
- 40.2%Some other race


Median household income in 2022:
| Burnt Mills Knolls: | $178,747 |
| Silver Spring: | $81,557 |
Distribution of median household income
![Distribution of median household income]()
- 8Less than $10,000
- 8$10,000 to $19,999
- 100$20,000 to $29,999
- 120$30,000 to $39,999
- 46$40,000 to $49,999
- 12$50,000 to $59,999
- 11$60,000 to $74,999
- 14$75,000 to $99,999
- 124$100,000 to $124,999
- 68$125,000 to $149,999
- 57$150,000 to $199,999
- 165$200,000 or more

Distribution of owner-occupied house/condo value
![Distribution of owner-occupied house/condo value]()
- 45Less than $50,000
- 24$100,000 to $149,999
- 8$150,000 to $199,999
- 20$250,000 to $299,999
- 50$300,000 to $399,999
- 129$400,000 to $499,999
- 230$500,000 to $749,999
- 30$750,000 to $999,999
- 32$1,000,000 or more

Distribution of rent paid by renters
![Distribution of rent paid by renters]()
- 15$700 to $799
- 14$1,000 to $1,249
- 59$1,250 to $1,499
- 82$1,500 to $1,999
- 38$2,000 or more

Median rent in 2022:
| Burnt Mills Knolls: | $2,392 |
| Silver Spring: | $1,620 |
| Males: | 1,144 |
| Females: | 777 |
Males:
| This neighborhood: | 35.2 years |
| Whole city: | 36.7 years |
| This neighborhood: | 39.5 years |
| Whole city: | 36.5 years |
Average household size:
| Burnt Mills Knolls: | 3.6 people |
| Silver Spring: | 2.2 people |
Percentage of family households:
| Burnt Mills Knolls: | 70.4% |
| Silver Spring: | 38.8% |
| Here: | 69.6% |
| Silver Spring: | 32.5% |
Percentage of married-couple families with children (among all households):
| Burnt Mills Knolls: | 20.4% |
| Silver Spring: | 34.5% |
Percentage of single-mother households (among all households):
| Burnt Mills Knolls: | 13.6% |
| Silver Spring: | 6.6% |
Percentage of never married males 15 years old and over:
Percentage of never married females 15 years old and over:
| Burnt Mills Knolls: | 27.3% |
| Silver Spring: | 22.2% |
Percentage of never married females 15 years old and over:
| Burnt Mills Knolls: | 9.3% |
| place: | 24.3% |
Percentage of people that speak English not well or not at all:
| Burnt Mills Knolls: | 11.2% |
| Silver Spring: | 9.9% |
Percentage of people born in this state:
Percentage of people born in another U.S. state:
Percentage of native residents but born outside the U.S.:
Percentage of foreign born residents:
| Here: | 24.9% |
| Silver Spring: | 19.7% |
Percentage of people born in another U.S. state:
| Burnt Mills Knolls: | 20.0% |
| Silver Spring: | 45.9% |
Percentage of native residents but born outside the U.S.:
| Here: | 5.6% |
| place: | 2.4% |
Percentage of foreign born residents:
| Here: | 49.5% |
| Silver Spring: | 32.0% |
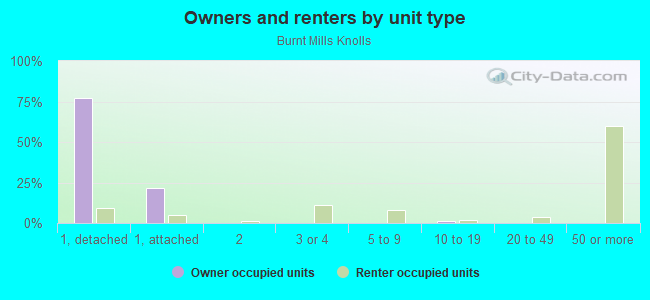
Owner-occupied
Renter-occupied


- Rooms in owner-occupied houses and condos in Burnt Mills Knolls
- 31 room
- 02 rooms
- 03 rooms
- 74 rooms
- 2645 rooms
- 426 rooms
- 497 rooms
- 778 rooms
- 1999+ rooms
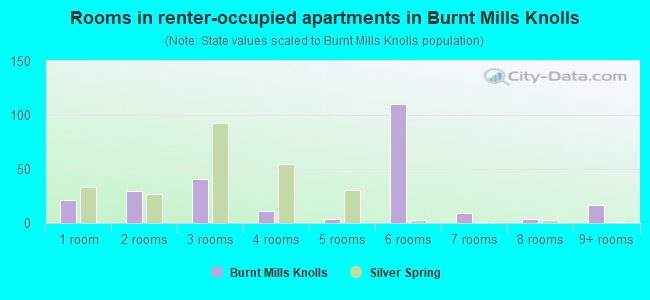
- Rooms in renter-occupied apartments in Burnt Mills Knolls
- 211 room
- 302 rooms
- 413 rooms
- 114 rooms
- 45 rooms
- 1106 rooms
- 97 rooms
- 48 rooms
- 179+ rooms
Owner-occupied
Renter-occupied
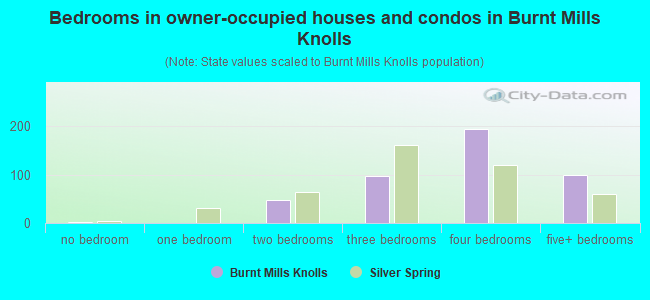
- Bedrooms in owner-occupied houses and condos in Burnt Mills Knolls
- 3no bedroom
- 01 bedroom
- 472 bedrooms
- 963 bedrooms
- 1944 bedrooms
- 995+ bedrooms

- Bedrooms in renter-occupied apartments in Burnt Mills Knolls
- 34no bedroom
- 881 bedroom
- 112 bedrooms
- 343 bedrooms
- 114 bedrooms
- 115+ bedrooms
Average number of cars or other vehicles available in houses/condos:
Average number of cars or other vehicles available in apartments:
| This neighborhood: | 2.5 |
| Silver Spring: | 1.7 |
Average number of cars or other vehicles available in apartments:
| Here: | 1.3 |
| place: | 0.9 |
Percentage of units with a mortgage:
| Burnt Mills Knolls: | 71.7% |
| Silver Spring: | 76.3% |
Average estimated value of detached houses in 2022 (86.0% of all units):
| Burnt Mills Knolls: | $550,126 |
| Maryland: | $526,819 |
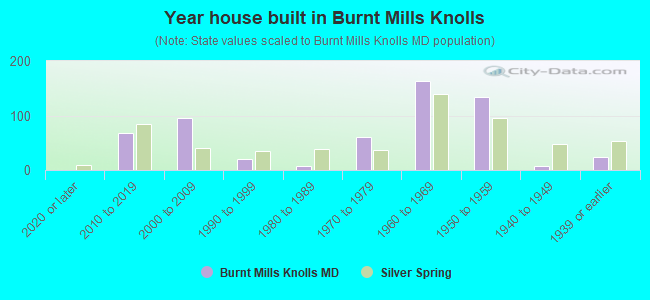
- Year house built in Burnt Mills Knolls
- 02020 or later
- 672010 to 2019
- 962000 to 2009
- 201990 to 1999
- 81980 to 1989
- 601970 to 1979
- 1631960 to 1969
- 1341950 to 1959
- 71940 to 1949
- 231939 or earlier
Travel time to work (commute)
![Travel time to work (commute)]()
- 7Less than 5 minutes
- 305 to 9 minutes
- 2510 to 14 minutes
- 5415 to 19 minutes
- 6320 to 24 minutes
- 8325 to 29 minutes
- 15530 to 34 minutes
- 2835 to 39 minutes
- 7240 to 44 minutes
- 7945 to 59 minutes
- 16160 to 89 minutes
- 1590 or more minutes

Means of transportation to work
![Means of transportation to work]()
- 76.0%704Drove a car alone
- 1.9%18Carpooled
- 5.3%49Bus
- 4.2%39Subway or elevated rail
- 1.2%11Bicycle
- 1.1%10Walked
- 3.5%32Other means
- 14.5%134Worked at home

Time leaving home to go to work
![Time leaving home to go to work]()
- 3612:00 a.m. to 4:59 a.m.
- 235:00 a.m. to 5:29 a.m.
- 115:30 a.m. to 5:59 a.m.
- 1126:00 a.m. to 6:29 a.m.
- 406:30 a.m. to 6:59 a.m.
- 1277:00 a.m. to 7:29 a.m.
- 187:30 a.m. to 7:59 a.m.
- 1168:00 a.m. to 8:29 a.m.
- 298:30 a.m. to 8:59 a.m.
- 789:00 a.m. to 9:59 a.m.
- 5410:00 a.m. to 10:59 a.m.
- 911:00 a.m. to 11:59 a.m.
- 3912:00 p.m. to 3:59 p.m.
- 1094:00 p.m. to 11:59 p.m.

Occupations of males:
- Percentage of males in management occupations (except farmers):
Here: 9.2% place: 11.4%
- Percentage of males in business and financial operations occupations:
Here: 3.0% place: 6.8%
- Percentage of males in computer and mathematical occupations:
Here: 15.1% place: 9.4%
- Percentage of males in architecture and engineering occupations:
Here: 1.5% place: 4.5%
- Percentage of males in community and social services occupations:
Here: 2.2% place: 1.2%
- Percentage of males in legal occupations:
Here: 3.3% place: 3.6%
- Percentage of males in education, training, and library occupations:
Here: 4.0% place: 6.2%
- Percentage of males in healthcare practitioners and technical occupations:
Here: 1.4% place: 2.5%
- Percentage of males in service occupations:
Here: 23.2% place: 10.9%
- Percentage of males in sales and office occupations:
Here: 4.7% place: 9.6%
- Percentage of males in construction, extraction, and maintenance occupations:
Here: 20.4% place: 11.6%
- Percentage of males in production occupations:
Here: 2.7% place: 2.2%
- Percentage of males in transportation occupations:
Here: 3.0% place: 6.4%
Occupations of females:
- Percentage of females in management occupations (except farmers):
Here: 13.8% place: 13.0%
- Percentage of females in business and financial operations occupations:
Here: 4.8% place: 8.9%
- Percentage of females in computer and mathematical occupations:
Here: 5.6% place: 5.0%
- Percentage of females in architecture and engineering occupations:
Here: 1.3% place: 1.3%
- Percentage of females in life, physical, and social science occupations:
Here: 2.1% place: 3.4%
- Percentage of females in community and social services occupations:
Here: 2.1% place: 2.9%
- Percentage of females in legal occupations:
Here: 2.5% place: 4.2%
- Percentage of females in education, training, and library occupations:
Here: 6.0% place: 11.2%
- Percentage of females in arts, design, entertainment, sports, and media occupations:
Here: 3.0% place: 4.5%
- Percentage of females in healthcare practitioners and technical occupations:
Here: 9.4% place: 5.3%
- Percentage of females in service occupations:
Here: 23.3% place: 20.4%
- Percentage of females in sales and office occupations:
Here: 24.1% place: 16.7%
- Percentage of females in production occupations:
Here: 1.9% place: 0.9%
- Percentage of females in transportation occupations:
Here: 1.7% place: 0.6%
Percentage of people 16-64 in Armed Forces:
| Burnt Mills Knolls: | 0.2% |
| Silver Spring: | 0.4% |
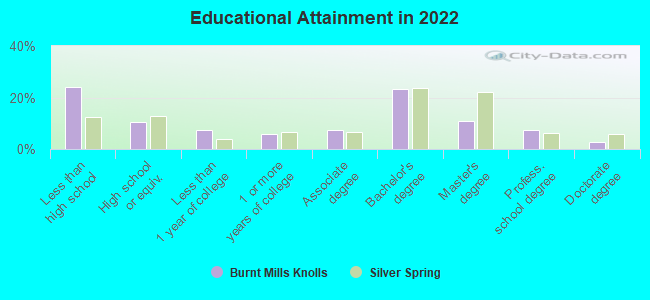
Education in this neighborhood (subdivision or community):
- Percentage of people 3 years and older in K-12 schools:
Burnt Mills Knolls: 15.9% Silver Spring: 14.1%
- Percentage of people 3 years and older in undergraduate colleges:
Burnt Mills Knolls: 9.7% Silver Spring: 3.4%
- Percentage of people 3 years and older in grad. or professional schools:
Burnt Mills Knolls: 3.5% Silver Spring: 2.0%
- Percentage of students K-12 enrolled in private schools:
Burnt Mills Knolls: 34.0% Silver Spring: 12.6%
Percentage of population below poverty level:
| Burnt Mills Knolls: | 13.9% |
| Silver Spring: | 11.0% |
Median year owner moved in (as recorded in 2022):
Median year renter moved in (as recorded in 2022):
| Burnt Mills Knolls: | 2007 |
| Silver Spring: | 2011 |
Median year renter moved in (as recorded in 2022):
| Burnt Mills Knolls: | 2017 |
| Silver Spring: | 2020 |
Percentage of married-couple families with both working:
| Burnt Mills Knolls: | 182.1% |
| Silver Spring: | 80.2% |
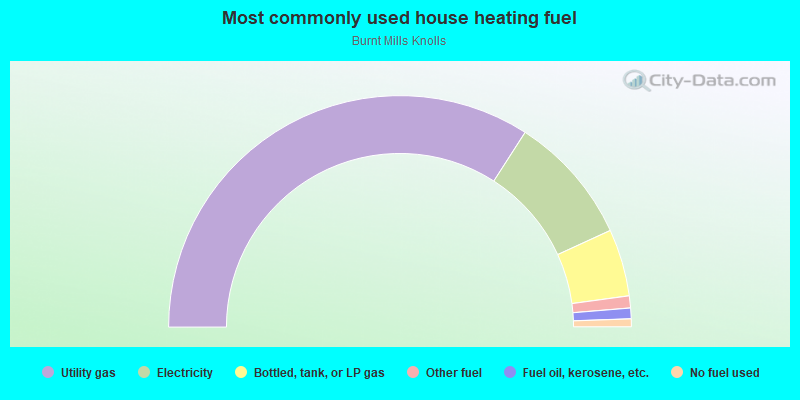
- 68.2%Utility gas
- 18.1%Electricity
- 9.4%Bottled, tank, or LP gas
- 1.7%Other fuel
- 1.5%Fuel oil, kerosene, etc.
- 1.1%No fuel used
Highways in this neighborhood:
New Hampshire Ave (State Hwy 650)
Length: 0.14 miles
Direction: SE-NW
Address range: 10700 to 10805
Direction: SE-NW
Address range: 10700 to 10805
Roads and streets:
Schindler Dr
Length: 0.79 miles
Directions: N-S, SW-NE
Address range: 700 to 1299
Directions: N-S, SW-NE
Address range: 700 to 1299
W Nolcrest Dr
Length: 0.54 miles
Directions: E-W, N-S, SE-NW, SW-NE
Address range: 900 to 1199
Directions: E-W, N-S, SE-NW, SW-NE
Address range: 900 to 1199
Ruppert Rd
Length: 0.47 miles
Direction: SW-NE
Address range: 1000 to 1398
Direction: SW-NE
Address range: 1000 to 1398
Gatewood Ave
Length: 0.39 miles
Directions: E-W, N-S, SE-NW
Address range: 900 to 10799
Directions: E-W, N-S, SE-NW
Address range: 900 to 10799
Edelblut Dr
Length: 0.29 miles
Direction: SW-NE
Address range: 700 to 899
Direction: SW-NE
Address range: 700 to 899
Crest Park Dr
Length: 0.29 miles
Directions: E-W, N-S, SW-NE
Address range: 900 to 1099
Directions: E-W, N-S, SW-NE
Address range: 900 to 1099
E Nolcrest Dr
Length: 0.26 miles
Directions: E-W, SE-NW
Address range: 10700 to 10899
Directions: E-W, SE-NW
Address range: 10700 to 10899
Blossom Ln
Length: 0.26 miles
Directions: E-W, SE-NW
Address range: 10700 to 10899
Directions: E-W, SE-NW
Address range: 10700 to 10899
Burnt Crest Ln
Length: 0.22 miles
Direction: E-W
Address range: 900 to 999
Direction: E-W
Address range: 900 to 999
Burnt Ember Dr
Length: 0.21 miles
Directions: N-S, SE-NW
Address range: 10300 to 10499
Directions: N-S, SE-NW
Address range: 10300 to 10499
Harper Ave
Length: 0.20 miles
Directions: N-S, SE-NW
Address range: 10600 to 10799
Directions: N-S, SE-NW
Address range: 10600 to 10799
McCeney Ave
Length: 0.18 miles
Directions: E-W, SE-NW, SW-NE
Address range: 812 to 964
Directions: E-W, SE-NW, SW-NE
Address range: 812 to 964
la Grande Rd (Lagrande Rd)
Length: 0.14 miles
Directions: E-W, SE-NW
Address range: 900 to 999
Directions: E-W, SE-NW
Address range: 900 to 999
Crest Park Ct
Length: 0.13 miles
Directions: E-W, N-S, SW-NE
Address range: 1 to 99
Directions: E-W, N-S, SW-NE
Address range: 1 to 99
Schindler Ct
Length: 0.11 miles
Directions: E-W, SE-NW
Address range: 1 to 99
Directions: E-W, SE-NW
Address range: 1 to 99
Lilac Pl
Length: 0.10 miles
Direction: SE-NW
Address range: 10600 to 10699
Direction: SE-NW
Address range: 10600 to 10699
Nolcrest Dr
Length: 0.10 miles
Directions: N-S, SW-NE
Address range: 10300 to 10399
Directions: N-S, SW-NE
Address range: 10300 to 10399
Burnt Mills Ave
Length: 0.01 miles
Direction: SW-NE
Direction: SW-NE