C.H.A.R.M (Central Historical Area Residents of Massillon) neighborhood in Massillon, Ohio (OH), 44646 detailed profile
Settings
X

Business Search - 14 Million verified businesses
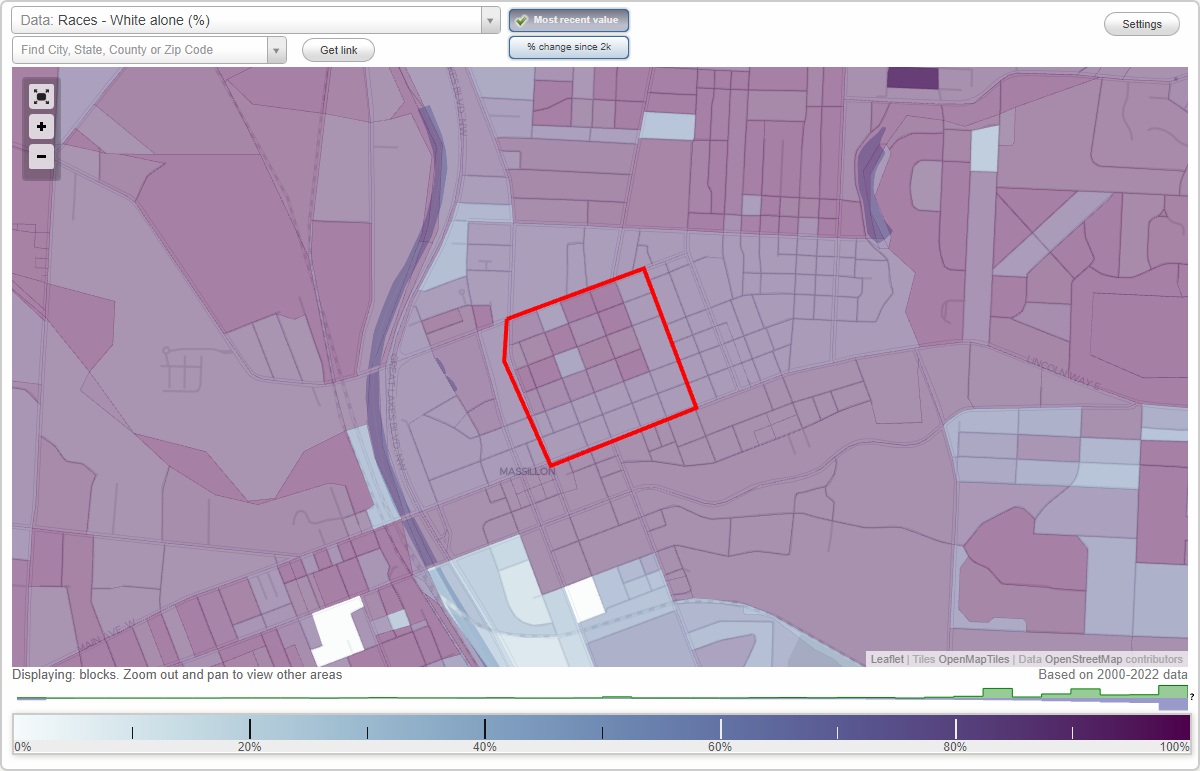
Area: 0.121 square miles
Population: 767
Population density:
| C.H.A.R.M (Central Historical Area Residents of Massillon): | 6,363 people per square mile |
| Massillon: | 1,921 people per square mile |

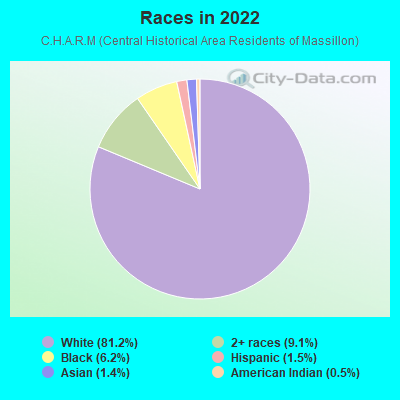
- 63181.2%White
- 719.1%Two or more races
- 486.2%Black
- 121.5%Hispanic or Latino
- 111.4%Asian
- 40.5%American Indian
Median household income in 2022:
| C.H.A.R.M (Central Historical Area Residents of Massillon): | $54,637 |
| Massillon: | $53,699 |
Distribution of median household income
![Distribution of median household income]()
- 5Less than $10,000
- 24$10,000 to $19,999
- 36$20,000 to $29,999
- 51$30,000 to $39,999
- 40$40,000 to $49,999
- 25$50,000 to $59,999
- 52$60,000 to $74,999
- 79$75,000 to $99,999
- 30$100,000 to $124,999
- 13$125,000 to $149,999
- 4$150,000 to $199,999
- 6$200,000 or more

Distribution of owner-occupied house/condo value
![Distribution of owner-occupied house/condo value]()
- 81$50,000 to $99,999
- 55$100,000 to $149,999
- 34$150,000 to $199,999
- 4$200,000 to $249,999
- 7$400,000 to $499,999

Distribution of rent paid by renters
![Distribution of rent paid by renters]()
- 5Less than $100
- 9$200 to $299
- 36$400 to $499
- 47$500 to $599
- 69$600 to $699
- 23$800 to $899

Median rent in 2022:
| C.H.A.R.M (Central Historical Area Residents of Massillon): | $601 |
| Massillon: | $634 |
| Males: | 395 |
| Females: | 372 |
Males:
| This neighborhood: | 39.0 years |
| Whole city: | 39.7 years |
| This neighborhood: | 35.7 years |
| Whole city: | 41.9 years |
Average household size:
| C.H.A.R.M (Central Historical Area Residents of Massillon): | 2.3 people |
| Massillon: | 2.2 people |
Percentage of family households:
| C.H.A.R.M (Central Historical Area Residents of Massillon): | 39.2% |
| Massillon: | 43.2% |
| Here: | 31.8% |
| Massillon: | 39.0% |
Percentage of married-couple families with children (among all households):
| C.H.A.R.M (Central Historical Area Residents of Massillon): | 35.0% |
| Massillon: | 23.1% |
Percentage of single-mother households (among all households):
| C.H.A.R.M (Central Historical Area Residents of Massillon): | 6.5% |
| Massillon: | 14.2% |
Percentage of never married males 15 years old and over:
Percentage of never married females 15 years old and over:
| C.H.A.R.M (Central Historical Area Residents of Massillon): | 21.7% |
| Massillon: | 17.6% |
Percentage of never married females 15 years old and over:
| C.H.A.R.M (Central Historical Area Residents of Massillon): | 15.2% |
| city: | 14.6% |
Percentage of people that speak English not well or not at all:
| C.H.A.R.M (Central Historical Area Residents of Massillon): | 0.0% |
| Massillon: | 0.3% |
Percentage of people born in this state:
Percentage of people born in another U.S. state:
Percentage of native residents but born outside the U.S.:
Percentage of foreign born residents:
| Here: | 78.3% |
| Massillon: | 84.9% |
Percentage of people born in another U.S. state:
| C.H.A.R.M (Central Historical Area Residents of Massillon): | 19.1% |
| Massillon: | 13.4% |
Percentage of native residents but born outside the U.S.:
| Here: | 0.0% |
| city: | 0.3% |
Percentage of foreign born residents:
| Here: | 2.7% |
| Massillon: | 1.4% |
Owner-occupied
Renter-occupied

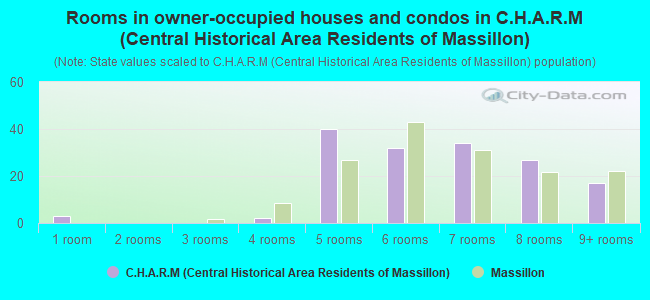
- Rooms in owner-occupied houses and condos in C.H.A.R.M <
> - 31 room
- 02 rooms
- 03 rooms
- 24 rooms
- 405 rooms
- 326 rooms
- 347 rooms
- 278 rooms
- 179+ rooms
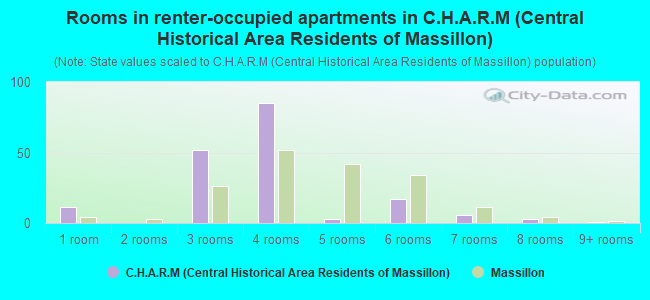
- Rooms in renter-occupied apartments in C.H.A.R.M <
> - 111 room
- 02 rooms
- 523 rooms
- 854 rooms
- 35 rooms
- 176 rooms
- 67 rooms
- 38 rooms
- 19+ rooms
Owner-occupied
Renter-occupied
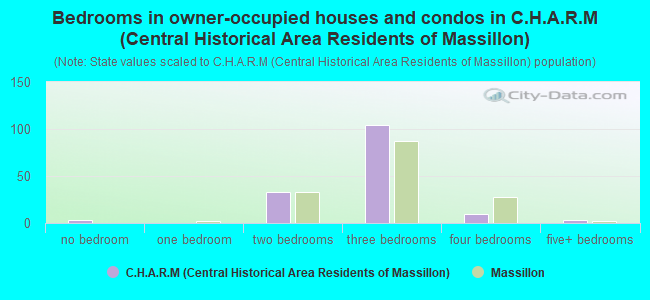
- Bedrooms in owner-occupied houses and condos in C.H.A.R.M <
> - 3no bedroom
- 01 bedroom
- 332 bedrooms
- 1043 bedrooms
- 104 bedrooms
- 35+ bedrooms
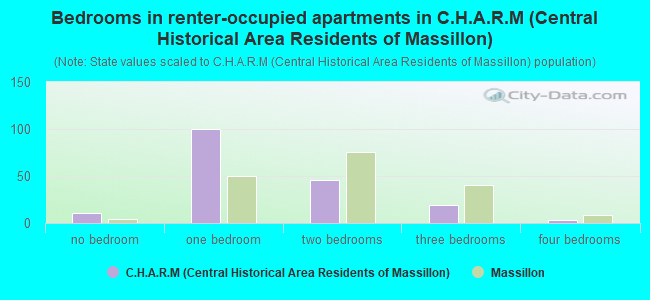
- Bedrooms in renter-occupied apartments in C.H.A.R.M <
> - 11no bedroom
- 1001 bedroom
- 462 bedrooms
- 193 bedrooms
- 34 bedrooms
- 05+ bedrooms
Average number of cars or other vehicles available in houses/condos:
Average number of cars or other vehicles available in apartments:
| This neighborhood: | 2.6 |
| Massillon: | 2.0 |
Average number of cars or other vehicles available in apartments:
| Here: | 1.2 |
| city: | 1.3 |
Percentage of units with a mortgage:
| C.H.A.R.M (Central Historical Area Residents of Massillon): | 76.8% |
| Massillon: | 63.6% |
Average estimated value of detached houses in 2022 (56.9% of all units):
| C.H.A.R.M (Central Historical Area Residents of Massillon): | $113,551 |
| Ohio: | $254,366 |
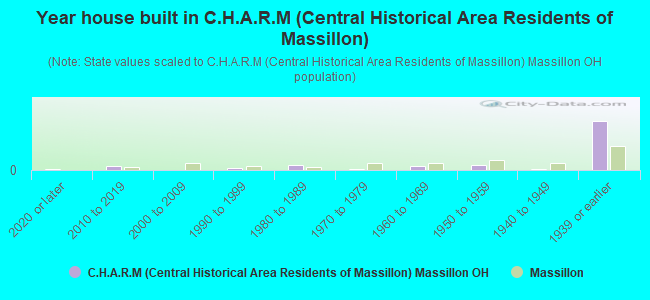
- Year house built in C.H.A.R.M <
> - 32020 or later
- 252010 to 2019
- 02000 to 2009
- 121990 to 1999
- 291980 to 1989
- 81970 to 1979
- 241960 to 1969
- 311950 to 1959
- 51940 to 1949
- 2901939 or earlier
City-data.com crime index for city in 2020 (higher means more crime):
| City: | 180.9 |
| U.S. average: | 219.5 |
Travel time to work (commute)
![Travel time to work (commute)]()
- 16Less than 5 minutes
- 875 to 9 minutes
- 6210 to 14 minutes
- 8215 to 19 minutes
- 12220 to 24 minutes
- 1825 to 29 minutes
- 2530 to 34 minutes
- 635 to 39 minutes
- 1240 to 44 minutes
- 745 to 59 minutes
- 2360 to 89 minutes

Means of transportation to work
![Means of transportation to work]()
- 76.6%402Drove a car alone
- 7.4%39Carpooled
- 1.0%5Bus
- 1.5%8Walked
- 1.0%5Other means
- 12.0%63Worked at home

Time leaving home to go to work
![Time leaving home to go to work]()
- 1812:00 a.m. to 4:59 a.m.
- 35:00 a.m. to 5:29 a.m.
- 55:30 a.m. to 5:59 a.m.
- 316:00 a.m. to 6:29 a.m.
- 386:30 a.m. to 6:59 a.m.
- 297:00 a.m. to 7:29 a.m.
- 497:30 a.m. to 7:59 a.m.
- 878:00 a.m. to 8:29 a.m.
- 368:30 a.m. to 8:59 a.m.
- 359:00 a.m. to 9:59 a.m.
- 1410:00 a.m. to 10:59 a.m.
- 211:00 a.m. to 11:59 a.m.
- 6312:00 p.m. to 3:59 p.m.
- 524:00 p.m. to 11:59 p.m.

Occupations of males:
- Percentage of males in management occupations (except farmers):
Here: 24.8% city: 11.6%
- Percentage of males in business and financial operations occupations:
Here: 150.8% city: 2.6%
- Percentage of males in computer and mathematical occupations:
Here: 134.0% city: 2.0%
- Percentage of males in architecture and engineering occupations:
Here: 167.5% city: 0.8%
- Percentage of males in community and social services occupations:
Here: 100.5% city: 0.6%
- Percentage of males in legal occupations:
Here: 2.3% city: 0.2%
- Percentage of males in education, training, and library occupations:
Here: 201.0% city: 2.5%
- Percentage of males in arts, design, entertainment, sports, and media occupations:
Here: 3.0% city: 0.7%
- Percentage of males in healthcare practitioners and technical occupations:
Here: 1.3% city: 0.9%
- Percentage of males in service occupations:
Here: 17.4% city: 14.4%
- Percentage of males in sales and office occupations:
Here: 14.2% city: 14.1%
- Percentage of males in construction, extraction, and maintenance occupations:
Here: 1.5% city: 5.2%
- Percentage of males in production occupations:
Here: 20.5% city: 16.4%
- Percentage of males in transportation occupations:
Here: 6.1% city: 7.4%
- Percentage of males in material moving occupations:
Here: 4.9% city: 12.9%
Occupations of females:
- Percentage of females in management occupations (except farmers):
Here: 3.9% city: 6.4%
- Percentage of females in business and financial operations occupations:
Here: 2.1% city: 4.7%
- Percentage of females in computer and mathematical occupations:
Here: 171.7% city: 1.3%
- Percentage of females in community and social services occupations:
Here: 3.9% city: 1.7%
- Percentage of females in education, training, and library occupations:
Here: 2.3% city: 8.1%
- Percentage of females in arts, design, entertainment, sports, and media occupations:
Here: 1.6% city: 1.3%
- Percentage of females in healthcare practitioners and technical occupations:
Here: 2.7% city: 6.6%
- Percentage of females in service occupations:
Here: 34.4% city: 28.1%
- Percentage of females in sales and office occupations:
Here: 35.1% city: 30.1%
- Percentage of females in production occupations:
Here: 12.6% city: 5.3%
- Percentage of females in material moving occupations:
Here: 1.4% city: 1.8%
Education in this neighborhood (subdivision or community):
- Percentage of people 3 years and older in K-12 schools:
C.H.A.R.M (Central Historical Area Residents of Massillon): 16.4% Massillon: 15.5%
- Percentage of people 3 years and older in undergraduate colleges:
C.H.A.R.M (Central Historical Area Residents of Massillon): 5.7% Massillon: 3.0%
- Percentage of people 3 years and older in grad. or professional schools:
C.H.A.R.M (Central Historical Area Residents of Massillon): 2.7% Massillon: 0.6%
- Percentage of students K-12 enrolled in private schools:
C.H.A.R.M (Central Historical Area Residents of Massillon): 0.0% Massillon: 10.0%
Percentage of population below poverty level:
| C.H.A.R.M (Central Historical Area Residents of Massillon): | 10.9% |
| Massillon: | 14.5% |
Median year owner moved in (as recorded in 2022):
Median year renter moved in (as recorded in 2022):
| C.H.A.R.M (Central Historical Area Residents of Massillon): | 2012 |
| Massillon: | 2007 |
Median year renter moved in (as recorded in 2022):
| C.H.A.R.M (Central Historical Area Residents of Massillon): | 2019 |
| Massillon: | 2015 |
Percentage of married-couple families with both working:
| C.H.A.R.M (Central Historical Area Residents of Massillon): | 100.0% |
| Massillon: | 82.9% |
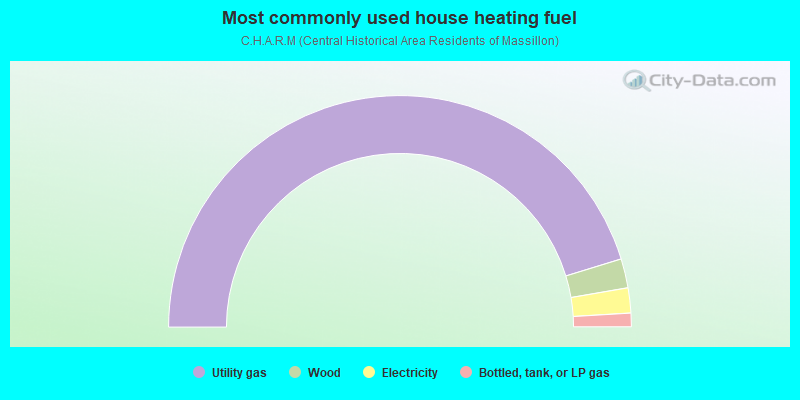
- 90.5%Utility gas
- 4.1%Wood
- 3.5%Electricity
- 1.9%Bottled, tank, or LP gas
Highways in this neighborhood:
Lincoln Way E (State Hwy 172, State Hwy 241)
Length: 0.39 miles
Direction: E-W
Address range: 139 to 599
Direction: E-W
Address range: 139 to 599
Roads and streets:
Federal Ave NE (1229)
Length: 0.45 miles
Direction: E-W
Address range: 100 to 599
Direction: E-W
Address range: 100 to 599
1354 (North Ave NE)
Length: 0.45 miles
Direction: E-W
Address range: 100 to 599
Direction: E-W
Address range: 100 to 599
Chestnut Ave NE (1181)
Length: 0.45 miles
Direction: E-W
Address range: 100 to 599
Direction: E-W
Address range: 100 to 599
1279 (Harvard Ave NE)
Length: 0.44 miles
Direction: E-W
Address range: 100 to 599
Direction: E-W
Address range: 100 to 599
Thorne Ave NE (1446)
Length: 0.36 miles
Direction: E-W
Address range: 100 to 499
Direction: E-W
Address range: 100 to 499
1414 (6th St NE)
Length: 0.32 miles
Direction: SE-NW
Address range: 1 to 549
Direction: SE-NW
Address range: 1 to 549
1395 (2nd St NE)
Length: 0.29 miles
Direction: SE-NW
Address range: 1 to 499
Direction: SE-NW
Address range: 1 to 499
1250 (4th St NE)
Length: 0.29 miles
Direction: SE-NW
Address range: 1 to 499
Direction: SE-NW
Address range: 1 to 499
3rd St NE (1437)
Length: 0.29 miles
Direction: SE-NW
Address range: 1 to 499
Direction: SE-NW
Address range: 1 to 499
5th St NE (1234)
Length: 0.29 miles
Direction: SE-NW
Address range: 1 to 499
Direction: SE-NW
Address range: 1 to 499
1st St NE (1240)
Length: 0.23 miles
Directions: N-S, SE-NW
Address range: 100 to 499
Directions: N-S, SE-NW
Address range: 100 to 499
Conrad Pl NE
Length: 0.23 miles
Direction: SE-NW
Direction: SE-NW