CBD neighborhood in Seattle, Washington (WA), 98101, 98104 detailed profile
Settings
X


Business Search - 14 Million verified businesses
Area: 0.314 square miles
Population: 9,066
Population density:
| CBD: | 28,887 people per square mile |
| Seattle: | 8,933 people per square mile |

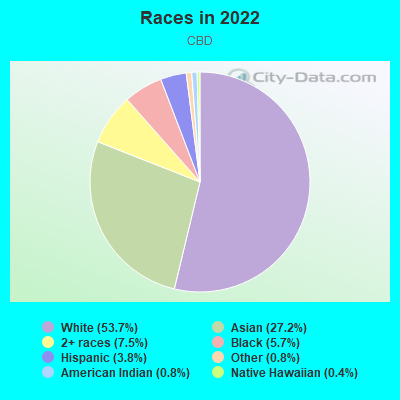
- 4,96553.7%White
- 2,51727.2%Asian
- 6957.5%Two or more races
- 5305.7%Black
- 3493.8%Hispanic or Latino
- 730.8%American Indian
- 750.8%Some other race
- 370.4%Native Hawaiian and Other
Pacific Islander
Median household income in 2022:
| CBD: | $96,289 |
| Seattle: | $115,409 |
Distribution of median household income
![Distribution of median household income]()
- 476Less than $10,000
- 427$10,000 to $19,999
- 328$20,000 to $29,999
- 372$30,000 to $39,999
- 310$40,000 to $49,999
- 177$50,000 to $59,999
- 236$60,000 to $74,999
- 734$75,000 to $99,999
- 765$100,000 to $124,999
- 579$125,000 to $149,999
- 765$150,000 to $199,999
- 1,514$200,000 or more

Distribution of owner-occupied house/condo value
![Distribution of owner-occupied house/condo value]()
- 94$100,000 to $149,999
- 418$200,000 to $249,999
- 78$300,000 to $399,999
- 499$400,000 to $499,999
- 265$500,000 to $749,999
- 111$750,000 to $999,999
- 367$1,000,000 or more

Distribution of rent paid by renters
![Distribution of rent paid by renters]()
- 90Less than $100
- 171$100 to $199
- 402$200 to $299
- 100$300 to $399
- 298$400 to $499
- 209$500 to $599
- 123$600 to $699
- 196$700 to $799
- 113$800 to $899
- 306$900 to $999
- 399$1,000 to $1,249
- 481$1,250 to $1,499
- 855$1,500 to $1,999
- 3,089$2,000 or more

Median rent in 2022:
| CBD: | $2,156 |
| Seattle: | $1,762 |
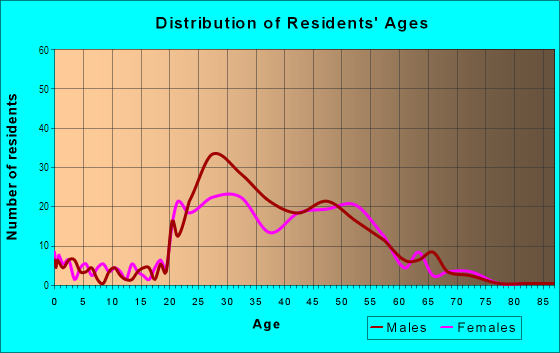
| Males: | 4,931 |
| Females: | 4,135 |
Males:
| This neighborhood: | 36.4 years |
| Whole city: | 35.7 years |
| This neighborhood: | 54.2 years |
| Whole city: | 36.2 years |
Average household size:
| CBD: | 1.4 people |
| Seattle: | 2.0 people |
Percentage of family households:
| CBD: | 20.1% |
| Seattle: | 30.9% |
| Here: | 19.4% |
| Seattle: | 33.2% |
Percentage of married-couple families with children (among all households):
| CBD: | 40.2% |
| Seattle: | 36.5% |
Percentage of single-mother households (among all households):
| CBD: | 44.9% |
| Seattle: | 9.3% |
Percentage of never married males 15 years old and over:
Percentage of never married females 15 years old and over:
| CBD: | 35.6% |
| Seattle: | 24.9% |
Percentage of never married females 15 years old and over:
| CBD: | 22.6% |
| city: | 22.3% |
Percentage of people that speak English not well or not at all:
| CBD: | 2.1% |
| Seattle: | 3.2% |
Percentage of people born in this state:
Percentage of people born in another U.S. state:
Percentage of native residents but born outside the U.S.:
Percentage of foreign born residents:
| Here: | 19.5% |
| Seattle: | 34.6% |
Percentage of people born in another U.S. state:
| CBD: | 42.5% |
| Seattle: | 42.9% |
Percentage of native residents but born outside the U.S.:
| Here: | 2.5% |
| city: | 2.2% |
Percentage of foreign born residents:
| Here: | 35.5% |
| Seattle: | 20.3% |
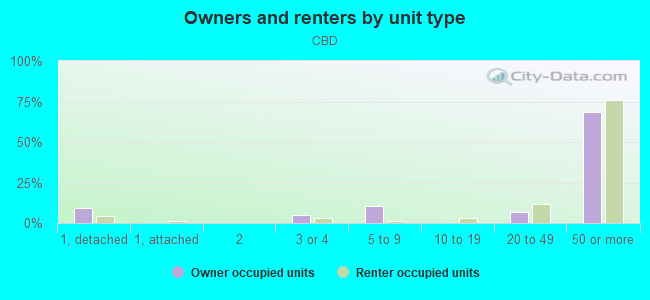
Owner-occupied
Renter-occupied

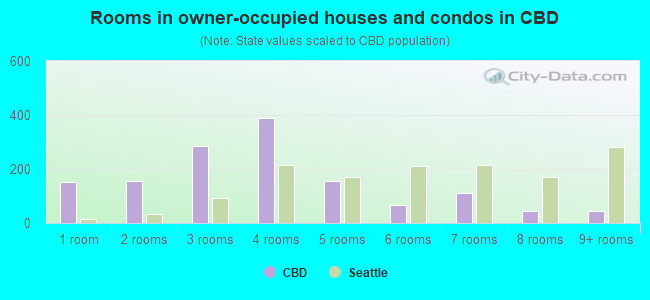
- Rooms in owner-occupied houses and condos in CBD
- 1531 room
- 1552 rooms
- 2853 rooms
- 3884 rooms
- 1565 rooms
- 676 rooms
- 1107 rooms
- 468 rooms
- 439+ rooms
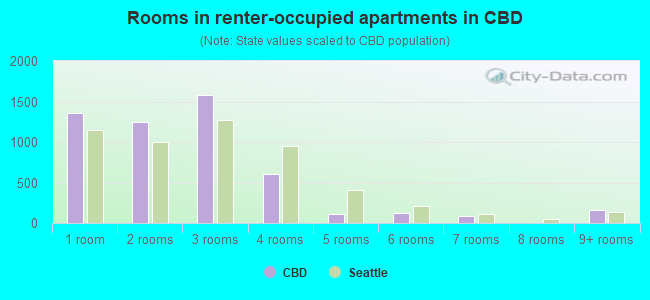
- Rooms in renter-occupied apartments in CBD
- 1,3581 room
- 1,2492 rooms
- 1,5753 rooms
- 6084 rooms
- 1165 rooms
- 1296 rooms
- 907 rooms
- 08 rooms
- 1619+ rooms
Owner-occupied
Renter-occupied
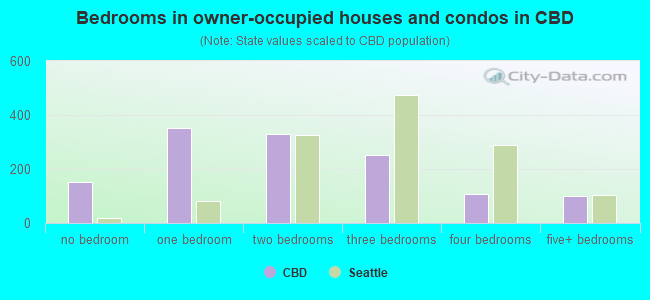
- Bedrooms in owner-occupied houses and condos in CBD
- 153no bedroom
- 3511 bedroom
- 3292 bedrooms
- 2523 bedrooms
- 1094 bedrooms
- 1005+ bedrooms
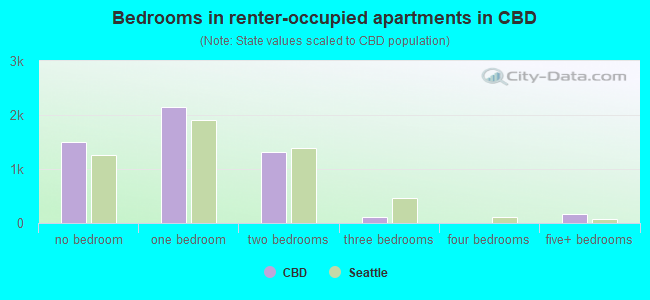
- Bedrooms in renter-occupied apartments in CBD
- 1,492no bedroom
- 2,1431 bedroom
- 1,3212 bedrooms
- 1053 bedrooms
- 04 bedrooms
- 1615+ bedrooms
Average number of cars or other vehicles available in houses/condos:
Average number of cars or other vehicles available in apartments:
| This neighborhood: | 0.8 |
| Seattle: | 1.7 |
Average number of cars or other vehicles available in apartments:
| Here: | 0.5 |
| city: | 0.9 |
Percentage of units with a mortgage:
| CBD: | 50.4% |
| Seattle: | 70.4% |
Average estimated '22 value of housing units in 5-or-more-unit structures (88.1% of all units):
| CBD: | $721,870 |
| Seattle: | $626,747 |
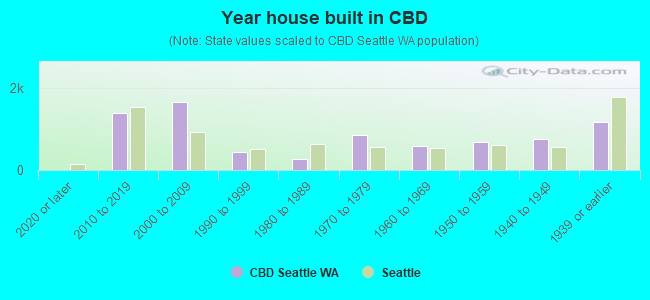
- Year house built in CBD
- 02020 or later
- 1,3822010 to 2019
- 1,6482000 to 2009
- 4451990 to 1999
- 2711980 to 1989
- 8461970 to 1979
- 5871960 to 1969
- 6851950 to 1959
- 7591940 to 1949
- 1,1591939 or earlier
City-data.com crime index for city in 2020 (higher means more crime):
| City: | 440.8 |
| U.S. average: | 219.5 |
Travel time to work (commute)
![Travel time to work (commute)]()
- 201Less than 5 minutes
- 2695 to 9 minutes
- 1,03810 to 14 minutes
- 83215 to 19 minutes
- 75620 to 24 minutes
- 32425 to 29 minutes
- 39430 to 34 minutes
- 19935 to 39 minutes
- 23640 to 44 minutes
- 43745 to 59 minutes
- 16760 to 89 minutes
- 6090 or more minutes

Means of transportation to work
![Means of transportation to work]()
- 24.0%1,498Drove a car alone
- 1.5%92Carpooled
- 9.7%607Bus
- 4.1%258Subway or elevated rail
- 0.8%48Long-distance train or commuter rail
- 2.4%148Light rail, streetcar or trolley
- 0.8%53Ferryboat
- 1.1%70Taxi
- 0.8%48Motorcycle
- 1.8%110Bicycle
- 31.6%1,976Walked
- 1.9%116Other means
- 28.0%1,746Worked at home

Time leaving home to go to work
![Time leaving home to go to work]()
- 6412:00 a.m. to 4:59 a.m.
- 905:00 a.m. to 5:29 a.m.
- 245:30 a.m. to 5:59 a.m.
- 2186:00 a.m. to 6:29 a.m.
- 3936:30 a.m. to 6:59 a.m.
- 5877:00 a.m. to 7:29 a.m.
- 3567:30 a.m. to 7:59 a.m.
- 8408:00 a.m. to 8:29 a.m.
- 8388:30 a.m. to 8:59 a.m.
- 9179:00 a.m. to 9:59 a.m.
- 31510:00 a.m. to 10:59 a.m.
- 9211:00 a.m. to 11:59 a.m.
- 8512:00 p.m. to 3:59 p.m.
- 684:00 p.m. to 11:59 p.m.

Occupations of males:
- Percentage of males in management occupations (except farmers):
Here: 16.0% city: 16.0%
- Percentage of males in business and financial operations occupations:
Here: 8.6% city: 7.6%
- Percentage of males in computer and mathematical occupations:
Here: 37.4% city: 18.5%
- Percentage of males in architecture and engineering occupations:
Here: 4.2% city: 5.6%
- Percentage of males in community and social services occupations:
Here: 1.0% city: 1.1%
- Percentage of males in education, training, and library occupations:
Here: 2.8% city: 4.1%
- Percentage of males in healthcare practitioners and technical occupations:
Here: 4.5% city: 3.6%
- Percentage of males in service occupations:
Here: 10.9% city: 10.5%
- Percentage of males in sales and office occupations:
Here: 8.0% city: 12.0%
- Percentage of males in transportation occupations:
Here: 2.1% city: 3.0%
- Percentage of males in material moving occupations:
Here: 1.1% city: 1.9%
Occupations of females:
- Percentage of females in management occupations (except farmers):
Here: 20.3% city: 14.2%
- Percentage of females in business and financial operations occupations:
Here: 6.2% city: 9.8%
- Percentage of females in computer and mathematical occupations:
Here: 21.2% city: 6.6%
- Percentage of females in architecture and engineering occupations:
Here: 7.3% city: 2.1%
- Percentage of females in community and social services occupations:
Here: 1.9% city: 3.2%
- Percentage of females in legal occupations:
Here: 1.4% city: 2.5%
- Percentage of females in education, training, and library occupations:
Here: 1.8% city: 8.7%
- Percentage of females in arts, design, entertainment, sports, and media occupations:
Here: 5.8% city: 5.0%
- Percentage of females in healthcare practitioners and technical occupations:
Here: 16.8% city: 9.6%
- Percentage of females in service occupations:
Here: 3.6% city: 13.7%
- Percentage of females in sales and office occupations:
Here: 9.7% city: 17.7%
- Percentage of females in production occupations:
Here: 3.5% city: 1.3%
Percentage of people 16-64 in Armed Forces:
| CBD: | 0.0% |
| Seattle: | 0.2% |
Education in this neighborhood (subdivision or community):
- Percentage of people 3 years and older in K-12 schools:
CBD: 6.9% Seattle: 9.8%
- Percentage of people 3 years and older in undergraduate colleges:
CBD: 5.2% Seattle: 6.3%
- Percentage of people 3 years and older in grad. or professional schools:
CBD: 2.1% Seattle: 3.0%
- Percentage of students K-12 enrolled in private schools:
CBD: 33.1% Seattle: 17.3%
Percentage of population below poverty level:
| CBD: | 9.5% |
| Seattle: | 10.1% |
Median year renter moved in (as recorded in 2022):
| CBD: | 2017 |
| Seattle: | 2021 |
Percentage of married-couple families with both working:
| CBD: | 98.5% |
| Seattle: | 74.4% |
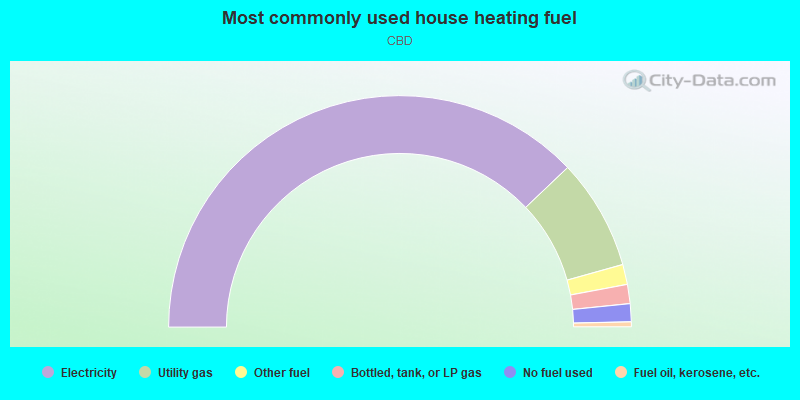
- 75.8%Electricity
- 15.5%Utility gas
- 2.8%Other fuel
- 2.7%Bottled, tank, or LP gas
- 2.5%No fuel used
- 0.7%Fuel oil, kerosene, etc.
Limited-access highways (interstate or state) in this neighborhood:
I- 5
Length: 1.01 miles
Directions: N-S, SE-NW, SW-NE
Directions: N-S, SE-NW, SW-NE
Highways in this neighborhood:
State Rte 99 (Alaskan Way Viaduct, Alaska Fwy)
Length: 0.09 miles
Direction: SE-NW
Direction: SE-NW
Roads and streets:
5th Ave
Length: 0.70 miles
Direction: SE-NW
Address range: 700 to 1649
Direction: SE-NW
Address range: 700 to 1649
4th Ave
Length: 0.68 miles
Direction: SE-NW
Address range: 700 to 1613
Direction: SE-NW
Address range: 700 to 1613
3rd Ave
Length: 0.68 miles
Direction: SE-NW
Address range: 700 to 1599
Direction: SE-NW
Address range: 700 to 1599
Pine St
Length: 0.66 miles
Directions: E-W, SW-NE
Address range: 300 to 1099
Directions: E-W, SW-NE
Address range: 300 to 1099
6th Ave
Length: 0.65 miles
Direction: SE-NW
Address range: 750 to 1611
Direction: SE-NW
Address range: 750 to 1611
University St
Length: 0.65 miles
Directions: E-W, SE-NW, SW-NE
Address range: 21 to 699
Directions: E-W, SE-NW, SW-NE
Address range: 21 to 699
Seneca St
Length: 0.65 miles
Direction: SW-NE
Address range: 21 to 723
Direction: SW-NE
Address range: 21 to 723
Spring St
Length: 0.62 miles
Directions: E-W, SW-NE
Address range: 29 to 702
Directions: E-W, SW-NE
Address range: 29 to 702
Madison St
Length: 0.61 miles
Direction: SW-NE
Address range: 29 to 599
Direction: SW-NE
Address range: 29 to 599
Pike St
Length: 0.56 miles
Direction: SW-NE
Address range: 290 to 939
Direction: SW-NE
Address range: 290 to 939
Marion St
Length: 0.55 miles
Directions: E-W, SW-NE
Address range: 29 to 599
Directions: E-W, SW-NE
Address range: 29 to 599
Union St
Length: 0.53 miles
Directions: E-W, SW-NE
Address range: 100 to 769
Directions: E-W, SW-NE
Address range: 100 to 769
2nd Ave
Length: 0.49 miles
Direction: SE-NW
Address range: 700 to 1399
Direction: SE-NW
Address range: 700 to 1399
Columbia St
Length: 0.43 miles
Directions: E-W, SW-NE
Address range: 43 to 599
Directions: E-W, SW-NE
Address range: 43 to 599
1st Ave
Length: 0.36 miles
Direction: SE-NW
Address range: 900 to 1399
Direction: SE-NW
Address range: 900 to 1399
Western Ave
Length: 0.33 miles
Direction: SE-NW
Address range: 800 to 1299
Direction: SE-NW
Address range: 800 to 1299
7th Ave
Length: 0.28 miles
Direction: SE-NW
Address range: 1300 to 1605
Direction: SE-NW
Address range: 1300 to 1605
8th Ave
Length: 0.24 miles
Direction: SE-NW
Address range: 1346 to 1627
Direction: SE-NW
Address range: 1346 to 1627
Cherry St
Length: 0.24 miles
Direction: SW-NE
Address range: 200 to 499
Direction: SW-NE
Address range: 200 to 499
9th Ave
Length: 0.20 miles
Direction: SE-NW
Address range: 1430 to 1653
Direction: SE-NW
Address range: 1430 to 1653
Olive Way
Length: 0.16 miles
Direction: SW-NE
Address range: 1036 to 1224
Direction: SW-NE
Address range: 1036 to 1224
Convention Pl
Length: 0.14 miles
Directions: N-S, SW-NE
Address range: 750 to 899
Directions: N-S, SW-NE
Address range: 750 to 899
Post Ave
Length: 0.14 miles
Direction: SE-NW
Address range: 892 to 1199
Direction: SE-NW
Address range: 892 to 1199
Boren Ave
Length: 0.09 miles
Direction: SE-NW
Address range: 1600 to 1699
Direction: SE-NW
Address range: 1600 to 1699
Westlake Ave
Length: 0.08 miles
Direction: N-S
Address range: 1500 to 1609
Direction: N-S
Address range: 1500 to 1609
Times Ct
Length: 0.06 miles
Direction: SE-NW
Address range: 1600 to 1699
Direction: SE-NW
Address range: 1600 to 1699
Cobb Aly
Length: 0.03 miles
Direction: SE-NW
Direction: SE-NW
Terry Ave
Length: 0.02 miles
Direction: SE-NW
Direction: SE-NW