Camelback Park neighborhood in Glendale, Arizona (AZ), 85305 detailed profile
Settings
X


Business Search - 14 Million verified businesses
Area: 0.122 square miles
Population: 1,946
Population density:
| Camelback Park: | 15,968 people per square mile |
| Glendale: | 4,528 people per square mile |

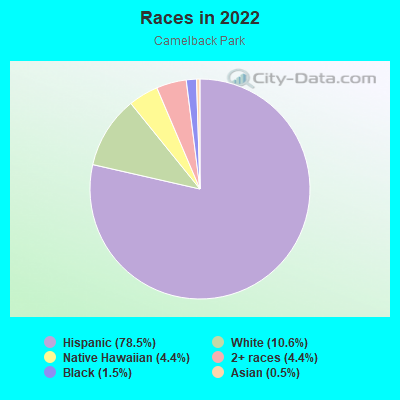
- 1,67478.5%Hispanic or Latino
- 22710.6%White
- 944.4%Native Hawaiian and Other
Pacific Islander - 944.4%Two or more races
- 331.5%Black
- 110.5%Asian
Median household income in 2022:
| Camelback Park: | $71,827 |
| Glendale: | $72,411 |
Distribution of median household income
![Distribution of median household income]()
- 5Less than $10,000
- 6$10,000 to $19,999
- 35$20,000 to $29,999
- 73$30,000 to $39,999
- 54$40,000 to $49,999
- 44$50,000 to $59,999
- 86$60,000 to $74,999
- 106$75,000 to $99,999
- 31$100,000 to $124,999
- 67$125,000 to $149,999
- 26$150,000 to $199,999
- 64$200,000 or more

Distribution of owner-occupied house/condo value
![Distribution of owner-occupied house/condo value]()
- 55Less than $50,000
- 12$50,000 to $99,999
- 59$100,000 to $149,999
- 77$150,000 to $199,999
- 109$200,000 to $249,999
- 37$250,000 to $299,999
- 61$300,000 to $399,999
- 80$400,000 to $499,999
- 13$500,000 to $749,999
- 24$750,000 to $999,999

Distribution of rent paid by renters
![Distribution of rent paid by renters]()
- 3$300 to $399
- 9$400 to $499
- 10$500 to $599
- 20$700 to $799
- 50$800 to $899
- 16$900 to $999
- 14$1,000 to $1,249
- 13$1,250 to $1,499
- 4$1,500 to $1,999

Median rent in 2022:
| Camelback Park: | $854 |
| Glendale: | $1,244 |
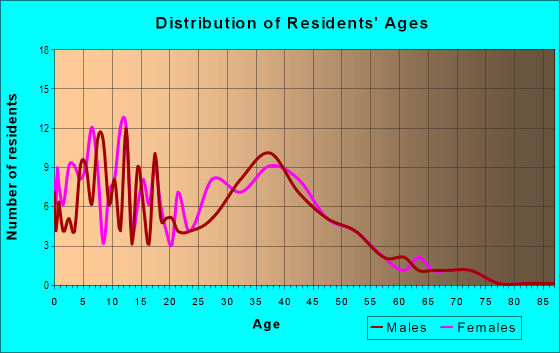
| Males: | 996 |
| Females: | 950 |
Males:
| This neighborhood: | 35.0 years |
| Whole city: | 32.1 years |
| This neighborhood: | 36.9 years |
| Whole city: | 35.7 years |
Average household size:
| Camelback Park: | 3.5 people |
| Glendale: | 2.8 people |
Percentage of family households:
| Camelback Park: | 62.3% |
| Glendale: | 49.0% |
| Here: | 70.2% |
| Glendale: | 47.7% |
Percentage of married-couple families with children (among all households):
| Camelback Park: | 24.0% |
| Glendale: | 24.1% |
Percentage of single-mother households (among all households):
| Camelback Park: | 4.5% |
| Glendale: | 8.0% |
Percentage of never married males 15 years old and over:
Percentage of never married females 15 years old and over:
| Camelback Park: | 17.0% |
| Glendale: | 20.8% |
Percentage of never married females 15 years old and over:
| Camelback Park: | 20.1% |
| city: | 17.2% |
Percentage of people born in this state:
Percentage of people born in another U.S. state:
Percentage of native residents but born outside the U.S.:
Percentage of foreign born residents:
| Here: | 40.6% |
| Glendale: | 42.8% |
Percentage of people born in another U.S. state:
| Camelback Park: | 28.9% |
| Glendale: | 38.1% |
Percentage of native residents but born outside the U.S.:
| Here: | 1.1% |
| city: | 0.7% |
Percentage of foreign born residents:
| Here: | 29.5% |
| Glendale: | 18.5% |
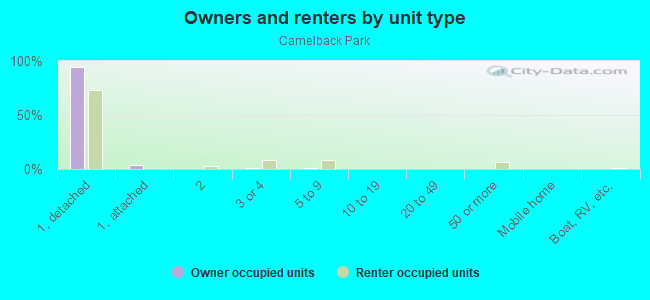
Owner-occupied
Renter-occupied

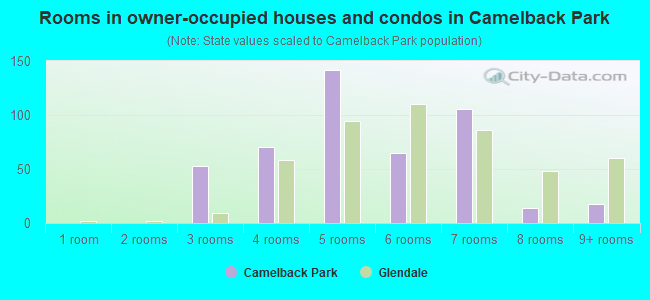
- Rooms in owner-occupied houses and condos in Camelback Park
- 01 room
- 02 rooms
- 533 rooms
- 704 rooms
- 1425 rooms
- 656 rooms
- 1067 rooms
- 148 rooms
- 189+ rooms
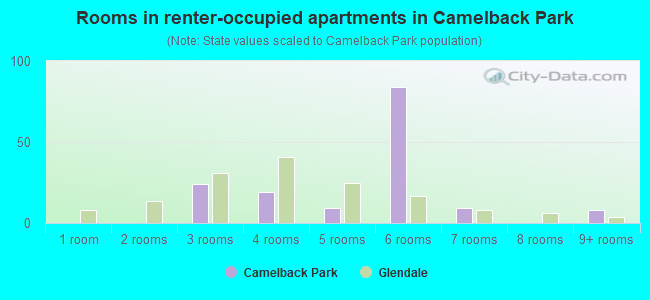
- Rooms in renter-occupied apartments in Camelback Park
- 01 room
- 02 rooms
- 243 rooms
- 194 rooms
- 95 rooms
- 846 rooms
- 97 rooms
- 08 rooms
- 89+ rooms
Owner-occupied
Renter-occupied
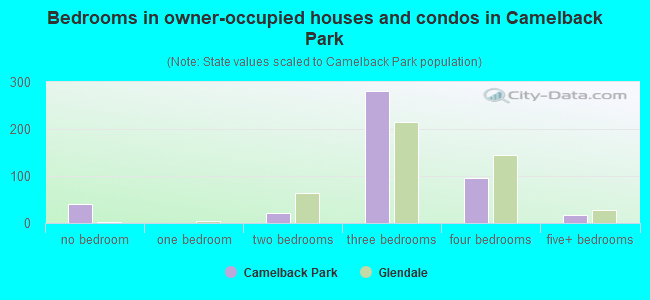
- Bedrooms in owner-occupied houses and condos in Camelback Park
- 41no bedroom
- 01 bedroom
- 212 bedrooms
- 2813 bedrooms
- 964 bedrooms
- 185+ bedrooms
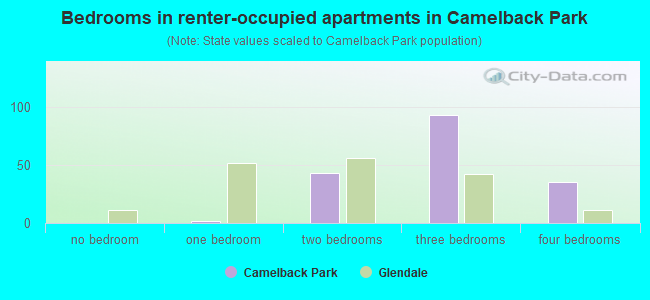
- Bedrooms in renter-occupied apartments in Camelback Park
- 0no bedroom
- 21 bedroom
- 432 bedrooms
- 933 bedrooms
- 354 bedrooms
- 05+ bedrooms
Average number of cars or other vehicles available in houses/condos:
Average number of cars or other vehicles available in apartments:
| This neighborhood: | 2.1 |
| Glendale: | 2.3 |
Average number of cars or other vehicles available in apartments:
| Here: | 2.8 |
| city: | 1.6 |
Percentage of units with a mortgage:
| Camelback Park: | 76.4% |
| Glendale: | 65.9% |
Average estimated value of detached houses in 2022 (100.0% of all units):
| Camelback Park: | $274,047 |
| Glendale: | $364,476 |
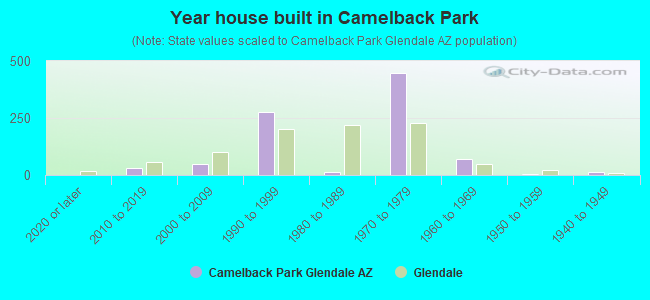
- Year house built in Camelback Park
- 02020 or later
- 292010 to 2019
- 472000 to 2009
- 2771990 to 1999
- 121980 to 1989
- 4491970 to 1979
- 711960 to 1969
- 51950 to 1959
- 141940 to 1949
- 21939 or earlier
City-data.com crime index for city in 2020 (higher means more crime):
| City: | 268.2 |
| U.S. average: | 219.5 |
Travel time to work (commute)
![Travel time to work (commute)]()
- 8Less than 5 minutes
- 245 to 9 minutes
- 12210 to 14 minutes
- 14615 to 19 minutes
- 10020 to 24 minutes
- 4925 to 29 minutes
- 10830 to 34 minutes
- 5935 to 39 minutes
- 3340 to 44 minutes
- 5145 to 59 minutes
- 12560 to 89 minutes
- 2790 or more minutes

Means of transportation to work
![Means of transportation to work]()
- 77.5%625Drove a car alone
- 16.3%131Carpooled
- 0.5%4Taxi
- 0.2%2Motorcycle
- 0.4%3Bicycle
- 0.2%2Walked
- 1.2%10Other means
- 6.0%48Worked at home

Time leaving home to go to work
![Time leaving home to go to work]()
- 18112:00 a.m. to 4:59 a.m.
- 835:00 a.m. to 5:29 a.m.
- 505:30 a.m. to 5:59 a.m.
- 796:00 a.m. to 6:29 a.m.
- 426:30 a.m. to 6:59 a.m.
- 1857:00 a.m. to 7:29 a.m.
- 117:30 a.m. to 7:59 a.m.
- 1268:00 a.m. to 8:29 a.m.
- 319:00 a.m. to 9:59 a.m.
- 410:00 a.m. to 10:59 a.m.
- 511:00 a.m. to 11:59 a.m.
- 3112:00 p.m. to 3:59 p.m.
- 304:00 p.m. to 11:59 p.m.

Occupations of males:
- Percentage of males in management occupations (except farmers):
Here: 5.1% city: 8.8%
- Percentage of males in computer and mathematical occupations:
Here: 2.1% city: 3.7%
- Percentage of males in architecture and engineering occupations:
Here: 45.7% city: 2.2%
- Percentage of males in education, training, and library occupations:
Here: 38.2% city: 2.5%
- Percentage of males in healthcare practitioners and technical occupations:
Here: 36.5% city: 3.6%
- Percentage of males in service occupations:
Here: 2.6% city: 15.4%
- Percentage of males in sales and office occupations:
Here: 41.5% city: 17.3%
- Percentage of males in construction, extraction, and maintenance occupations:
Here: 13.2% city: 11.6%
- Percentage of males in production occupations:
Here: 19.1% city: 6.8%
- Percentage of males in transportation occupations:
Here: 6.6% city: 7.3%
- Percentage of males in material moving occupations:
Here: 3.0% city: 6.7%
Occupations of females:
- Percentage of females in management occupations (except farmers):
Here: 2.4% city: 8.1%
- Percentage of females in business and financial operations occupations:
Here: 754.2% city: 6.3%
- Percentage of females in computer and mathematical occupations:
Here: 92.9% city: 1.3%
- Percentage of females in architecture and engineering occupations:
Here: 1.8% city: 0.3%
- Percentage of females in legal occupations:
Here: 7.5% city: 0.8%
- Percentage of females in education, training, and library occupations:
Here: 2.3% city: 7.8%
- Percentage of females in arts, design, entertainment, sports, and media occupations:
Here: 155.4% city: 1.2%
- Percentage of females in healthcare practitioners and technical occupations:
Here: 9.4% city: 7.6%
- Percentage of females in service occupations:
Here: 30.3% city: 22.9%
- Percentage of females in sales and office occupations:
Here: 50.4% city: 31.4%
- Percentage of females in transportation occupations:
Here: 234.6% city: 1.5%
- Percentage of females in material moving occupations:
Here: 76.0% city: 3.5%
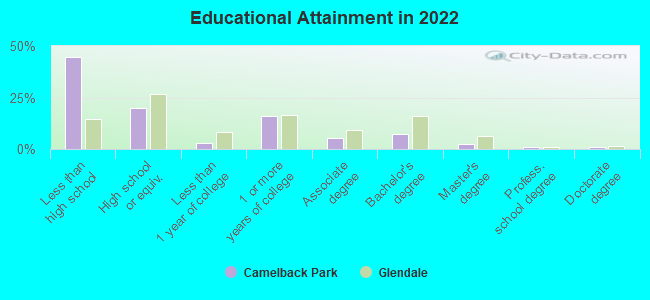
Education in this neighborhood (subdivision or community):
- Percentage of people 3 years and older in K-12 schools:
Camelback Park: 24.3% Glendale: 17.4%
- Percentage of people 3 years and older in undergraduate colleges:
Camelback Park: 8.3% Glendale: 5.4%
- Percentage of people 3 years and older in grad. or professional schools:
Camelback Park: 0.8% Glendale: 1.5%
- Percentage of students K-12 enrolled in private schools:
Camelback Park: 2.8% Glendale: 8.6%
Percentage of population below poverty level:
| Camelback Park: | 7.1% |
| Glendale: | 15.0% |
Median year owner moved in (as recorded in 2022):
Median year renter moved in (as recorded in 2022):
| Camelback Park: | 2010 |
| Glendale: | 2012 |
Median year renter moved in (as recorded in 2022):
| Camelback Park: | 2015 |
| Glendale: | 2020 |
Percentage of married-couple families with both working:
| Camelback Park: | 53.9% |
| Glendale: | 55.7% |
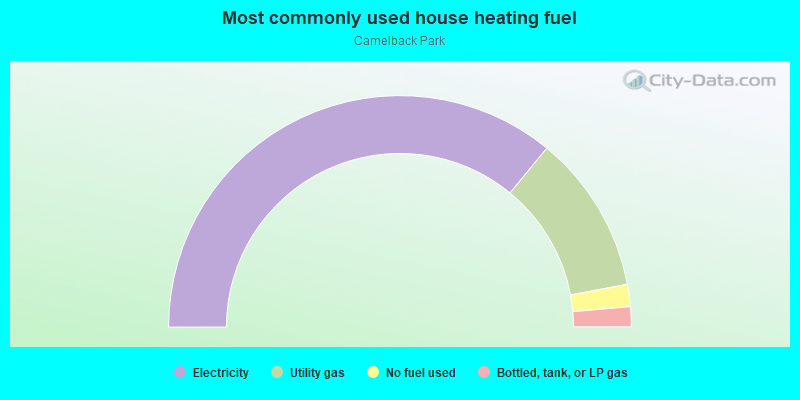
- 71.9%Electricity
- 22.2%Utility gas
- 3.1%No fuel used
- 2.8%Bottled, tank, or LP gas
Roads and streets:
N 85th Ave
Length: 0.45 miles
Direction: N-S
Address range: 5000 to 5449
Direction: N-S
Address range: 5000 to 5449
W Medlock Dr
Length: 0.27 miles
Direction: E-W
Address range: 8500 to 8699
Direction: E-W
Address range: 8500 to 8699
W Camelback Rd
Length: 0.27 miles
Direction: E-W
Direction: E-W
W Pasadena Ave
Length: 0.27 miles
Direction: E-W
Address range: 8500 to 8699
Direction: E-W
Address range: 8500 to 8699
N 86th Dr
Length: 0.24 miles
Directions: N-S, SE-NW, SW-NE
Address range: 5000 to 5499
Directions: N-S, SE-NW, SW-NE
Address range: 5000 to 5499
W Oregon Ave
Length: 0.22 miles
Direction: E-W
Address range: 8500 to 8699
Direction: E-W
Address range: 8500 to 8699
W Windsor Blvd
Length: 0.20 miles
Directions: E-W, SW-NE
Address range: 8500 to 8699
Directions: E-W, SW-NE
Address range: 8500 to 8699
N 87th Ave
Length: 0.19 miles
Directions: N-S, SW-NE
Address range: 5000 to 5099
Directions: N-S, SW-NE
Address range: 5000 to 5099
W Denton Ave
Length: 0.19 miles
Directions: E-W, SW-NE
Address range: 8500 to 8699
Directions: E-W, SW-NE
Address range: 8500 to 8699
W Georgia Ave
Length: 0.18 miles
Direction: E-W
Address range: 8500 to 8699
Direction: E-W
Address range: 8500 to 8699
W Colter St
Length: 0.17 miles
Directions: E-W, SW-NE
Address range: 8500 to 8699
Directions: E-W, SW-NE
Address range: 8500 to 8699
N 85th Dr
Length: 0.12 miles
Directions: N-S, SE-NW, SW-NE
Address range: 5000 to 5299
Directions: N-S, SE-NW, SW-NE
Address range: 5000 to 5299
N 86th Ave
Length: 0.10 miles
Directions: N-S, SE-NW
Address range: 5000 to 5299
Directions: N-S, SE-NW
Address range: 5000 to 5299
W Orange Dr
Length: 0.10 miles
Direction: E-W
Address range: 8500 to 8699
Direction: E-W
Address range: 8500 to 8699
W 86th Dr
Length: 0.02 miles
Direction: SE-NW
Direction: SE-NW