Canal Waterfront neighborhood in San Rafael, California (CA), 94901 detailed profile
Settings
X


Business Search - 14 Million verified businesses
Area: 0.167 square miles
Population: 432
Population density:
| Canal Waterfront: | 2,587 people per square mile |
| San Rafael: | 3,670 people per square mile |

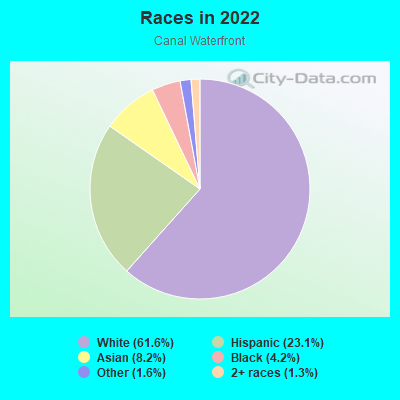
- 27861.6%White
- 10423.1%Hispanic or Latino
- 378.2%Asian
- 194.2%Black
- 71.6%Some other race
- 61.3%Two or more races
Median household income in 2022:
| Canal Waterfront: | $89,958 |
| San Rafael: | $113,839 |
Distribution of median household income
![Distribution of median household income]()
- 9Less than $10,000
- 38$10,000 to $19,999
- 11$20,000 to $29,999
- 10$30,000 to $39,999
- 25$40,000 to $49,999
- 53$50,000 to $59,999
- 14$60,000 to $74,999
- 22$75,000 to $99,999
- 8$100,000 to $124,999
- 8$125,000 to $149,999
- 19$150,000 to $199,999
- 53$200,000 or more

Distribution of owner-occupied house/condo value
![Distribution of owner-occupied house/condo value]()
- 15Less than $50,000
- 13$100,000 to $149,999
- 22$300,000 to $399,999
- 13$400,000 to $499,999
- 15$500,000 to $749,999
- 28$750,000 to $999,999
- 50$1,000,000 or more

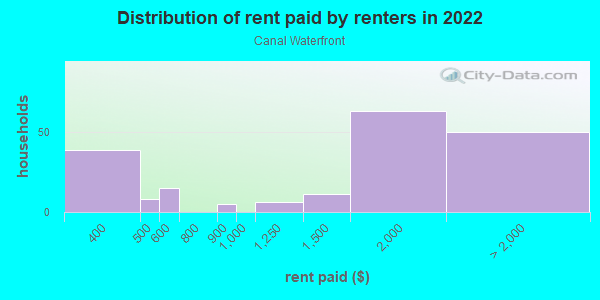
Distribution of rent paid by renters
![Distribution of rent paid by renters]()
- 39$300 to $399
- 8$400 to $499
- 15$500 to $599
- 5$800 to $899
- 6$1,000 to $1,249
- 11$1,250 to $1,499
- 63$1,500 to $1,999
- 50$2,000 or more
Median rent in 2022:
| Canal Waterfront: | $1,854 |
| San Rafael: | $2,001 |
| Males: | 223 |
| Females: | 208 |
Males:
| This neighborhood: | 46.5 years |
| Whole city: | 40.6 years |
| This neighborhood: | 45.6 years |
| Whole city: | 47.6 years |
Average household size:
| Canal Waterfront: | 7.3 people |
| San Rafael: | 2.5 people |
Percentage of family households:
| Canal Waterfront: | 20.7% |
| San Rafael: | 41.8% |
| Here: | 30.4% |
| San Rafael: | 46.3% |
Percentage of married-couple families with children (among all households):
| Canal Waterfront: | 33.6% |
| San Rafael: | 30.4% |
Percentage of single-mother households (among all households):
| Canal Waterfront: | 22.0% |
| San Rafael: | 5.4% |
Percentage of never married males 15 years old and over:
Percentage of never married females 15 years old and over:
| Canal Waterfront: | 9.8% |
| San Rafael: | 17.7% |
Percentage of never married females 15 years old and over:
| Canal Waterfront: | 26.3% |
| city: | 16.3% |
Percentage of people that speak English not well or not at all:
| Canal Waterfront: | 5.1% |
| San Rafael: | 10.4% |
Percentage of people born in this state:
Percentage of people born in another U.S. state:
Percentage of native residents but born outside the U.S.:
Percentage of foreign born residents:
| Here: | 53.6% |
| San Rafael: | 47.7% |
Percentage of people born in another U.S. state:
| Canal Waterfront: | 30.5% |
| San Rafael: | 23.8% |
Percentage of native residents but born outside the U.S.:
| Here: | 1.6% |
| city: | 1.7% |
Percentage of foreign born residents:
| Here: | 14.3% |
| San Rafael: | 26.8% |
Owner-occupied
Renter-occupied

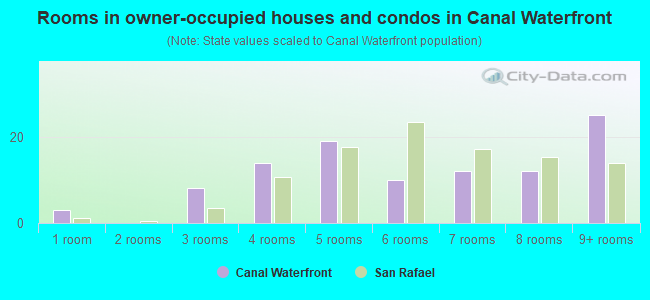
- Rooms in owner-occupied houses and condos in Canal Waterfront
- 31 room
- 02 rooms
- 83 rooms
- 144 rooms
- 195 rooms
- 106 rooms
- 127 rooms
- 128 rooms
- 259+ rooms
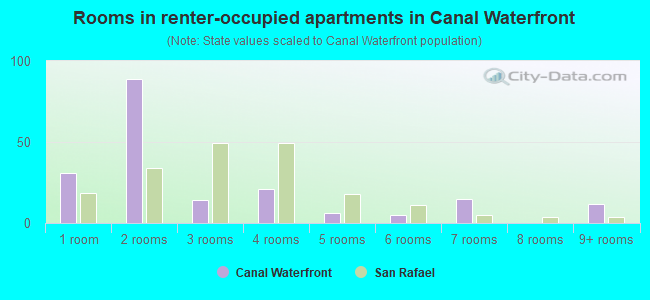
- Rooms in renter-occupied apartments in Canal Waterfront
- 311 room
- 892 rooms
- 143 rooms
- 214 rooms
- 65 rooms
- 56 rooms
- 157 rooms
- 08 rooms
- 129+ rooms
Owner-occupied
Renter-occupied
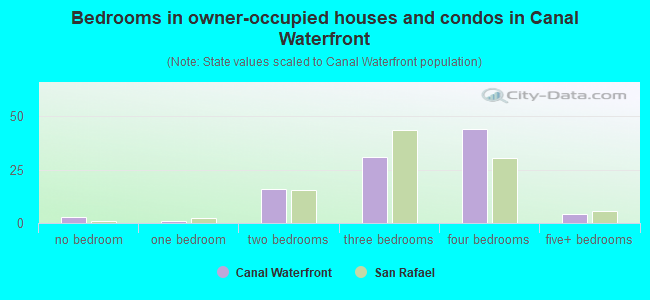
- Bedrooms in owner-occupied houses and condos in Canal Waterfront
- 3no bedroom
- 11 bedroom
- 162 bedrooms
- 313 bedrooms
- 444 bedrooms
- 45+ bedrooms
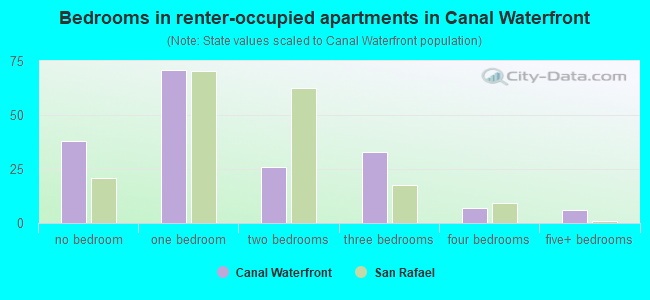
- Bedrooms in renter-occupied apartments in Canal Waterfront
- 38no bedroom
- 711 bedroom
- 262 bedrooms
- 333 bedrooms
- 74 bedrooms
- 65+ bedrooms
Average number of cars or other vehicles available in houses/condos:
Average number of cars or other vehicles available in apartments:
| This neighborhood: | 2.1 |
| San Rafael: | 2.0 |
Average number of cars or other vehicles available in apartments:
| Here: | 1.3 |
| city: | 1.4 |
Percentage of units with a mortgage:
| Canal Waterfront: | 76.5% |
| San Rafael: | 66.6% |
Average estimated value of detached houses in 2022 (47.1% of all units):
| Canal Waterfront: | $1,030,860 |
| California: | $988,808 |
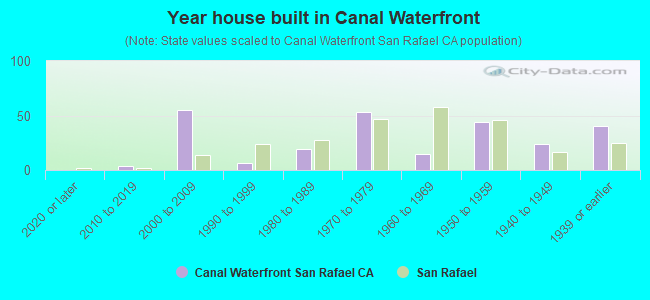
- Year house built in Canal Waterfront
- 02020 or later
- 42010 to 2019
- 552000 to 2009
- 61990 to 1999
- 191980 to 1989
- 531970 to 1979
- 151960 to 1969
- 441950 to 1959
- 241940 to 1949
- 401939 or earlier
City-data.com crime index for city in 2020 (higher means more crime):
| City: | 294.6 |
| U.S. average: | 219.5 |
Travel time to work (commute)
![Travel time to work (commute)]()
- 12Less than 5 minutes
- 275 to 9 minutes
- 4910 to 14 minutes
- 6115 to 19 minutes
- 3320 to 24 minutes
- 1525 to 29 minutes
- 5230 to 34 minutes
- 1135 to 39 minutes
- 2140 to 44 minutes
- 1845 to 59 minutes
- 4960 to 89 minutes
- 1290 or more minutes

Means of transportation to work
![Means of transportation to work]()
- 52.9%119Drove a car alone
- 8.9%20Carpooled
- 4.4%10Bus
- 8.4%19Ferryboat
- 1.3%3Motorcycle
- 0.9%2Bicycle
- 4.0%9Walked
- 23.1%52Worked at home

Time leaving home to go to work
![Time leaving home to go to work]()
- 912:00 a.m. to 4:59 a.m.
- 105:00 a.m. to 5:29 a.m.
- 65:30 a.m. to 5:59 a.m.
- 406:00 a.m. to 6:29 a.m.
- 246:30 a.m. to 6:59 a.m.
- 597:00 a.m. to 7:29 a.m.
- 667:30 a.m. to 7:59 a.m.
- 488:00 a.m. to 8:29 a.m.
- 388:30 a.m. to 8:59 a.m.
- 379:00 a.m. to 9:59 a.m.
- 1110:00 a.m. to 10:59 a.m.
- 811:00 a.m. to 11:59 a.m.
- 1612:00 p.m. to 3:59 p.m.
- 74:00 p.m. to 11:59 p.m.

Occupations of males:
- Percentage of males in management occupations (except farmers):
Here: 11.5% city: 14.6%
- Percentage of males in business and financial operations occupations:
Here: 2.7% city: 5.8%
- Percentage of males in computer and mathematical occupations:
Here: 15.0% city: 6.2%
- Percentage of males in legal occupations:
Here: 5.1% city: 1.0%
- Percentage of males in arts, design, entertainment, sports, and media occupations:
Here: 10.2% city: 5.0%
- Percentage of males in healthcare practitioners and technical occupations:
Here: 1.3% city: 2.9%
- Percentage of males in service occupations:
Here: 14.7% city: 14.5%
- Percentage of males in sales and office occupations:
Here: 18.4% city: 17.3%
- Percentage of males in farming, fishing, and forestry occupations:
Here: 3.4% city: 1.3%
- Percentage of males in construction, extraction, and maintenance occupations:
Here: 8.7% city: 13.3%
- Percentage of males in transportation occupations:
Here: 11.6% city: 3.7%
Occupations of females:
- Percentage of females in management occupations (except farmers):
Here: 14.0% city: 13.8%
- Percentage of females in business and financial operations occupations:
Here: 5.1% city: 5.9%
- Percentage of females in computer and mathematical occupations:
Here: 2.4% city: 2.0%
- Percentage of females in life, physical, and social science occupations:
Here: 2.0% city: 1.5%
- Percentage of females in legal occupations:
Here: 1.5% city: 2.2%
- Percentage of females in education, training, and library occupations:
Here: 1.4% city: 8.1%
- Percentage of females in arts, design, entertainment, sports, and media occupations:
Here: 7.0% city: 3.7%
- Percentage of females in healthcare practitioners and technical occupations:
Here: 1.1% city: 7.0%
- Percentage of females in service occupations:
Here: 10.1% city: 21.9%
- Percentage of females in sales and office occupations:
Here: 56.5% city: 25.2%
- Percentage of females in transportation occupations:
Here: 3.6% city: 1.3%
Education in this neighborhood (subdivision or community):
- Percentage of people 3 years and older in K-12 schools:
Canal Waterfront: 26.4% San Rafael: 15.4%
- Percentage of people 3 years and older in undergraduate colleges:
Canal Waterfront: 8.7% San Rafael: 6.4%
- Percentage of people 3 years and older in grad. or professional schools:
Canal Waterfront: 14.4% San Rafael: 1.2%
- Percentage of students K-12 enrolled in private schools:
Canal Waterfront: 23.2% San Rafael: 10.7%
Percentage of population below poverty level:
| Canal Waterfront: | 9.1% |
| San Rafael: | 8.9% |
Median year owner moved in (as recorded in 2022):
Median year renter moved in (as recorded in 2022):
| Canal Waterfront: | 2001 |
| San Rafael: | 2005 |
Median year renter moved in (as recorded in 2022):
| Canal Waterfront: | 2018 |
| San Rafael: | 2015 |
Percentage of married-couple families with both working:
| Canal Waterfront: | 114.1% |
| San Rafael: | 75.7% |
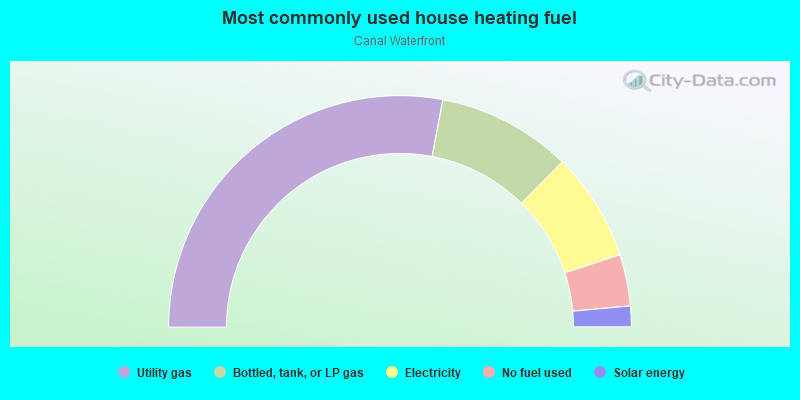
- 56.0%Utility gas
- 18.8%Bottled, tank, or LP gas
- 15.2%Electricity
- 7.2%No fuel used
- 2.9%Solar energy
Limited-access highways (interstate or state) in this neighborhood:
Redwood Hwy (US Hwy 101)
Length: 0.31 miles
Directions: N-S, SE-NW
Directions: N-S, SE-NW
Roads and streets:
Francisco Blvd
Length: 0.61 miles
Directions: N-S, SE-NW
Address range: 300 to 499
Directions: N-S, SE-NW
Address range: 300 to 499
3rd St
Length: 0.53 miles
Directions: E-W, SE-NW
Address range: 1 to 399
Directions: E-W, SE-NW
Address range: 1 to 399
Hwy 101 (S Hwy 101)
Length: 0.41 miles
Directions: N-S, SE-NW
Directions: N-S, SE-NW
2nd St
Length: 0.33 miles
Directions: E-W, SW-NE
Address range: 432 to 699
Directions: E-W, SW-NE
Address range: 432 to 699
Bay St
Length: 0.19 miles
Direction: N-S
Address range: 1 to 199
Direction: N-S
Address range: 1 to 199
Mooring Rd
Length: 0.18 miles
Directions: E-W, SE-NW
Address range: 1 to 99
Directions: E-W, SE-NW
Address range: 1 to 99
Grand Ave
Length: 0.13 miles
Direction: N-S
Address range: 600 to 799
Direction: N-S
Address range: 600 to 799
Francisco Blvd E
Length: 0.11 miles
Directions: E-W, N-S, SE-NW
Directions: E-W, N-S, SE-NW
Point San Pedro Rd
Length: 0.10 miles
Direction: E-W
Address range: 1 to 98
Direction: E-W
Address range: 1 to 98
Yacht Club Dr
Length: 0.09 miles
Direction: N-S
Direction: N-S
Francisco Blvd W
Length: 0.07 miles
Direction: SE-NW
Direction: SE-NW
Beach Park Rd
Length: 0.06 miles
Direction: N-S
Direction: N-S
Irwin St
Length: 0.03 miles
Direction: N-S
Address range: 700 to 799
Direction: N-S
Address range: 700 to 799
Railroad features:
Northwestern Pacific RR
Length: 0.06 miles
Direction: SE-NW
Direction: SE-NW
Other features:
San Rafael Crk
Length: 0.17 miles
Direction: E-W
Direction: E-W