Caprock neighborhood in Lubbock, Texas (TX), 79413 detailed profile
Settings
X


Business Search - 14 Million verified businesses
Area: 1.333 square miles
Population: 6,076
Population density:
| Caprock: | 4,559 people per square mile |
| Lubbock: | 2,299 people per square mile |

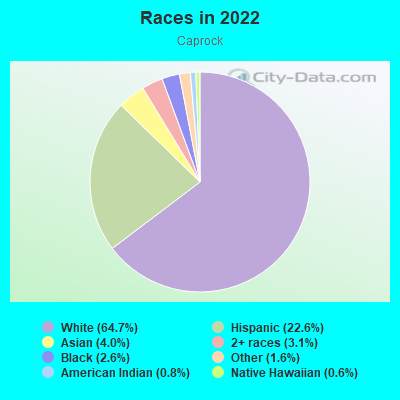
- 4,03064.7%White
- 1,40722.6%Hispanic or Latino
- 2494.0%Asian
- 1913.1%Two or more races
- 1602.6%Black
- 1011.6%Some other race
- 500.8%American Indian
- 390.6%Native Hawaiian and Other
Pacific Islander
Median household income in 2022:
| Caprock: | $68,135 |
| Lubbock: | $56,910 |
Distribution of median household income
![Distribution of median household income]()
- 31Less than $10,000
- 294$10,000 to $19,999
- 180$20,000 to $29,999
- 113$30,000 to $39,999
- 383$40,000 to $49,999
- 125$50,000 to $59,999
- 272$60,000 to $74,999
- 269$75,000 to $99,999
- 149$100,000 to $124,999
- 457$125,000 to $149,999
- 179$150,000 to $199,999
- 370$200,000 or more

Distribution of owner-occupied house/condo value
![Distribution of owner-occupied house/condo value]()
- 81Less than $50,000
- 86$50,000 to $99,999
- 133$100,000 to $149,999
- 449$150,000 to $199,999
- 627$200,000 to $249,999
- 427$250,000 to $299,999
- 42$300,000 to $399,999
- 176$400,000 to $499,999
- 12$500,000 to $749,999

Distribution of rent paid by renters
![Distribution of rent paid by renters]()
- 19$400 to $499
- 72$500 to $599
- 92$600 to $699
- 201$700 to $799
- 167$800 to $899
- 67$900 to $999
- 136$1,000 to $1,249
- 136$1,250 to $1,499
- 116$2,000 or more

Median rent in 2022:
| Caprock: | $845 |
| Lubbock: | $882 |
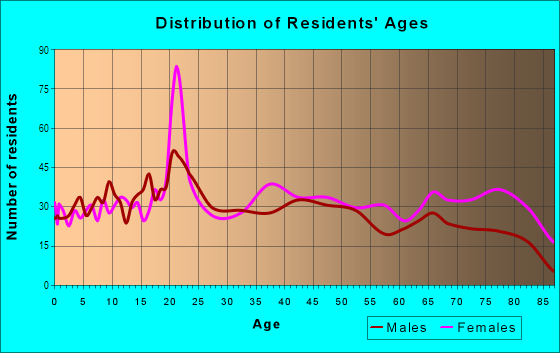
| Males: | 2,743 |
| Females: | 3,333 |
Males:
| This neighborhood: | 37.3 years |
| Whole city: | 29.4 years |
| This neighborhood: | 42.3 years |
| Whole city: | 32.2 years |
Average household size:
| Caprock: | 2.3 people |
| Lubbock: | 2.3 people |
Percentage of family households:
| Caprock: | 39.9% |
| Lubbock: | 44.1% |
| Here: | 48.5% |
| Lubbock: | 38.5% |
Percentage of married-couple families with children (among all households):
| Caprock: | 39.6% |
| Lubbock: | 26.4% |
Percentage of single-mother households (among all households):
| Caprock: | 4.8% |
| Lubbock: | 12.1% |
Percentage of never married males 15 years old and over:
Percentage of never married females 15 years old and over:
| Caprock: | 16.6% |
| Lubbock: | 23.0% |
Percentage of never married females 15 years old and over:
| Caprock: | 13.2% |
| city: | 19.6% |
Percentage of people that speak English not well or not at all:
| Caprock: | 0.0% |
| Lubbock: | 1.7% |
Percentage of people born in this state:
Percentage of people born in another U.S. state:
Percentage of native residents but born outside the U.S.:
Percentage of foreign born residents:
| Here: | 67.8% |
| Lubbock: | 72.0% |
Percentage of people born in another U.S. state:
| Caprock: | 20.0% |
| Lubbock: | 20.4% |
Percentage of native residents but born outside the U.S.:
| Here: | 0.8% |
| city: | 0.9% |
Percentage of foreign born residents:
| Here: | 11.3% |
| Lubbock: | 6.8% |
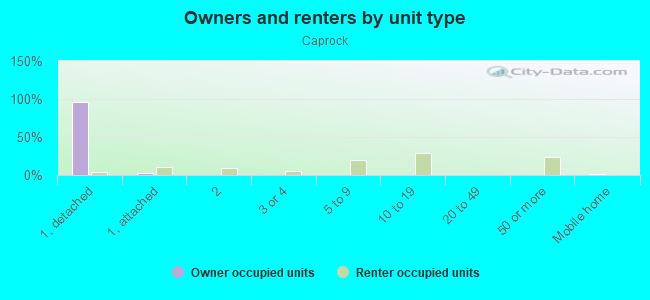
Owner-occupied
Renter-occupied

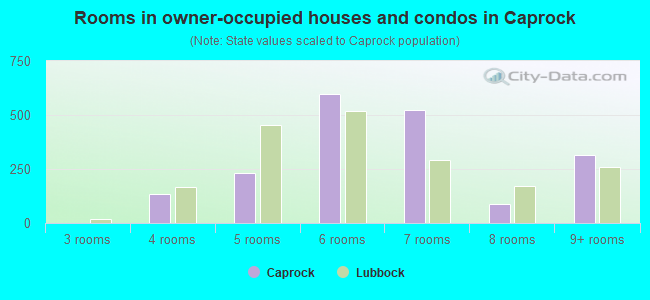
- Rooms in owner-occupied houses and condos in Caprock
- 01 room
- 02 rooms
- 03 rooms
- 1334 rooms
- 2315 rooms
- 5956 rooms
- 5257 rooms
- 868 rooms
- 3179+ rooms
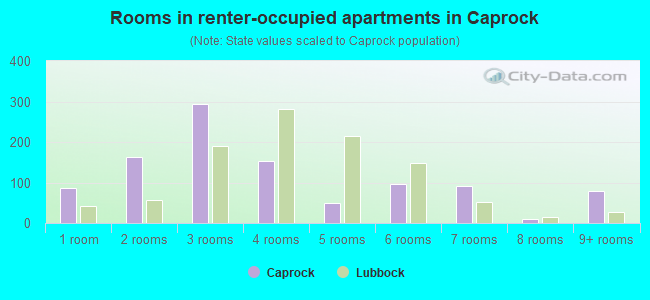
- Rooms in renter-occupied apartments in Caprock
- 871 room
- 1632 rooms
- 2943 rooms
- 1544 rooms
- 495 rooms
- 976 rooms
- 927 rooms
- 118 rooms
- 789+ rooms
Owner-occupied
Renter-occupied
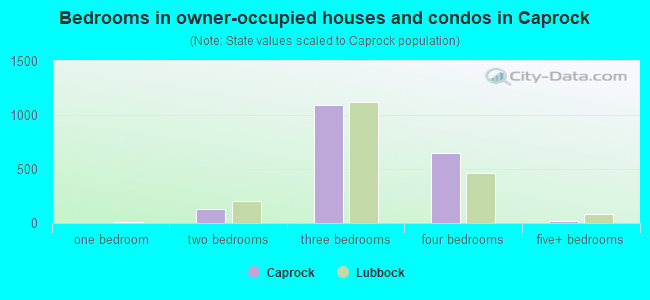
- Bedrooms in owner-occupied houses and condos in Caprock
- 0no bedroom
- 01 bedroom
- 1332 bedrooms
- 1,0893 bedrooms
- 6514 bedrooms
- 165+ bedrooms
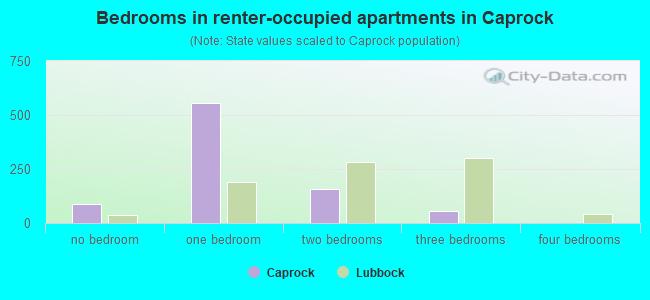
- Bedrooms in renter-occupied apartments in Caprock
- 87no bedroom
- 5561 bedroom
- 1592 bedrooms
- 563 bedrooms
- 04 bedrooms
- 05+ bedrooms
Average number of cars or other vehicles available in houses/condos:
Average number of cars or other vehicles available in apartments:
| This neighborhood: | 2.1 |
| Lubbock: | 2.1 |
Average number of cars or other vehicles available in apartments:
| Here: | 1.2 |
| city: | 1.5 |
Percentage of units with a mortgage:
| Caprock: | 51.7% |
| Lubbock: | 59.6% |
Average estimated value of detached houses in 2022 (63.6% of all units):
| Caprock: | $155,720 |
| Texas: | $369,058 |
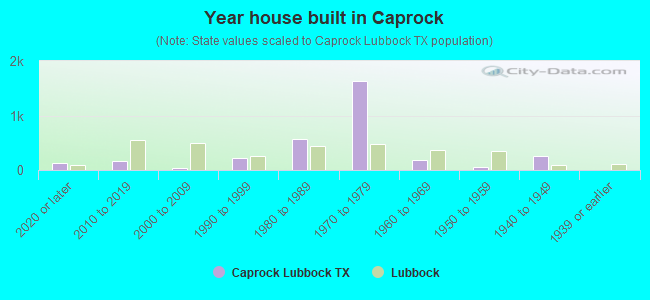
- Year house built in Caprock
- 1332020 or later
- 1632010 to 2019
- 342000 to 2009
- 2201990 to 1999
- 5761980 to 1989
- 1,6241970 to 1979
- 1901960 to 1969
- 551950 to 1959
- 2581940 to 1949
- 01939 or earlier
City-data.com crime index for city in 2020 (higher means more crime):
| City: | 513.0 |
| U.S. average: | 219.5 |
Travel time to work (commute)
![Travel time to work (commute)]()
- 65Less than 5 minutes
- 5575 to 9 minutes
- 1,05210 to 14 minutes
- 1,02915 to 19 minutes
- 23220 to 24 minutes
- 3225 to 29 minutes
- 29530 to 34 minutes
- 4645 to 59 minutes
- 2960 to 89 minutes
- 10890 or more minutes

Means of transportation to work
![Means of transportation to work]()
- 72.2%2,359Drove a car alone
- 20.9%681Carpooled
- 2.7%87Bus
- 0.9%29Bicycle
- 0.9%30Walked
- 1.6%51Other means
- 4.3%141Worked at home

Time leaving home to go to work
![Time leaving home to go to work]()
- 9812:00 a.m. to 4:59 a.m.
- 205:00 a.m. to 5:29 a.m.
- 1975:30 a.m. to 5:59 a.m.
- 806:00 a.m. to 6:29 a.m.
- 1856:30 a.m. to 6:59 a.m.
- 9017:00 a.m. to 7:29 a.m.
- 6967:30 a.m. to 7:59 a.m.
- 4508:00 a.m. to 8:29 a.m.
- 838:30 a.m. to 8:59 a.m.
- 969:00 a.m. to 9:59 a.m.
- 1910:00 a.m. to 10:59 a.m.
- 8711:00 a.m. to 11:59 a.m.
- 13112:00 p.m. to 3:59 p.m.
- 754:00 p.m. to 11:59 p.m.

Occupations of males:
- Percentage of males in management occupations (except farmers):
Here: 17.3% city: 11.3%
- Percentage of males in business and financial operations occupations:
Here: 1.0% city: 3.9%
- Percentage of males in computer and mathematical occupations:
Here: 6.6% city: 3.1%
- Percentage of males in life, physical, and social science occupations:
Here: 1.0% city: 0.9%
- Percentage of males in education, training, and library occupations:
Here: 4.8% city: 7.0%
- Percentage of males in arts, design, entertainment, sports, and media occupations:
Here: 1.1% city: 1.3%
- Percentage of males in healthcare practitioners and technical occupations:
Here: 1.9% city: 4.3%
- Percentage of males in service occupations:
Here: 25.0% city: 14.9%
- Percentage of males in sales and office occupations:
Here: 20.0% city: 16.9%
- Percentage of males in construction, extraction, and maintenance occupations:
Here: 8.9% city: 9.4%
- Percentage of males in production occupations:
Here: 9.6% city: 6.5%
Occupations of females:
- Percentage of females in management occupations (except farmers):
Here: 3.4% city: 8.7%
- Percentage of females in business and financial operations occupations:
Here: 1.4% city: 4.9%
- Percentage of females in computer and mathematical occupations:
Here: 2.5% city: 0.9%
- Percentage of females in community and social services occupations:
Here: 2.2% city: 3.0%
- Percentage of females in education, training, and library occupations:
Here: 23.6% city: 12.1%
- Percentage of females in arts, design, entertainment, sports, and media occupations:
Here: 5.9% city: 1.7%
- Percentage of females in healthcare practitioners and technical occupations:
Here: 19.7% city: 10.3%
- Percentage of females in service occupations:
Here: 11.4% city: 21.5%
- Percentage of females in sales and office occupations:
Here: 22.4% city: 28.9%
- Percentage of females in production occupations:
Here: 2.0% city: 1.8%
- Percentage of females in material moving occupations:
Here: 5.3% city: 2.5%
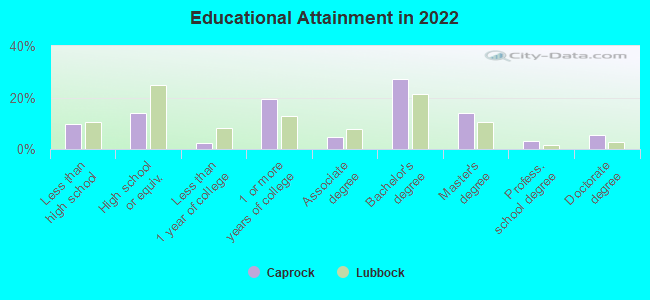
Education in this neighborhood (subdivision or community):
- Percentage of people 3 years and older in K-12 schools:
Caprock: 16.3% Lubbock: 16.4%
- Percentage of people 3 years and older in undergraduate colleges:
Caprock: 3.3% Lubbock: 12.1%
- Percentage of people 3 years and older in grad. or professional schools:
Caprock: 1.8% Lubbock: 3.1%
- Percentage of students K-12 enrolled in private schools:
Caprock: 34.3% Lubbock: 10.0%
Percentage of population below poverty level:
| Caprock: | 9.5% |
| Lubbock: | 19.3% |
Median year owner moved in (as recorded in 2022):
Median year renter moved in (as recorded in 2022):
| Caprock: | 2008 |
| Lubbock: | 2013 |
Median year renter moved in (as recorded in 2022):
| Caprock: | 2017 |
| Lubbock: | 2022 |
Percentage of married-couple families with both working:
| Caprock: | 62.8% |
| Lubbock: | 80.0% |
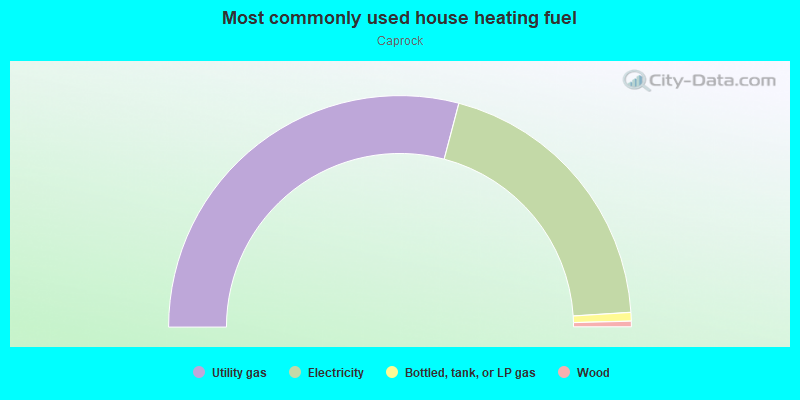
- 58.2%Utility gas
- 39.8%Electricity
- 1.2%Bottled, tank, or LP gas
- 0.8%Wood
Highways in this neighborhood:
State Loop 289
Length: 0.84 miles
Direction: E-W
Direction: E-W
Roads and streets:
Canton Ave
Length: 1.19 miles
Direction: N-S
Address range: 5200 to 7099
Direction: N-S
Address range: 5200 to 7099
Elgin Ave
Length: 1.13 miles
Direction: N-S
Address range: 5200 to 7199
Direction: N-S
Address range: 5200 to 7199
56th St
Length: 1.12 miles
Directions: E-W, SE-NW, SW-NE
Address range: 2500 to 3399
Directions: E-W, SE-NW, SW-NE
Address range: 2500 to 3399
69th St
Length: 1.06 miles
Directions: E-W, SW-NE
Address range: 2500 to 3216
Directions: E-W, SW-NE
Address range: 2500 to 3216
58th St
Length: 1.05 miles
Direction: E-W
Address range: 2510 to 3306
Direction: E-W
Address range: 2510 to 3306
66th St
Length: 1.05 miles
Direction: E-W
Address range: 2501 to 3209
Direction: E-W
Address range: 2501 to 3209
60th St
Length: 1.03 miles
Direction: E-W
Address range: 2500 to 3249
Direction: E-W
Address range: 2500 to 3249
57th St
Length: 1.03 miles
Directions: E-W, SE-NW
Address range: 2500 to 3299
Directions: E-W, SE-NW
Address range: 2500 to 3299
54th St
Length: 0.98 miles
Directions: E-W, SW-NE
Address range: 2500 to 3399
Directions: E-W, SW-NE
Address range: 2500 to 3399
68th St
Length: 0.97 miles
Directions: E-W, N-S
Address range: 2501 to 3218
Directions: E-W, N-S
Address range: 2501 to 3218
University Ave
Length: 0.93 miles
Directions: N-S, SW-NE
Address range: 6301 to 6599
Directions: N-S, SW-NE
Address range: 6301 to 6599
55th St
Length: 0.92 miles
Directions: E-W, SW-NE
Address range: 2510 to 3299
Directions: E-W, SW-NE
Address range: 2510 to 3299
59th St
Length: 0.83 miles
Direction: E-W
Address range: 2500 to 3249
Direction: E-W
Address range: 2500 to 3249
Gary Ave
Length: 0.81 miles
Directions: E-W, N-S, SE-NW, SW-NE
Address range: 5300 to 7099
Directions: E-W, N-S, SE-NW, SW-NE
Address range: 5300 to 7099
53rd St
Length: 0.81 miles
Directions: E-W, SE-NW, SW-NE
Address range: 2500 to 3323
Directions: E-W, SE-NW, SW-NE
Address range: 2500 to 3323
University Ard (University Ad)
Length: 0.76 miles
Directions: N-S, SE-NW, SW-NE
Directions: N-S, SE-NW, SW-NE
64th St
Length: 0.75 miles
Directions: E-W, SE-NW, SW-NE
Address range: 2501 to 3299
Directions: E-W, SE-NW, SW-NE
Address range: 2501 to 3299
Boston Ave
Length: 0.75 miles
Directions: N-S, SE-NW
Address range: 5200 to 6399
Directions: N-S, SE-NW
Address range: 5200 to 6399
67th St
Length: 0.73 miles
Direction: E-W
Address range: 2800 to 3299
Direction: E-W
Address range: 2800 to 3299
65th St
Length: 0.70 miles
Directions: E-W, SW-NE
Address range: 2600 to 3299
Directions: E-W, SW-NE
Address range: 2600 to 3299
62nd St
Length: 0.70 miles
Directions: E-W, SE-NW
Address range: 2500 to 3299
Directions: E-W, SE-NW
Address range: 2500 to 3299
61st St
Length: 0.62 miles
Directions: E-W, SE-NW
Address range: 2500 to 3299
Directions: E-W, SE-NW
Address range: 2500 to 3299
52nd St
Length: 0.59 miles
Direction: E-W
Address range: 2500 to 2899
Direction: E-W
Address range: 2500 to 2899
63rd St
Length: 0.58 miles
Direction: E-W
Address range: 2500 to 2899
Direction: E-W
Address range: 2500 to 2899
Hartford Ave
Length: 0.57 miles
Directions: N-S, SE-NW
Address range: 5600 to 7013
Directions: N-S, SE-NW
Address range: 5600 to 7013
Geneva Ave
Length: 0.49 miles
Directions: E-W, N-S, SE-NW, SW-NE
Address range: 5500 to 7099
Directions: E-W, N-S, SE-NW, SW-NE
Address range: 5500 to 7099
70th St
Length: 0.33 miles
Directions: E-W, SE-NW
Address range: 2500 to 2799
Directions: E-W, SE-NW
Address range: 2500 to 2799
Monterey Dr
Length: 0.21 miles
Direction: SE-NW
Address range: 5200 to 5499
Direction: SE-NW
Address range: 5200 to 5499
71st St
Length: 0.13 miles
Direction: E-W
Address range: 2513 to 2699
Direction: E-W
Address range: 2513 to 2699
Fremont Ave
Length: 0.12 miles
Direction: N-S
Address range: 6900 to 7099
Direction: N-S
Address range: 6900 to 7099
Flint Ave
Length: 0.12 miles
Direction: N-S
Address range: 5800 to 6999
Direction: N-S
Address range: 5800 to 6999
Detroit Ave
Length: 0.07 miles
Direction: N-S
Address range: 6800 to 6899
Direction: N-S
Address range: 6800 to 6899
Elkridge Ave
Length: 0.06 miles
Direction: N-S
Address range: 6900 to 6999
Direction: N-S
Address range: 6900 to 6999
University of (University Off)
Length: 0.04 miles
Direction: SW-NE
Direction: SW-NE