Cedar Park neighborhood in Philadelphia, Pennsylvania (PA), 19139, 19143 detailed profile
Settings
X

Business Search - 14 Million verified businesses
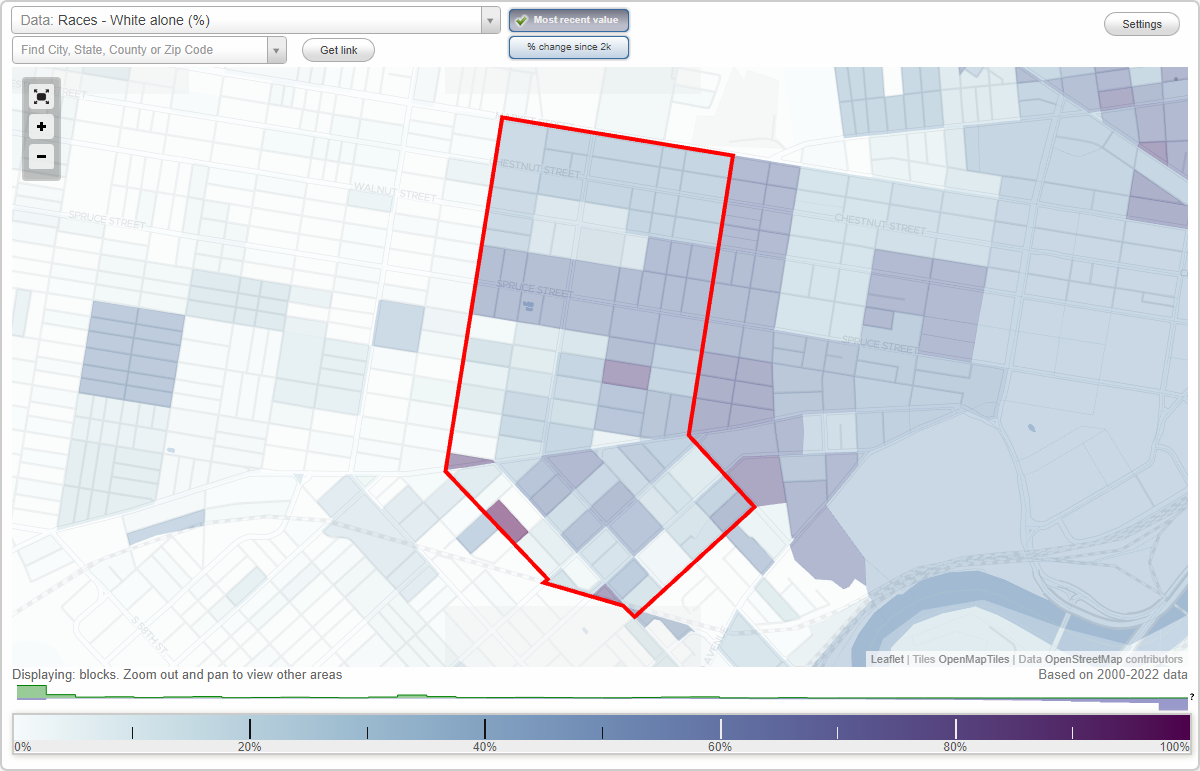
Area: 0.552 square miles
Population: 14,450
Population density:
| Cedar Park: | 26,184 people per square mile |
| Philadelphia: | 11,602 people per square mile |

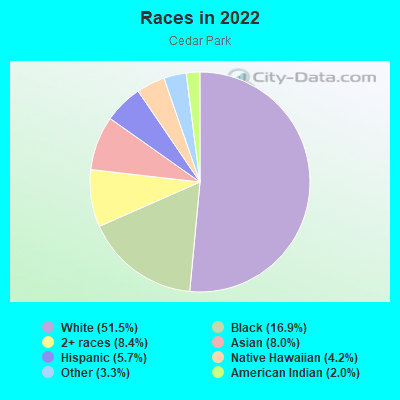
- 8,69251.5%White
- 2,86116.9%Black
- 1,4178.4%Two or more races
- 1,3508.0%Asian
- 9655.7%Hispanic or Latino
- 7084.2%Native Hawaiian and Other
Pacific Islander - 5523.3%Some other race
- 3402.0%American Indian
Distribution of median household income
![Distribution of median household income]()
- 852Less than $10,000
- 1,300$10,000 to $19,999
- 1,064$20,000 to $29,999
- 1,200$30,000 to $39,999
- 817$40,000 to $49,999
- 749$50,000 to $59,999
- 792$60,000 to $74,999
- 1,084$75,000 to $99,999
- 482$100,000 to $124,999
- 721$125,000 to $149,999
- 635$150,000 to $199,999
- 914$200,000 or more

Distribution of owner-occupied house/condo value
![Distribution of owner-occupied house/condo value]()
- 1,532Less than $50,000
- 1,877$50,000 to $99,999
- 1,698$100,000 to $149,999
- 1,208$150,000 to $199,999
- 310$200,000 to $249,999
- 629$250,000 to $299,999
- 342$300,000 to $399,999
- 840$400,000 to $499,999
- 661$500,000 to $749,999
- 794$750,000 to $999,999
- 304$1,000,000 or more

Distribution of rent paid by renters
![Distribution of rent paid by renters]()
- 66Less than $100
- 54$100 to $199
- 416$200 to $299
- 1,324$300 to $399
- 1,147$400 to $499
- 674$500 to $599
- 723$600 to $699
- 613$700 to $799
- 1,110$800 to $899
- 1,245$900 to $999
- 1,803$1,000 to $1,249
- 654$1,250 to $1,499
- 745$1,500 to $1,999
- 884$2,000 or more

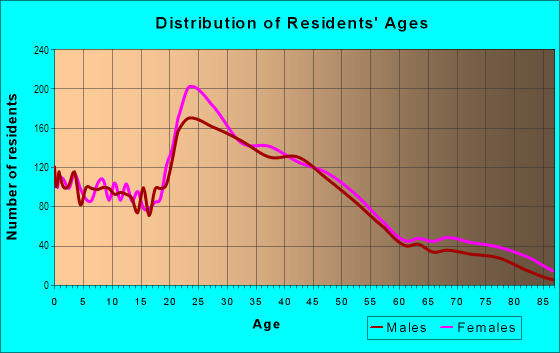
| Males: | 6,890 |
| Females: | 7,560 |
Males:
| This neighborhood: | 36.8 years |
| Whole city: | 34.1 years |
| This neighborhood: | 37.8 years |
| Whole city: | 36.3 years |
Average household size:
| Cedar Park: | 6.3 people |
| Philadelphia: | 2.2 people |
Percentage of family households:
| Cedar Park: | 26.5% |
| Philadelphia: | 36.5% |
| Here: | 27.3% |
| Philadelphia: | 28.0% |
Percentage of married-couple families with children (among all households):
| Cedar Park: | 53.7% |
| Philadelphia: | 23.5% |
Percentage of single-mother households (among all households):
| Cedar Park: | 16.4% |
| Philadelphia: | 17.6% |
Percentage of never married males 15 years old and over:
Percentage of never married females 15 years old and over:
| Cedar Park: | 25.2% |
| Philadelphia: | 23.9% |
Percentage of never married females 15 years old and over:
| Cedar Park: | 31.5% |
| city: | 26.0% |
Percentage of people that speak English not well or not at all:
| Cedar Park: | 1.5% |
| Philadelphia: | 7.0% |
Percentage of people born in this state:
Percentage of people born in another U.S. state:
Percentage of native residents but born outside the U.S.:
Percentage of foreign born residents:
| Here: | 45.2% |
| Philadelphia: | 61.6% |
Percentage of people born in another U.S. state:
| Cedar Park: | 39.5% |
| Philadelphia: | 18.9% |
Percentage of native residents but born outside the U.S.:
| Here: | 1.4% |
| city: | 3.7% |
Percentage of foreign born residents:
| Here: | 14.0% |
| Philadelphia: | 15.7% |
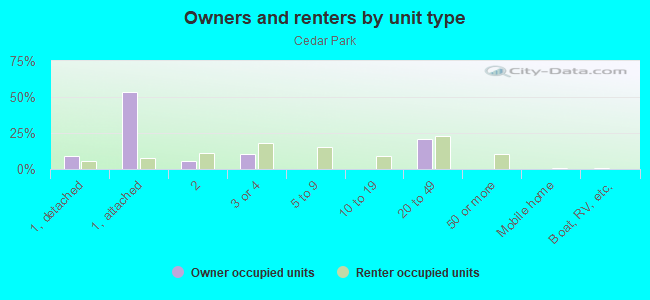
Owner-occupied
Renter-occupied

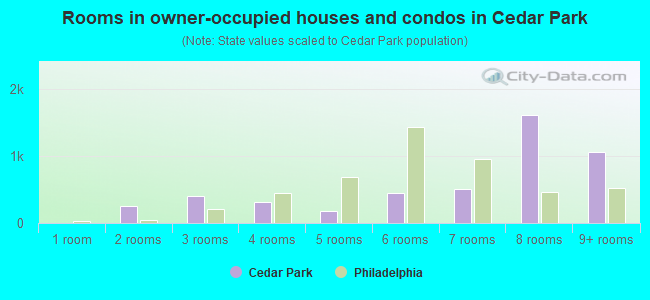
- Rooms in owner-occupied houses and condos in Cedar Park
- 01 room
- 2512 rooms
- 4113 rooms
- 3194 rooms
- 1805 rooms
- 4486 rooms
- 5117 rooms
- 1,6178 rooms
- 1,0619+ rooms
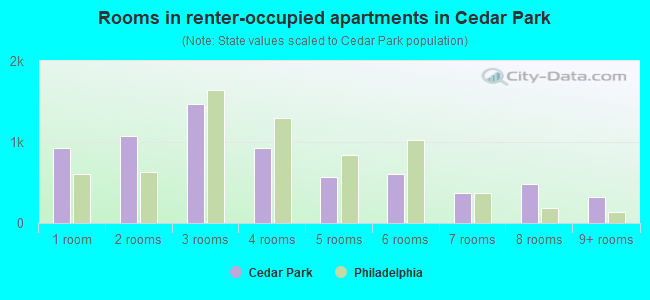
- Rooms in renter-occupied apartments in Cedar Park
- 9231 room
- 1,0732 rooms
- 1,4743 rooms
- 9284 rooms
- 5645 rooms
- 6006 rooms
- 3747 rooms
- 4798 rooms
- 3169+ rooms
Owner-occupied
Renter-occupied
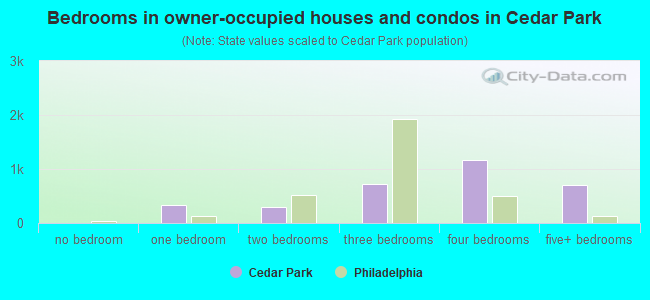
- Bedrooms in owner-occupied houses and condos in Cedar Park
- 0no bedroom
- 3331 bedroom
- 2892 bedrooms
- 7263 bedrooms
- 1,1694 bedrooms
- 7105+ bedrooms
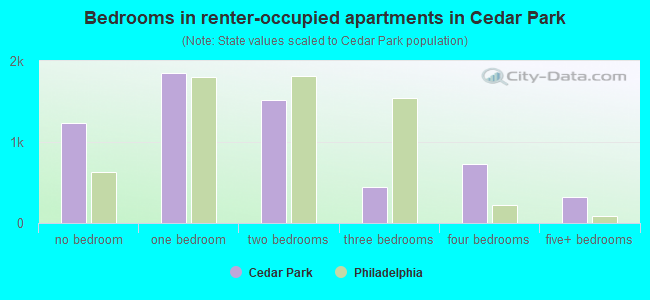
- Bedrooms in renter-occupied apartments in Cedar Park
- 1,238no bedroom
- 1,8551 bedroom
- 1,5182 bedrooms
- 4413 bedrooms
- 7244 bedrooms
- 3245+ bedrooms
Average number of cars or other vehicles available in houses/condos:
Average number of cars or other vehicles available in apartments:
| This neighborhood: | 1.2 |
| Philadelphia: | 1.3 |
Average number of cars or other vehicles available in apartments:
| Here: | 0.6 |
| city: | 0.8 |
Percentage of units with a mortgage:
| Cedar Park: | 71.3% |
| Philadelphia: | 58.9% |
Average estimated value of townhouses or other attached units in 2022 (33.5% of all units):
| This neighborhood: | $447,016 |
| city: | $243,508 |
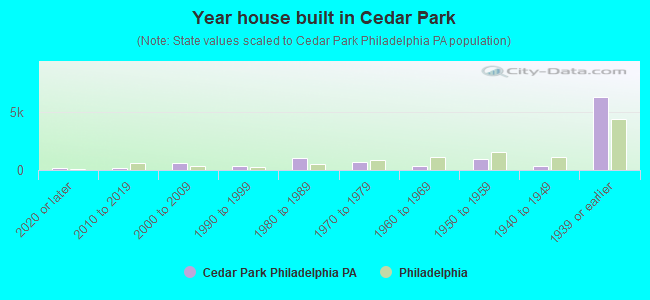
- Year house built in Cedar Park
- 1352020 or later
- 2142010 to 2019
- 6192000 to 2009
- 3571990 to 1999
- 1,0451980 to 1989
- 7101970 to 1979
- 3071960 to 1969
- 9251950 to 1959
- 3631940 to 1949
- 6,2251939 or earlier
City-data.com crime index for city in 2020 (higher means more crime):
| City: | 169.8 |
| U.S. average: | 219.5 |
Travel time to work (commute)
![Travel time to work (commute)]()
- 402Less than 5 minutes
- 2715 to 9 minutes
- 68810 to 14 minutes
- 1,02315 to 19 minutes
- 1,28920 to 24 minutes
- 63125 to 29 minutes
- 2,13130 to 34 minutes
- 16335 to 39 minutes
- 35840 to 44 minutes
- 68345 to 59 minutes
- 22060 to 89 minutes
- 25490 or more minutes

Means of transportation to work
![Means of transportation to work]()
- 25.9%2,420Drove a car alone
- 3.3%309Carpooled
- 10.5%978Bus
- 8.2%766Subway or elevated rail
- 4.7%435Long-distance train or commuter rail
- 12.9%1,205Light rail, streetcar or trolley
- 11.8%1,102Taxi
- 5.7%536Motorcycle
- 11.7%1,093Bicycle
- 15.8%1,473Walked
- 2.7%252Other means
- 17.4%1,628Worked at home

Time leaving home to go to work
![Time leaving home to go to work]()
- 2412:00 a.m. to 4:59 a.m.
- 535:00 a.m. to 5:29 a.m.
- 1425:30 a.m. to 5:59 a.m.
- 5056:00 a.m. to 6:29 a.m.
- 2456:30 a.m. to 6:59 a.m.
- 8137:00 a.m. to 7:29 a.m.
- 1,0197:30 a.m. to 7:59 a.m.
- 1,1218:00 a.m. to 8:29 a.m.
- 1,6538:30 a.m. to 8:59 a.m.
- 8939:00 a.m. to 9:59 a.m.
- 36110:00 a.m. to 10:59 a.m.
- 11911:00 a.m. to 11:59 a.m.
- 47212:00 p.m. to 3:59 p.m.
- 3274:00 p.m. to 11:59 p.m.

Occupations of males:
- Percentage of males in management occupations (except farmers):
Here: 10.1% city: 9.1%
- Percentage of males in business and financial operations occupations:
Here: 9.8% city: 6.0%
- Percentage of males in computer and mathematical occupations:
Here: 3.1% city: 4.6%
- Percentage of males in architecture and engineering occupations:
Here: 4.7% city: 2.4%
- Percentage of males in life, physical, and social science occupations:
Here: 5.6% city: 1.7%
- Percentage of males in community and social services occupations:
Here: 2.1% city: 1.9%
- Percentage of males in legal occupations:
Here: 4.2% city: 1.8%
- Percentage of males in education, training, and library occupations:
Here: 21.6% city: 4.0%
- Percentage of males in arts, design, entertainment, sports, and media occupations:
Here: 4.6% city: 2.5%
- Percentage of males in healthcare practitioners and technical occupations:
Here: 4.9% city: 4.3%
- Percentage of males in service occupations:
Here: 7.6% city: 19.3%
- Percentage of males in sales and office occupations:
Here: 16.6% city: 14.1%
- Percentage of males in construction, extraction, and maintenance occupations:
Here: 1.8% city: 6.4%
- Percentage of males in production occupations:
Here: 1.6% city: 5.0%
Occupations of females:
- Percentage of females in management occupations (except farmers):
Here: 10.3% city: 9.1%
- Percentage of females in business and financial operations occupations:
Here: 5.0% city: 6.6%
- Percentage of females in computer and mathematical occupations:
Here: 3.8% city: 1.7%
- Percentage of females in architecture and engineering occupations:
Here: 1.2% city: 0.7%
- Percentage of females in life, physical, and social science occupations:
Here: 3.9% city: 1.6%
- Percentage of females in community and social services occupations:
Here: 5.4% city: 3.6%
- Percentage of females in education, training, and library occupations:
Here: 25.3% city: 8.5%
- Percentage of females in arts, design, entertainment, sports, and media occupations:
Here: 3.0% city: 2.4%
- Percentage of females in healthcare practitioners and technical occupations:
Here: 8.6% city: 10.3%
- Percentage of females in service occupations:
Here: 10.4% city: 24.4%
- Percentage of females in sales and office occupations:
Here: 19.3% city: 23.4%
- Percentage of females in production occupations:
Here: 1.9% city: 2.4%
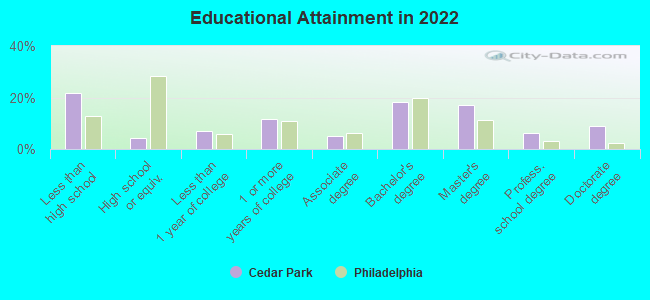
Education in this neighborhood (subdivision or community):
- Percentage of people 3 years and older in K-12 schools:
Cedar Park: 21.7% Philadelphia: 15.6%
- Percentage of people 3 years and older in undergraduate colleges:
Cedar Park: 13.6% Philadelphia: 6.0%
- Percentage of people 3 years and older in grad. or professional schools:
Cedar Park: 12.3% Philadelphia: 2.8%
- Percentage of students K-12 enrolled in private schools:
Cedar Park: 48.3% Philadelphia: 25.0%
Percentage of population below poverty level:
| Cedar Park: | 22.0% |
| Philadelphia: | 21.7% |
Median year owner moved in (as recorded in 2022):
| Cedar Park: | 2001 |
| Philadelphia: | 2007 |
Percentage of married-couple families with both working:
| Cedar Park: | 133.6% |
| Philadelphia: | 71.4% |
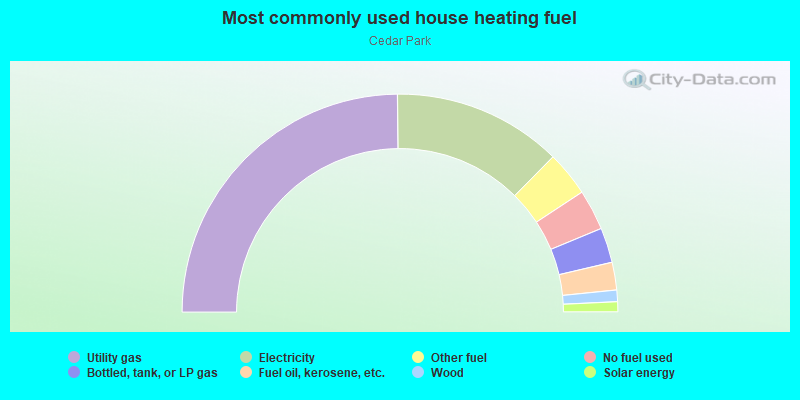
- 49.6%Utility gas
- 25.1%Electricity
- 6.7%Other fuel
- 6.0%No fuel used
- 5.2%Bottled, tank, or LP gas
- 4.1%Fuel oil, kerosene, etc.
- 1.7%Wood
- 1.5%Solar energy
Highways in this neighborhood:
US Hwy 13 (Baltimore Ave)
Length: 0.67 miles
Direction: E-W
Address range: 4500 to 4950
Direction: E-W
Address range: 4500 to 4950
Walnut St (State Rte 3)
Length: 0.55 miles
Direction: E-W
Address range: 4500 to 4899
Direction: E-W
Address range: 4500 to 4899
State Rte 3 (Chestnut St)
Length: 0.55 miles
Direction: E-W
Address range: 4500 to 4899
Direction: E-W
Address range: 4500 to 4899
Chester Ave
Length: 0.48 miles
Direction: SW-NE
Address range: 4500 to 4919
Direction: SW-NE
Address range: 4500 to 4919
Roads and streets:
S 49th St
Length: 1.23 miles
Directions: N-S, SE-NW
Address range: 21 to 1123
Directions: N-S, SE-NW
Address range: 21 to 1123
S 48th St
Length: 1.17 miles
Directions: N-S, SE-NW
Address range: 20 to 1199
Directions: N-S, SE-NW
Address range: 20 to 1199
S 47th St
Length: 1.01 miles
Directions: N-S, SE-NW
Address range: 100 to 1199
Directions: N-S, SE-NW
Address range: 100 to 1199
S 46th St
Length: 0.95 miles
Directions: N-S, SE-NW
Address range: 11 to 1199
Directions: N-S, SE-NW
Address range: 11 to 1199
S 45th St
Length: 0.71 miles
Directions: N-S, SE-NW
Address range: 28 to 1199
Directions: N-S, SE-NW
Address range: 28 to 1199
Pine St
Length: 0.62 miles
Direction: E-W
Address range: 4500 to 4948
Direction: E-W
Address range: 4500 to 4948
Locust St
Length: 0.62 miles
Direction: E-W
Address range: 4500 to 4949
Direction: E-W
Address range: 4500 to 4949
Spruce St
Length: 0.62 miles
Direction: E-W
Address range: 4500 to 4934
Direction: E-W
Address range: 4500 to 4934
S Farragut St
Length: 0.57 miles
Directions: N-S, SE-NW
Address range: 26 to 1099
Directions: N-S, SE-NW
Address range: 26 to 1099
Ludlow St
Length: 0.55 miles
Direction: E-W
Address range: 4500 to 4899
Direction: E-W
Address range: 4500 to 4899
Sansom St
Length: 0.55 miles
Direction: E-W
Address range: 4500 to 4899
Direction: E-W
Address range: 4500 to 4899
Larchwood Ave
Length: 0.55 miles
Direction: E-W
Address range: 4500 to 4899
Direction: E-W
Address range: 4500 to 4899
Osage Ave
Length: 0.55 miles
Direction: E-W
Address range: 4500 to 4899
Direction: E-W
Address range: 4500 to 4899
S St Bernard St
Length: 0.55 miles
Directions: E-W, N-S, SE-NW, SW-NE
Address range: 200 to 1099
Directions: E-W, N-S, SE-NW, SW-NE
Address range: 200 to 1099
Cedar Ave
Length: 0.45 miles
Direction: E-W
Address range: 4500 to 4899
Direction: E-W
Address range: 4500 to 4899
Kingsessing Ave
Length: 0.41 miles
Direction: SW-NE
Address range: 4500 to 4813
Direction: SW-NE
Address range: 4500 to 4813
Hazel Ave
Length: 0.41 miles
Direction: E-W
Address range: 4600 to 4899
Direction: E-W
Address range: 4600 to 4899
Springfield Ave
Length: 0.38 miles
Direction: SW-NE
Address range: 4600 to 4915
Direction: SW-NE
Address range: 4600 to 4915
Warrington Ave
Length: 0.27 miles
Direction: SW-NE
Address range: 4700 to 4915
Direction: SW-NE
Address range: 4700 to 4915
S Melville St
Length: 0.27 miles
Direction: N-S
Address range: 200 to 599
Direction: N-S
Address range: 200 to 599
Regent St
Length: 0.27 miles
Directions: SE-NW, SW-NE
Address range: 4500 to 4899
Directions: SE-NW, SW-NE
Address range: 4500 to 4899
Windsor Ave
Length: 0.21 miles
Direction: SW-NE
Address range: 4700 to 4899
Direction: SW-NE
Address range: 4700 to 4899
Florence Ave
Length: 0.21 miles
Directions: N-S, SW-NE
Address range: 4800 to 4999
Directions: N-S, SW-NE
Address range: 4800 to 4999
S Hanson St
Length: 0.15 miles
Direction: N-S
Address range: 200 to 399
Direction: N-S
Address range: 200 to 399
Walton Ave
Length: 0.13 miles
Direction: E-W
Address range: 4800 to 4899
Direction: E-W
Address range: 4800 to 4899
Pentridge St
Length: 0.11 miles
Direction: SW-NE
Address range: 4900 to 4999
Direction: SW-NE
Address range: 4900 to 4999
Trinity Pl (Trinity St)
Length: 0.11 miles
Direction: SW-NE
Address range: 4800 to 4899
Direction: SW-NE
Address range: 4800 to 4899
Beaumont Ave
Length: 0.11 miles
Direction: SW-NE
Address range: 4800 to 4899
Direction: SW-NE
Address range: 4800 to 4899
S 50th St
Length: 0.10 miles
Direction: SE-NW
Address range: 700 to 899
Direction: SE-NW
Address range: 700 to 899
University Mews
Length: 0.07 miles
Direction: E-W
Address range: 1 to 53
Direction: E-W
Address range: 1 to 53
S Fallon St
Length: 0.05 miles
Direction: N-S
Address range: 1 to 99
Direction: N-S
Address range: 1 to 99
Willows Ave
Length: 0.03 miles
Direction: SW-NE
Address range: 4900 to 4999
Direction: SW-NE
Address range: 4900 to 4999
Railroad features:
Penn Central RR (Norfolk Southern Rlwy)
Length: 0.15 miles
Direction: E-W
Direction: E-W