Cedarville (Giannotta) neighborhood in San Jose, California (CA), 95133 detailed profile
Settings
X


Business Search - 14 Million verified businesses
Area: 0.119 square miles
Population: 675
Population density:
| Cedarville (Giannotta): | 5,650 people per square mile |
| San Jose: | 5,554 people per square mile |

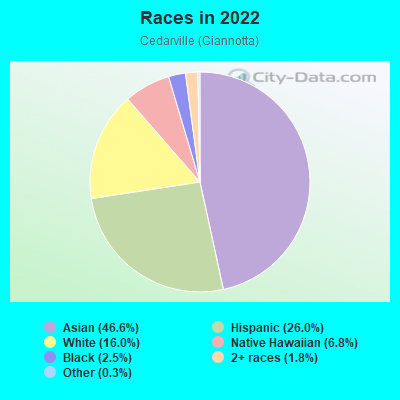
- 31446.6%Asian
- 17526.0%Hispanic or Latino
- 10816.0%White
- 466.8%Native Hawaiian and Other
Pacific Islander - 172.5%Black
- 121.8%Two or more races
- 20.3%Some other race
Median household income in 2022:
| Cedarville (Giannotta): | $132,917 |
| San Jose: | $133,835 |
Distribution of median household income
![Distribution of median household income]()
- 11Less than $10,000
- 3$10,000 to $19,999
- 27$20,000 to $29,999
- 3$30,000 to $39,999
- 5$40,000 to $49,999
- 4$50,000 to $59,999
- 7$60,000 to $74,999
- 9$75,000 to $99,999
- 26$100,000 to $124,999
- 33$125,000 to $149,999
- 27$150,000 to $199,999
- 50$200,000 or more

Distribution of owner-occupied house/condo value
![Distribution of owner-occupied house/condo value]()
- 4Less than $50,000
- 3$150,000 to $199,999
- 4$200,000 to $249,999
- 7$250,000 to $299,999
- 6$500,000 to $749,999
- 42$750,000 to $999,999
- 88$1,000,000 or more

Distribution of rent paid by renters
![Distribution of rent paid by renters]()
- 6$200 to $299
- 3$400 to $499
- 3$500 to $599
- 1$600 to $699
- 5$800 to $899
- 5$900 to $999
- 4$1,000 to $1,249
- 2$1,250 to $1,499
- 3$1,500 to $1,999
- 73$2,000 or more

Median rent in 2022:
| Cedarville (Giannotta): | $3,359 |
| San Jose: | $2,001 |
| Males: | 373 |
| Females: | 302 |
Males:
| This neighborhood: | 36.5 years |
| Whole city: | 37.6 years |
| This neighborhood: | 39.2 years |
| Whole city: | 39.1 years |
Average household size:
| Cedarville (Giannotta): | 3.4 people |
| San Jose: | 2.9 people |
Percentage of family households:
| Cedarville (Giannotta): | 42.8% |
| San Jose: | 49.9% |
| Here: | 53.5% |
| San Jose: | 53.0% |
Percentage of married-couple families with children (among all households):
| Cedarville (Giannotta): | 24.0% |
| San Jose: | 25.8% |
Percentage of single-mother households (among all households):
| Cedarville (Giannotta): | 5.0% |
| San Jose: | 5.2% |
Percentage of never married males 15 years old and over:
Percentage of never married females 15 years old and over:
| Cedarville (Giannotta): | 25.4% |
| San Jose: | 20.9% |
Percentage of never married females 15 years old and over:
| Cedarville (Giannotta): | 17.4% |
| city: | 16.7% |
Percentage of people that speak English not well or not at all:
| Cedarville (Giannotta): | 12.1% |
| San Jose: | 11.4% |
Percentage of people born in this state:
Percentage of people born in another U.S. state:
Percentage of native residents but born outside the U.S.:
Percentage of foreign born residents:
| Here: | 34.7% |
| San Jose: | 46.1% |
Percentage of people born in another U.S. state:
| Cedarville (Giannotta): | 7.9% |
| San Jose: | 10.4% |
Percentage of native residents but born outside the U.S.:
| Here: | 3.3% |
| city: | 1.7% |
Percentage of foreign born residents:
| Here: | 54.1% |
| San Jose: | 41.8% |

Owner-occupied
Renter-occupied

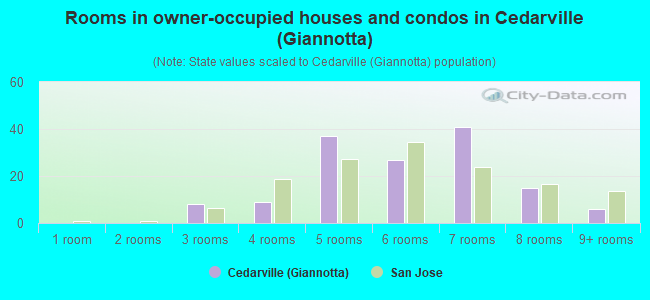
- Rooms in owner-occupied houses and condos in Cedarville <
> - 01 room
- 02 rooms
- 83 rooms
- 94 rooms
- 375 rooms
- 276 rooms
- 417 rooms
- 158 rooms
- 69+ rooms
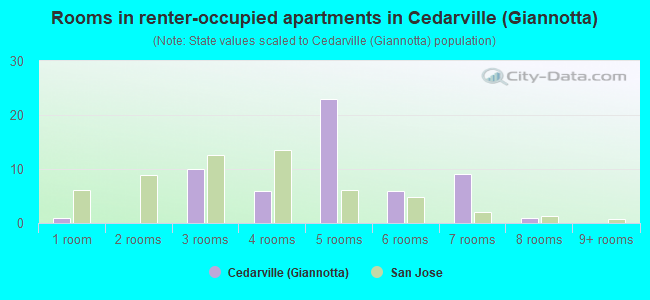
- Rooms in renter-occupied apartments in Cedarville <
> - 11 room
- 02 rooms
- 103 rooms
- 64 rooms
- 235 rooms
- 66 rooms
- 97 rooms
- 18 rooms
- 09+ rooms
Owner-occupied
Renter-occupied
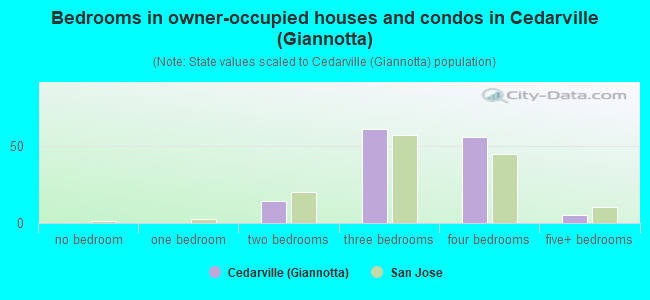
- Bedrooms in owner-occupied houses and condos in Cedarville <
> - 0no bedroom
- 01 bedroom
- 142 bedrooms
- 613 bedrooms
- 564 bedrooms
- 55+ bedrooms
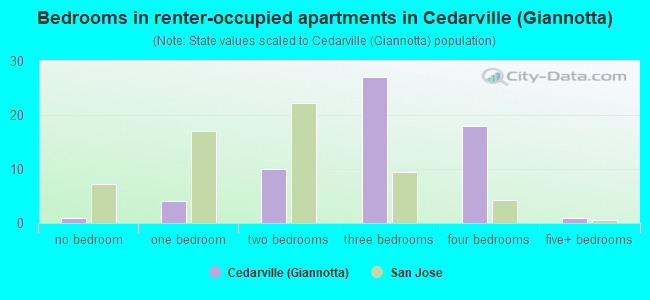
- Bedrooms in renter-occupied apartments in Cedarville <
> - 1no bedroom
- 41 bedroom
- 102 bedrooms
- 273 bedrooms
- 184 bedrooms
- 15+ bedrooms
Average number of cars or other vehicles available in houses/condos:
Average number of cars or other vehicles available in apartments:
| This neighborhood: | 2.4 |
| San Jose: | 2.3 |
Average number of cars or other vehicles available in apartments:
| Here: | 2.4 |
| city: | 1.6 |
Percentage of units with a mortgage:
| Cedarville (Giannotta): | 60.1% |
| San Jose: | 66.9% |
Housing prices:
- Average estimated value of detached houses in 2022 (90.1% of all units):
Cedarville (Giannotta): $498,632 San Jose: $1,532,815
- Average estimated value of townhouses or other attached units in 2022 (8.4% of all units):
This neighborhood: $760,363 city: $1,024,857
- Average estimated '22 value of housing units in 3-to-4-unit structures (9.4% of all units):
Cedarville (Giannotta): $581,203 city: $781,695
- Average estimated '22 value of housing units in 5-or-more-unit structures (3.0% of all units):
Cedarville (Giannotta): $1,029,586 San Jose: $791,954
- Average estimated value of mobile home in 2022 (5.4% of all units):
Cedarville (Giannotta): $266,726 San Jose: $237,683
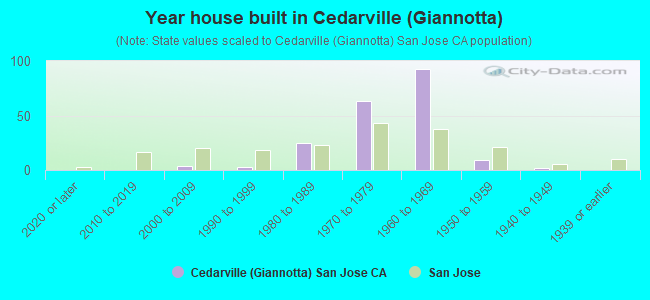
- Year house built in Cedarville <
> - 02020 or later
- 02010 to 2019
- 42000 to 2009
- 31990 to 1999
- 251980 to 1989
- 631970 to 1979
- 931960 to 1969
- 91950 to 1959
- 21940 to 1949
- 01939 or earlier
City-data.com crime index for city in 2020 (higher means more crime):
| City: | 268.4 |
| U.S. average: | 219.5 |
Travel time to work (commute)
![Travel time to work (commute)]()
- 1Less than 5 minutes
- 35 to 9 minutes
- 1610 to 14 minutes
- 3315 to 19 minutes
- 5020 to 24 minutes
- 1725 to 29 minutes
- 8130 to 34 minutes
- 235 to 39 minutes
- 640 to 44 minutes
- 1845 to 59 minutes
- 560 to 89 minutes
- 190 or more minutes

Means of transportation to work
![Means of transportation to work]()
- 63.7%194Drove a car alone
- 18.4%56Carpooled
- 1.6%5Bus
- 2.3%7Subway or elevated rail
- 1.0%3Walked
- 1.0%3Other means
- 14.1%43Worked at home

Time leaving home to go to work
![Time leaving home to go to work]()
- 1412:00 a.m. to 4:59 a.m.
- 45:00 a.m. to 5:29 a.m.
- 105:30 a.m. to 5:59 a.m.
- 186:00 a.m. to 6:29 a.m.
- 196:30 a.m. to 6:59 a.m.
- 387:00 a.m. to 7:29 a.m.
- 157:30 a.m. to 7:59 a.m.
- 298:00 a.m. to 8:29 a.m.
- 178:30 a.m. to 8:59 a.m.
- 259:00 a.m. to 9:59 a.m.
- 810:00 a.m. to 10:59 a.m.
- 311:00 a.m. to 11:59 a.m.
- 2812:00 p.m. to 3:59 p.m.
- 44:00 p.m. to 11:59 p.m.

Occupations of males:
- Percentage of males in management occupations (except farmers):
Here: 7.1% city: 13.0%
- Percentage of males in business and financial operations occupations:
Here: 1.3% city: 4.6%
- Percentage of males in computer and mathematical occupations:
Here: 13.2% city: 13.6%
- Percentage of males in architecture and engineering occupations:
Here: 21.7% city: 10.2%
- Percentage of males in education, training, and library occupations:
Here: 1.3% city: 2.8%
- Percentage of males in arts, design, entertainment, sports, and media occupations:
Here: 2.8% city: 1.8%
- Percentage of males in healthcare practitioners and technical occupations:
Here: 3.1% city: 2.0%
- Percentage of males in service occupations:
Here: 14.4% city: 12.7%
- Percentage of males in sales and office occupations:
Here: 3.5% city: 12.8%
- Percentage of males in construction, extraction, and maintenance occupations:
Here: 15.4% city: 7.8%
- Percentage of males in production occupations:
Here: 6.1% city: 5.5%
- Percentage of males in transportation occupations:
Here: 2.5% city: 3.6%
- Percentage of males in material moving occupations:
Here: 1.8% city: 3.1%
Occupations of females:
- Percentage of females in management occupations (except farmers):
Here: 4.9% city: 11.0%
- Percentage of females in business and financial operations occupations:
Here: 10.3% city: 8.6%
- Percentage of females in computer and mathematical occupations:
Here: 9.4% city: 5.4%
- Percentage of females in life, physical, and social science occupations:
Here: 1.9% city: 1.7%
- Percentage of females in community and social services occupations:
Here: 6.7% city: 1.8%
- Percentage of females in education, training, and library occupations:
Here: 3.9% city: 8.1%
- Percentage of females in arts, design, entertainment, sports, and media occupations:
Here: 1.3% city: 2.0%
- Percentage of females in healthcare practitioners and technical occupations:
Here: 1.7% city: 6.8%
- Percentage of females in service occupations:
Here: 42.3% city: 21.7%
- Percentage of females in sales and office occupations:
Here: 13.5% city: 22.0%
- Percentage of females in production occupations:
Here: 2.9% city: 4.0%
- Percentage of females in material moving occupations:
Here: 2.0% city: 1.5%
Education in this neighborhood (subdivision or community):
- Percentage of people 3 years and older in K-12 schools:
Cedarville (Giannotta): 15.5% San Jose: 16.1%
- Percentage of people 3 years and older in undergraduate colleges:
Cedarville (Giannotta): 6.2% San Jose: 6.5%
- Percentage of people 3 years and older in grad. or professional schools:
Cedarville (Giannotta): 1.1% San Jose: 2.0%
- Percentage of students K-12 enrolled in private schools:
Cedarville (Giannotta): 29.4% San Jose: 14.9%
Percentage of population below poverty level:
| Cedarville (Giannotta): | 7.7% |
| San Jose: | 9.0% |
Median year owner moved in (as recorded in 2022):
Median year renter moved in (as recorded in 2022):
| Cedarville (Giannotta): | 2004 |
| San Jose: | 2008 |
Median year renter moved in (as recorded in 2022):
| Cedarville (Giannotta): | 2017 |
| San Jose: | 2020 |
Percentage of married-couple families with both working:
| Cedarville (Giannotta): | 53.8% |
| San Jose: | 72.5% |
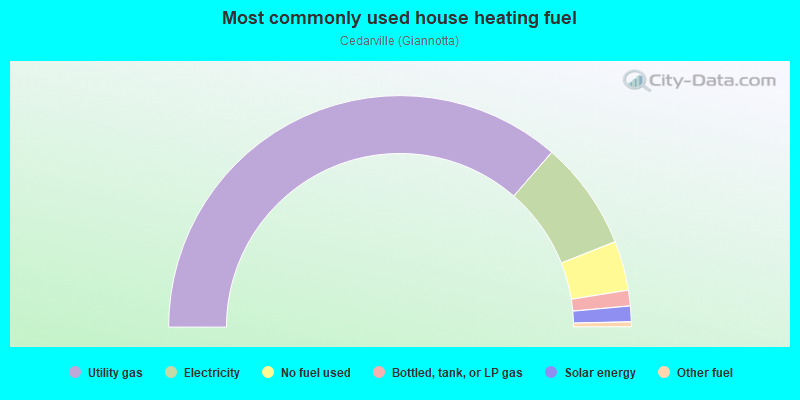
- 72.7%Utility gas
- 15.2%Electricity
- 6.9%No fuel used
- 2.2%Bottled, tank, or LP gas
- 2.2%Solar energy
- 0.7%Other fuel
Roads and streets:
Gianotta Way
Length: 0.52 miles
Directions: E-W, N-S, SE-NW, SW-NE
Address range: 460 to 599
Directions: E-W, N-S, SE-NW, SW-NE
Address range: 460 to 599
N Capitol Ave
Length: 0.37 miles
Direction: SE-NW
Address range: 504 to 648
Direction: SE-NW
Address range: 504 to 648
Easton Ln
Length: 0.21 miles
Directions: E-W, SW-NE
Address range: 2557 to 2599
Directions: E-W, SW-NE
Address range: 2557 to 2599
Gimelli Way
Length: 0.20 miles
Directions: E-W, SW-NE
Address range: 2501 to 2699
Directions: E-W, SW-NE
Address range: 2501 to 2699
Baton Rouge Dr
Length: 0.19 miles
Directions: E-W, SW-NE
Address range: 2470 to 2498
Directions: E-W, SW-NE
Address range: 2470 to 2498
Easton Dr
Length: 0.17 miles
Directions: E-W, SE-NW
Address range: 501 to 656
Directions: E-W, SE-NW
Address range: 501 to 656
Cedarville Ln
Length: 0.17 miles
Direction: SE-NW
Direction: SE-NW
White Water Ct
Length: 0.11 miles
Directions: E-W, N-S, SE-NW, SW-NE
Address range: 681 to 730
Directions: E-W, N-S, SE-NW, SW-NE
Address range: 681 to 730
Blue Rock Ct
Length: 0.10 miles
Directions: E-W, N-S, SE-NW, SW-NE
Address range: 2500 to 2599
Directions: E-W, N-S, SE-NW, SW-NE
Address range: 2500 to 2599
Genoa Dr
Length: 0.09 miles
Direction: SE-NW
Address range: 400 to 481
Direction: SE-NW
Address range: 400 to 481
Saint Florence Dr
Length: 0.09 miles
Direction: SE-NW
Address range: 469 to 599
Direction: SE-NW
Address range: 469 to 599
Vennecia Dr
Length: 0.09 miles
Direction: SE-NW
Address range: 400 to 599
Direction: SE-NW
Address range: 400 to 599
Devlin Ct
Length: 0.07 miles
Directions: E-W, SE-NW, SW-NE
Address range: 600 to 699
Directions: E-W, SE-NW, SW-NE
Address range: 600 to 699
Gimelli Pl
Length: 0.06 miles
Directions: E-W, SE-NW
Address range: 2600 to 2699
Directions: E-W, SE-NW
Address range: 2600 to 2699
Easton Pl
Length: 0.06 miles
Direction: SW-NE
Direction: SW-NE
Galleon Ct
Length: 0.05 miles
Directions: E-W, N-S, SE-NW, SW-NE
Address range: 600 to 699
Directions: E-W, N-S, SE-NW, SW-NE
Address range: 600 to 699
Kimpton Ct
Length: 0.05 miles
Direction: SW-NE
Address range: 2400 to 2499
Direction: SW-NE
Address range: 2400 to 2499
Gimelli Ct
Length: 0.05 miles
Direction: SE-NW
Address range: 2529 to 2599
Direction: SE-NW
Address range: 2529 to 2599
Easton Way
Length: 0.04 miles
Direction: SE-NW
Address range: 2500 to 2599
Direction: SE-NW
Address range: 2500 to 2599
Clear Spring Ct
Length: 0.03 miles
Direction: SW-NE
Address range: 2400 to 2499
Direction: SW-NE
Address range: 2400 to 2499
Easton Ter
Length: 0.03 miles
Direction: SE-NW
Direction: SE-NW
Oropeza Ct
Length: 0.03 miles
Direction: SE-NW
Address range: 600 to 699
Direction: SE-NW
Address range: 600 to 699
Power Ct
Length: 0.02 miles
Direction: SW-NE
Direction: SW-NE