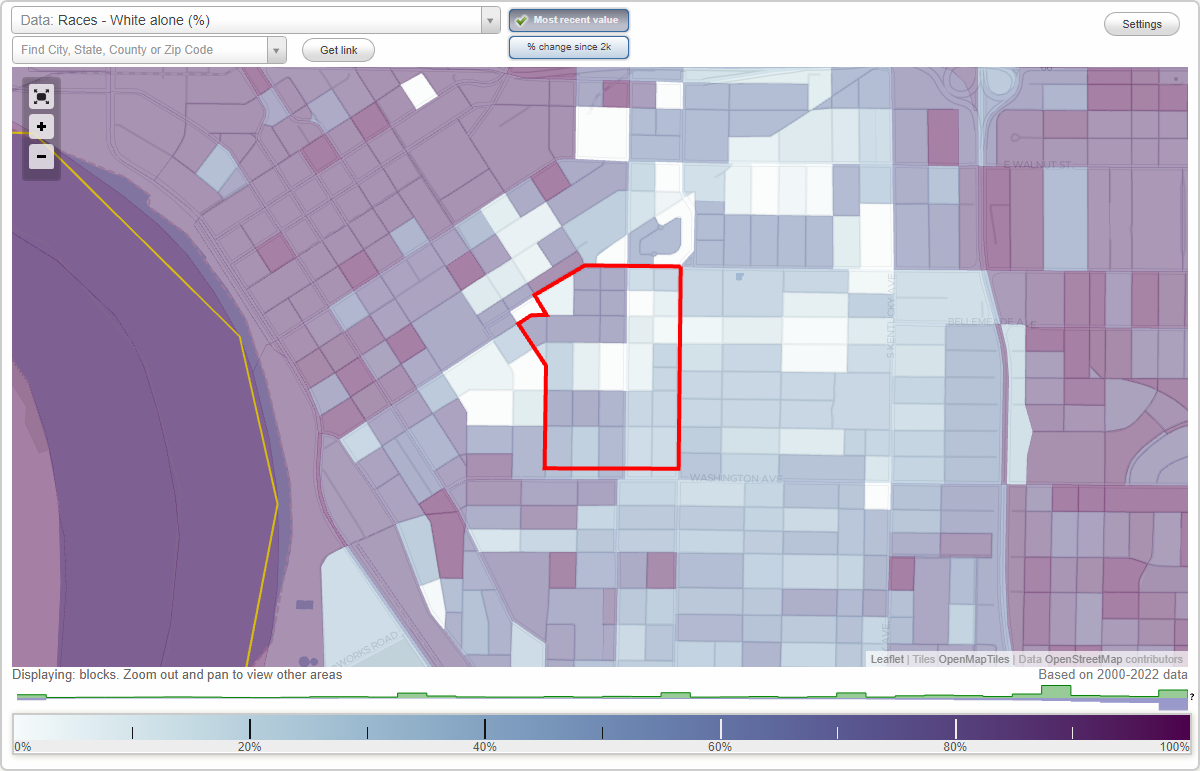
Center City neighborhood in Evansville, Indiana (IN), 47713 detailed profile
Settings
X

Business Search - 14 Million verified businesses
Area: 0.151 square miles
Population: 951
Population density:
| Center City: | 6,304 people per square mile |
| Evansville: | 2,912 people per square mile |

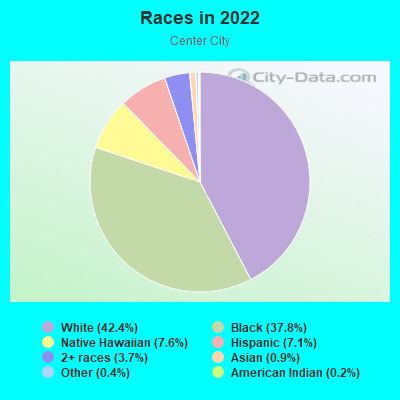
- 45242.4%White
- 40337.8%Black
- 817.6%Native Hawaiian and Other
Pacific Islander - 767.1%Hispanic or Latino
- 393.7%Two or more races
- 100.9%Asian
- 40.4%Some other race
- 20.2%American Indian
Median household income in 2022:
| Center City: | $38,985 |
| Evansville: | $48,127 |
Distribution of median household income
![Distribution of median household income]()
- 32Less than $10,000
- 68$10,000 to $19,999
- 41$20,000 to $29,999
- 77$30,000 to $39,999
- 87$40,000 to $49,999
- 27$50,000 to $59,999
- 40$60,000 to $74,999
- 34$75,000 to $99,999
- 36$100,000 to $124,999
- 24$125,000 to $149,999
- 10$150,000 to $199,999
- 11$200,000 or more

Distribution of owner-occupied house/condo value
![Distribution of owner-occupied house/condo value]()
- 111Less than $50,000
- 195$50,000 to $99,999
- 44$100,000 to $149,999
- 29$150,000 to $199,999
- 8$200,000 to $249,999
- 31$250,000 to $299,999
- 15$300,000 to $399,999
- 20$400,000 to $499,999
- 5$500,000 to $749,999
- 8$750,000 to $999,999

Distribution of rent paid by renters
![Distribution of rent paid by renters]()
- 15Less than $100
- 12$100 to $199
- 12$200 to $299
- 17$300 to $399
- 48$400 to $499
- 41$500 to $599
- 81$600 to $699
- 18$700 to $799
- 32$800 to $899
- 12$900 to $999
- 3$1,000 to $1,249
- 10$1,250 to $1,499
- 59$1,500 to $1,999

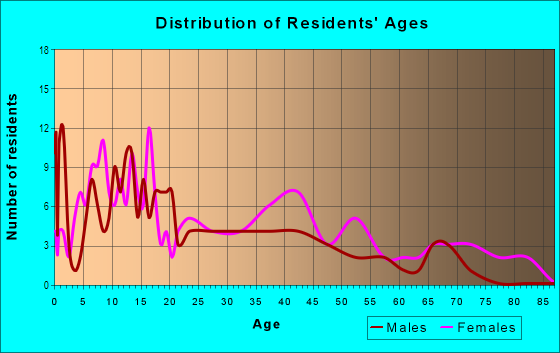
| Males: | 468 |
| Females: | 483 |
Males:
| This neighborhood: | 39.7 years |
| Whole city: | 36.6 years |
| This neighborhood: | 41.9 years |
| Whole city: | 38.9 years |
Average household size:
| Center City: | 2.0 people |
| Evansville: | 2.1 people |
Percentage of family households:
| Center City: | 25.9% |
| Evansville: | 38.3% |
| Here: | 23.2% |
| Evansville: | 33.7% |
Percentage of married-couple families with children (among all households):
| Center City: | 20.3% |
| Evansville: | 25.3% |
Percentage of single-mother households (among all households):
| Center City: | 11.8% |
| Evansville: | 15.6% |
Percentage of never married males 15 years old and over:
Percentage of never married females 15 years old and over:
| Center City: | 19.4% |
| Evansville: | 19.5% |
Percentage of never married females 15 years old and over:
| Center City: | 22.6% |
| city: | 17.0% |
Percentage of people that speak English not well or not at all:
| Center City: | 0.1% |
| Evansville: | 0.7% |
Percentage of people born in this state:
Percentage of people born in another U.S. state:
Percentage of native residents but born outside the U.S.:
Percentage of foreign born residents:
| Here: | 60.5% |
| Evansville: | 70.5% |
Percentage of people born in another U.S. state:
| Center City: | 37.1% |
| Evansville: | 25.5% |
Percentage of native residents but born outside the U.S.:
| Here: | 0.3% |
| city: | 0.8% |
Percentage of foreign born residents:
| Here: | 2.5% |
| Evansville: | 3.2% |
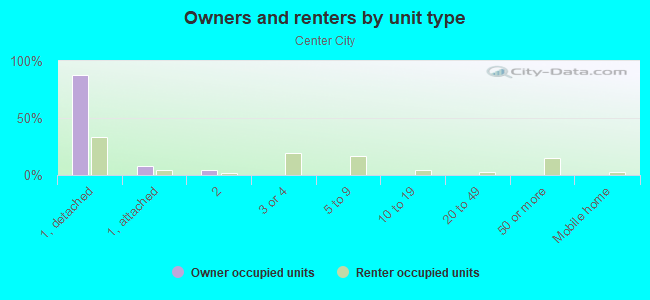
Owner-occupied
Renter-occupied

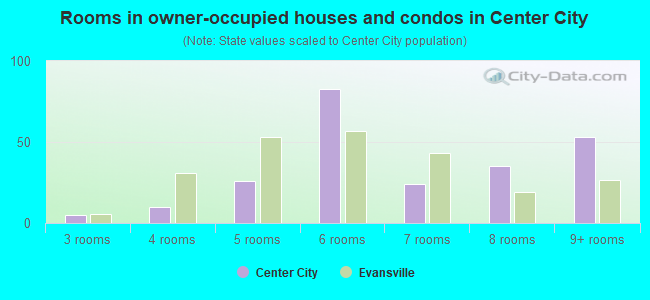
- Rooms in owner-occupied houses and condos in Center City
- 01 room
- 02 rooms
- 53 rooms
- 104 rooms
- 265 rooms
- 836 rooms
- 247 rooms
- 358 rooms
- 539+ rooms
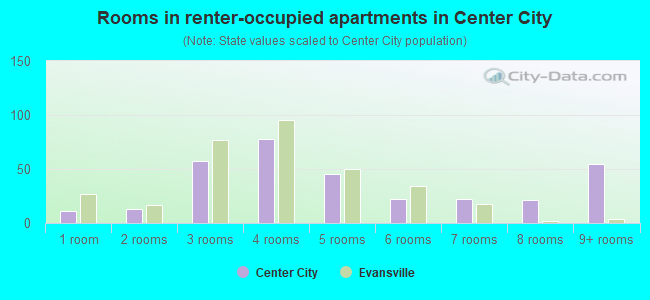
- Rooms in renter-occupied apartments in Center City
- 111 room
- 132 rooms
- 573 rooms
- 784 rooms
- 455 rooms
- 226 rooms
- 227 rooms
- 218 rooms
- 559+ rooms
Owner-occupied
Renter-occupied
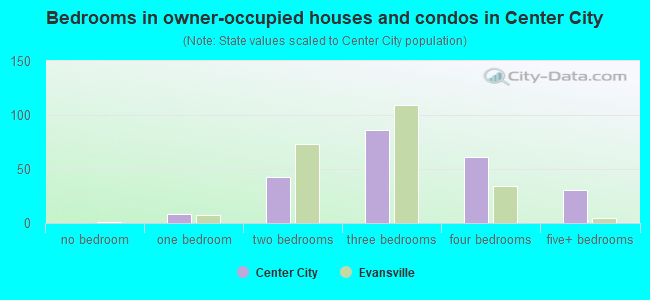
- Bedrooms in owner-occupied houses and condos in Center City
- 0no bedroom
- 81 bedroom
- 432 bedrooms
- 863 bedrooms
- 614 bedrooms
- 315+ bedrooms
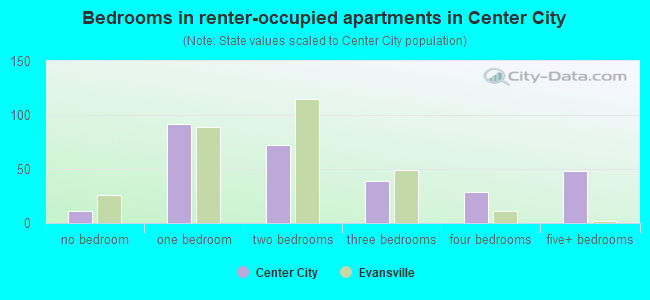
- Bedrooms in renter-occupied apartments in Center City
- 11no bedroom
- 921 bedroom
- 722 bedrooms
- 393 bedrooms
- 294 bedrooms
- 485+ bedrooms
Average number of cars or other vehicles available in houses/condos:
Average number of cars or other vehicles available in apartments:
| This neighborhood: | 2.0 |
| Evansville: | 1.8 |
Average number of cars or other vehicles available in apartments:
| Here: | 1.1 |
| city: | 1.1 |
Percentage of units with a mortgage:
| Center City: | 50.2% |
| Evansville: | 58.5% |
Average estimated value of detached houses in 2022 (65.3% of all units):
| Center City: | $112,533 |
| Indiana: | $257,916 |
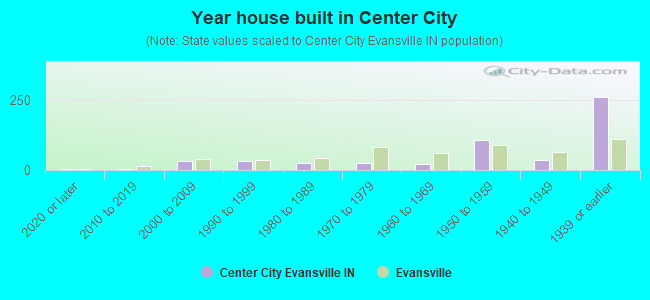
- Year house built in Center City
- 52020 or later
- 52010 to 2019
- 312000 to 2009
- 331990 to 1999
- 241980 to 1989
- 241970 to 1979
- 201960 to 1969
- 1081950 to 1959
- 351940 to 1949
- 2611939 or earlier
City-data.com crime index for city in 2020 (higher means more crime):
| City: | 440.8 |
| U.S. average: | 219.5 |
Travel time to work (commute)
![Travel time to work (commute)]()
- 9Less than 5 minutes
- 595 to 9 minutes
- 6110 to 14 minutes
- 6115 to 19 minutes
- 4620 to 24 minutes
- 2125 to 29 minutes
- 1230 to 34 minutes
- 535 to 39 minutes
- 740 to 44 minutes
- 6745 to 59 minutes
- 560 to 89 minutes
- 790 or more minutes

Means of transportation to work
![Means of transportation to work]()
- 71.5%301Drove a car alone
- 23.3%98Carpooled
- 4.7%20Bus
- 1.2%5Bicycle
- 3.8%16Walked
- 5.7%24Other means
- 8.3%35Worked at home

Time leaving home to go to work
![Time leaving home to go to work]()
- 2912:00 a.m. to 4:59 a.m.
- 155:00 a.m. to 5:29 a.m.
- 155:30 a.m. to 5:59 a.m.
- 186:00 a.m. to 6:29 a.m.
- 376:30 a.m. to 6:59 a.m.
- 307:00 a.m. to 7:29 a.m.
- 187:30 a.m. to 7:59 a.m.
- 118:00 a.m. to 8:29 a.m.
- 98:30 a.m. to 8:59 a.m.
- 259:00 a.m. to 9:59 a.m.
- 1310:00 a.m. to 10:59 a.m.
- 1111:00 a.m. to 11:59 a.m.
- 4312:00 p.m. to 3:59 p.m.
- 164:00 p.m. to 11:59 p.m.

Occupations of males:
- Percentage of males in management occupations (except farmers):
Here: 3.0% city: 8.4%
- Percentage of males in business and financial operations occupations:
Here: 2.3% city: 3.1%
- Percentage of males in computer and mathematical occupations:
Here: 2.5% city: 3.0%
- Percentage of males in healthcare practitioners and technical occupations:
Here: 4.6% city: 2.1%
- Percentage of males in service occupations:
Here: 27.8% city: 15.9%
- Percentage of males in sales and office occupations:
Here: 23.1% city: 14.7%
- Percentage of males in farming, fishing, and forestry occupations:
Here: 2.7% city: 0.3%
- Percentage of males in construction, extraction, and maintenance occupations:
Here: 3.5% city: 7.3%
- Percentage of males in production occupations:
Here: 10.0% city: 14.9%
- Percentage of males in transportation occupations:
Here: 4.3% city: 7.3%
- Percentage of males in material moving occupations:
Here: 16.9% city: 8.2%
Occupations of females:
- Percentage of females in management occupations (except farmers):
Here: 7.6% city: 6.4%
- Percentage of females in community and social services occupations:
Here: 1.7% city: 2.7%
- Percentage of females in education, training, and library occupations:
Here: 5.1% city: 5.7%
- Percentage of females in arts, design, entertainment, sports, and media occupations:
Here: 5.9% city: 1.3%
- Percentage of females in healthcare practitioners and technical occupations:
Here: 3.6% city: 8.9%
- Percentage of females in service occupations:
Here: 35.7% city: 26.1%
- Percentage of females in sales and office occupations:
Here: 17.2% city: 30.9%
- Percentage of females in production occupations:
Here: 10.9% city: 5.3%
- Percentage of females in material moving occupations:
Here: 11.8% city: 3.1%
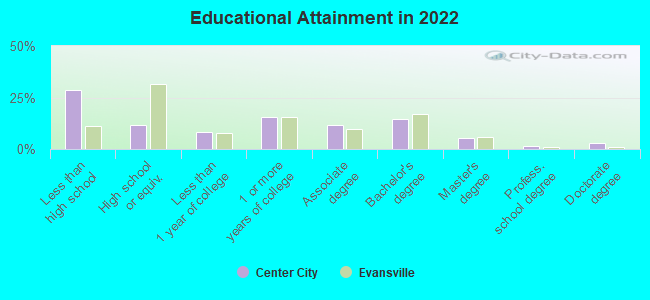
Education in this neighborhood (subdivision or community):
- Percentage of people 3 years and older in K-12 schools:
Center City: 20.2% Evansville: 15.5%
- Percentage of people 3 years and older in undergraduate colleges:
Center City: 2.6% Evansville: 5.1%
- Percentage of people 3 years and older in grad. or professional schools:
Center City: 1.9% Evansville: 0.8%
- Percentage of students K-12 enrolled in private schools:
Center City: 38.3% Evansville: 15.2%
Percentage of population below poverty level:
| Center City: | 29.5% |
| Evansville: | 19.3% |
Median year owner moved in (as recorded in 2022):
Median year renter moved in (as recorded in 2022):
| Center City: | 2006 |
| Evansville: | 2011 |
Median year renter moved in (as recorded in 2022):
| Center City: | 2017 |
| Evansville: | 2020 |
Percentage of married-couple families with both working:
| Center City: | 171.1% |
| Evansville: | 71.5% |
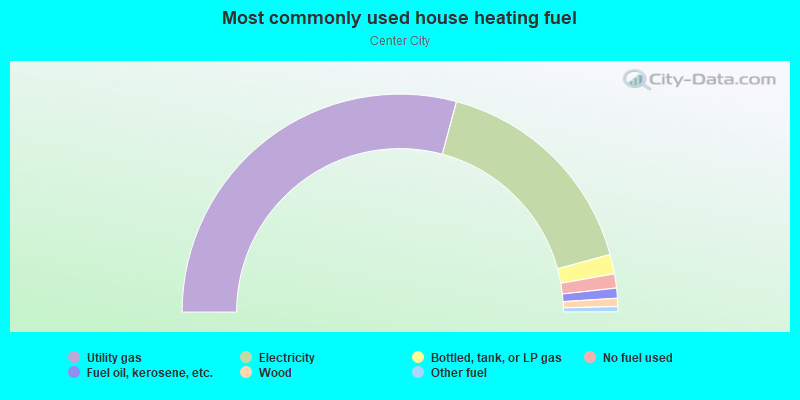
- 58.3%Utility gas
- 33.1%Electricity
- 2.9%Bottled, tank, or LP gas
- 2.1%No fuel used
- 1.5%Fuel oil, kerosene, etc.
- 1.2%Wood
- 0.8%Other fuel
Roads and streets:
Judson St
Length: 0.41 miles
Direction: N-S
Address range: 648 to 971
Direction: N-S
Address range: 648 to 971
E Gum St
Length: 0.40 miles
Direction: E-W
Address range: 200 to 599
Direction: E-W
Address range: 200 to 599
S Garvin St
Length: 0.38 miles
Direction: N-S
Address range: 650 to 948
Direction: N-S
Address range: 650 to 948
Line St
Length: 0.37 miles
Direction: N-S
Address range: 600 to 899
Direction: N-S
Address range: 600 to 899
S Governor St
Length: 0.32 miles
Direction: N-S
Address range: 650 to 899
Direction: N-S
Address range: 650 to 899
S Elliott St
Length: 0.32 miles
Direction: N-S
Address range: 632 to 899
Direction: N-S
Address range: 632 to 899
Bellemeade Ave
Length: 0.32 miles
Direction: E-W
Address range: 250 to 599
Direction: E-W
Address range: 250 to 599
E Mulberry St
Length: 0.31 miles
Direction: E-W
Address range: 248 to 599
Direction: E-W
Address range: 248 to 599
E Chandler Ave
Length: 0.31 miles
Direction: E-W
Address range: 251 to 599
Direction: E-W
Address range: 251 to 599
Powell Ave
Length: 0.16 miles
Direction: E-W
Address range: 250 to 399
Direction: E-W
Address range: 250 to 399
E Powell Ave
Length: 0.16 miles
Direction: E-W
Address range: 400 to 599
Direction: E-W
Address range: 400 to 599
Bayard Park Dr
Length: 0.08 miles
Direction: E-W
Address range: 500 to 599
Direction: E-W
Address range: 500 to 599