Chinatown neighborhood in Oakland, California (CA), 94607 detailed profile
Settings
X


Business Search - 14 Million verified businesses
Area: 0.161 square miles
Population: 2,281
Population density:
| Chinatown: | 14,128 people per square mile |
| Oakland: | 7,680 people per square mile |

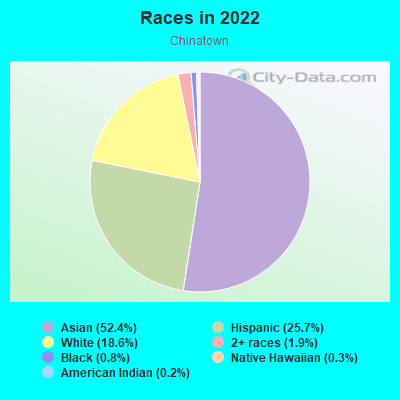
- 1,62066.6%Asian
- 25910.6%Black
- 24610.1%White
- 943.9%Two or more races
- 753.1%Hispanic or Latino
- 592.4%Some other race
- 532.2%Native Hawaiian and Other
Pacific Islander - 261.1%American Indian
Median household income in 2022:
| Chinatown: | $79,923 |
| Oakland: | $93,146 |
Distribution of median household income
![Distribution of median household income]()
- 156Less than $10,000
- 283$10,000 to $19,999
- 146$20,000 to $29,999
- 99$30,000 to $39,999
- 60$40,000 to $49,999
- 106$50,000 to $59,999
- 60$60,000 to $74,999
- 62$75,000 to $99,999
- 128$100,000 to $124,999
- 44$125,000 to $149,999
- 155$150,000 to $199,999
- 104$200,000 or more

Distribution of owner-occupied house/condo value
![Distribution of owner-occupied house/condo value]()
- 18Less than $50,000
- 23$50,000 to $99,999
- 29$250,000 to $299,999
- 23$300,000 to $399,999
- 110$400,000 to $499,999
- 491$500,000 to $749,999
- 41$750,000 to $999,999
- 28$1,000,000 or more

Distribution of rent paid by renters
![Distribution of rent paid by renters]()
- 16Less than $100
- 368$200 to $299
- 60$300 to $399
- 150$400 to $499
- 90$500 to $599
- 29$600 to $699
- 22$700 to $799
- 39$800 to $899
- 17$900 to $999
- 99$1,000 to $1,249
- 56$1,250 to $1,499
- 51$1,500 to $1,999
- 387$2,000 or more

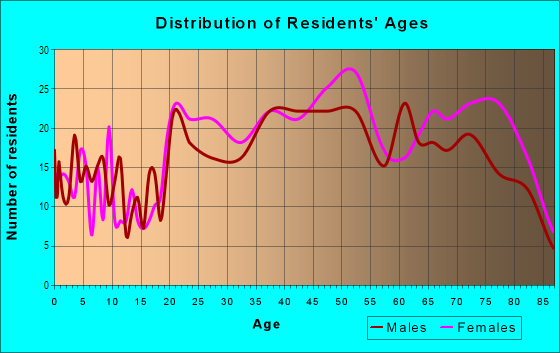
| Males: | 1,010 |
| Females: | 1,271 |
Males:
| This neighborhood: | 38.8 years |
| Whole city: | 38.3 years |
| This neighborhood: | 47.2 years |
| Whole city: | 39.1 years |
Average household size:
| Chinatown: | 1.8 people |
| Oakland: | 2.4 people |
Percentage of family households:
| Chinatown: | 26.9% |
| Oakland: | 37.1% |
| Here: | 35.7% |
| Oakland: | 34.9% |
Percentage of married-couple families with children (among all households):
| Chinatown: | 34.4% |
| Oakland: | 28.3% |
Percentage of single-mother households (among all households):
| Chinatown: | 34.0% |
| Oakland: | 9.9% |
Percentage of never married males 15 years old and over:
Percentage of never married females 15 years old and over:
| Chinatown: | 15.2% |
| Oakland: | 24.6% |
Percentage of never married females 15 years old and over:
| Chinatown: | 14.4% |
| city: | 21.9% |
Percentage of people that speak English not well or not at all:
| Chinatown: | 35.6% |
| Oakland: | 10.6% |
Percentage of people born in this state:
Percentage of people born in another U.S. state:
Percentage of native residents but born outside the U.S.:
Percentage of foreign born residents:
| Here: | 18.6% |
| Oakland: | 49.9% |
Percentage of people born in another U.S. state:
| Chinatown: | 10.1% |
| Oakland: | 22.3% |
Percentage of native residents but born outside the U.S.:
| Here: | 2.1% |
| city: | 1.6% |
Percentage of foreign born residents:
| Here: | 69.2% |
| Oakland: | 26.2% |
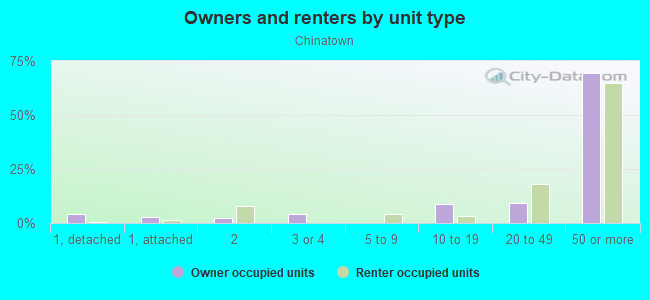
Owner-occupied
Renter-occupied

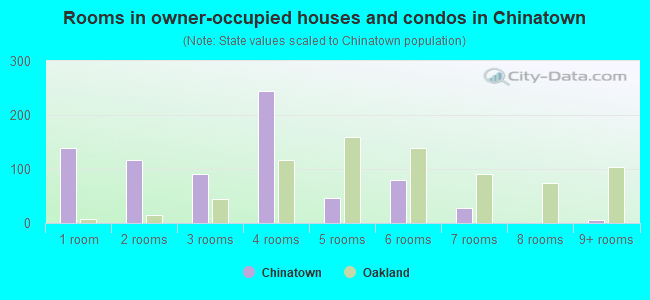
- Rooms in owner-occupied houses and condos in Chinatown
- 1391 room
- 1162 rooms
- 913 rooms
- 2454 rooms
- 465 rooms
- 796 rooms
- 287 rooms
- 08 rooms
- 69+ rooms
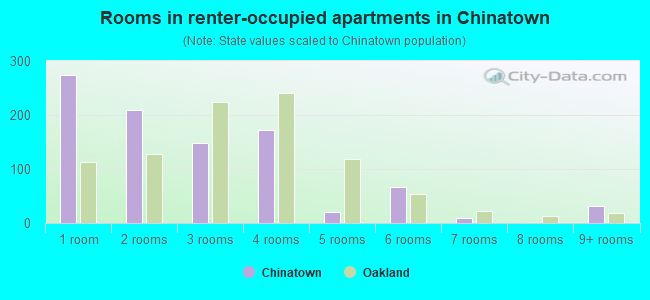
- Rooms in renter-occupied apartments in Chinatown
- 2741 room
- 2102 rooms
- 1483 rooms
- 1724 rooms
- 215 rooms
- 666 rooms
- 97 rooms
- 08 rooms
- 329+ rooms
Owner-occupied
Renter-occupied
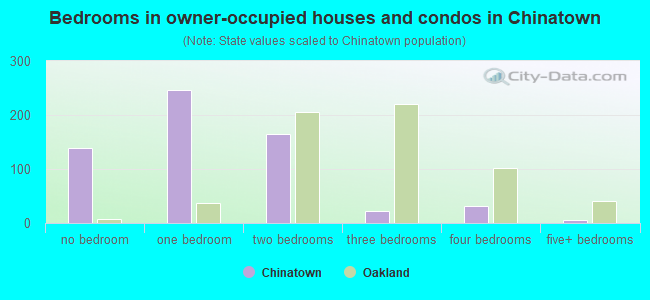
- Bedrooms in owner-occupied houses and condos in Chinatown
- 139no bedroom
- 2471 bedroom
- 1652 bedrooms
- 223 bedrooms
- 314 bedrooms
- 65+ bedrooms
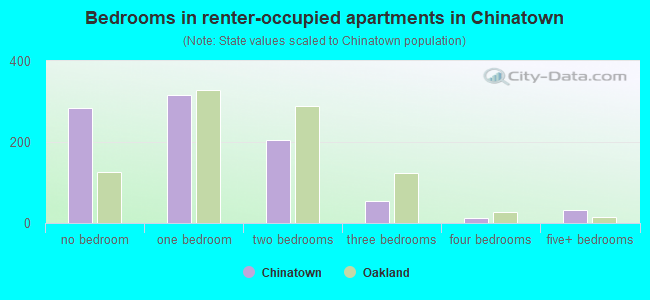
- Bedrooms in renter-occupied apartments in Chinatown
- 285no bedroom
- 3171 bedroom
- 2062 bedrooms
- 553 bedrooms
- 134 bedrooms
- 325+ bedrooms
Average number of cars or other vehicles available in houses/condos:
Average number of cars or other vehicles available in apartments:
| This neighborhood: | |
| Oakland: |
Average number of cars or other vehicles available in apartments:
| Here: | 0.6 |
| city: | 1.1 |
Percentage of units with a mortgage:
| Chinatown: | 56.7% |
| Oakland: | 71.2% |
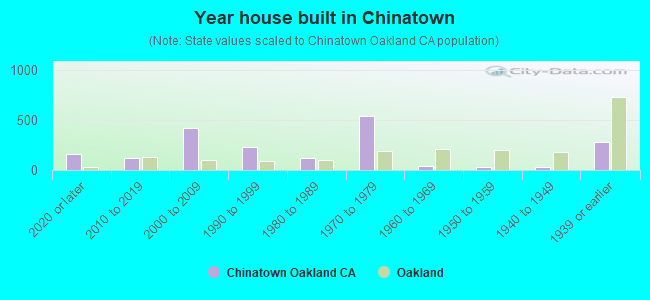
- Year house built in Chinatown
- 1632020 or later
- 1182010 to 2019
- 4232000 to 2009
- 2311990 to 1999
- 1201980 to 1989
- 5391970 to 1979
- 361960 to 1969
- 351950 to 1959
- 281940 to 1949
- 2821939 or earlier
City-data.com crime index for city in 2020 (higher means more crime):
| City: | 691.6 |
| U.S. average: | 219.5 |
Travel time to work (commute)
![Travel time to work (commute)]()
- 17Less than 5 minutes
- 1185 to 9 minutes
- 13910 to 14 minutes
- 20215 to 19 minutes
- 16320 to 24 minutes
- 15025 to 29 minutes
- 43830 to 34 minutes
- 1135 to 39 minutes
- 5840 to 44 minutes
- 23045 to 59 minutes
- 3260 to 89 minutes
- 2190 or more minutes

Means of transportation to work
![Means of transportation to work]()
- 30.4%317Drove a car alone
- 9.5%99Carpooled
- 5.9%61Bus
- 23.1%241Subway or elevated rail
- 2.3%24Long-distance train or commuter rail
- 2.7%28Ferryboat
- 14.6%152Walked
- 2.1%22Other means
- 21.6%225Worked at home

Time leaving home to go to work
![Time leaving home to go to work]()
- 312:00 a.m. to 4:59 a.m.
- 405:00 a.m. to 5:29 a.m.
- 785:30 a.m. to 5:59 a.m.
- 646:00 a.m. to 6:29 a.m.
- 356:30 a.m. to 6:59 a.m.
- 1317:00 a.m. to 7:29 a.m.
- 1147:30 a.m. to 7:59 a.m.
- 2808:00 a.m. to 8:29 a.m.
- 3918:30 a.m. to 8:59 a.m.
- 2619:00 a.m. to 9:59 a.m.
- 25510:00 a.m. to 10:59 a.m.
- 2011:00 a.m. to 11:59 a.m.
- 3612:00 p.m. to 3:59 p.m.
- 474:00 p.m. to 11:59 p.m.

Occupations of males:
- Percentage of males in management occupations (except farmers):
Here: 23.1% city: 13.5%
- Percentage of males in business and financial operations occupations:
Here: 1.5% city: 6.0%
- Percentage of males in computer and mathematical occupations:
Here: 13.0% city: 7.3%
- Percentage of males in architecture and engineering occupations:
Here: 5.4% city: 3.8%
- Percentage of males in education, training, and library occupations:
Here: 12.7% city: 4.6%
- Percentage of males in arts, design, entertainment, sports, and media occupations:
Here: 2.0% city: 4.7%
- Percentage of males in healthcare practitioners and technical occupations:
Here: 2.7% city: 2.8%
- Percentage of males in service occupations:
Here: 21.7% city: 12.9%
- Percentage of males in sales and office occupations:
Here: 6.7% city: 13.4%
- Percentage of males in material moving occupations:
Here: 4.6% city: 4.5%
Occupations of females:
- Percentage of females in management occupations (except farmers):
Here: 6.8% city: 15.1%
- Percentage of females in business and financial operations occupations:
Here: 25.0% city: 8.2%
- Percentage of females in computer and mathematical occupations:
Here: 7.3% city: 3.0%
- Percentage of females in architecture and engineering occupations:
Here: 2.2% city: 1.6%
- Percentage of females in community and social services occupations:
Here: 3.8% city: 3.7%
- Percentage of females in education, training, and library occupations:
Here: 3.5% city: 8.4%
- Percentage of females in healthcare practitioners and technical occupations:
Here: 7.3% city: 6.7%
- Percentage of females in service occupations:
Here: 34.7% city: 17.8%
- Percentage of females in sales and office occupations:
Here: 5.1% city: 20.0%
- Percentage of females in production occupations:
Here: 3.1% city: 2.4%
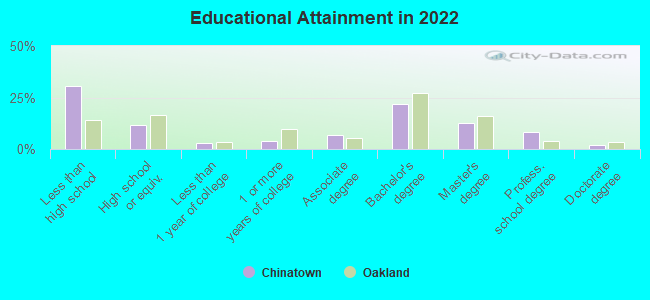
Education in this neighborhood (subdivision or community):
- Percentage of people 3 years and older in K-12 schools:
Chinatown: 9.1% Oakland: 13.0%
- Percentage of people 3 years and older in undergraduate colleges:
Chinatown: 6.5% Oakland: 4.3%
- Percentage of people 3 years and older in grad. or professional schools:
Chinatown: 3.7% Oakland: 1.8%
- Percentage of students K-12 enrolled in private schools:
Chinatown: 35.9% Oakland: 15.8%
Percentage of population below poverty level:
| Chinatown: | 29.4% |
| Oakland: | 13.9% |
Median year renter moved in (as recorded in 2022):
| Chinatown: | 2015 |
| Oakland: | 2018 |
Percentage of married-couple families with both working:
| Chinatown: | 97.0% |
| Oakland: | 73.2% |
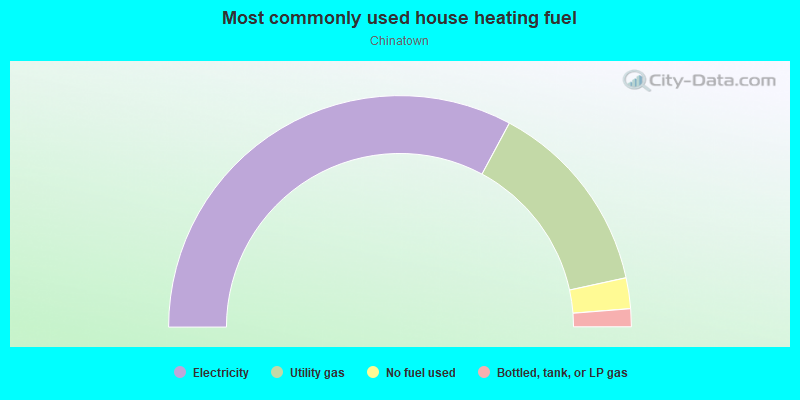
- 65.7%Electricity
- 27.5%Utility gas
- 4.3%No fuel used
- 2.5%Bottled, tank, or LP gas
Roads and streets:
9th St
Length: 0.62 miles
Directions: E-W, SE-NW
Address range: 100 to 449
Directions: E-W, SE-NW
Address range: 100 to 449
8th St
Length: 0.62 miles
Directions: E-W, SE-NW
Address range: 101 to 448
Directions: E-W, SE-NW
Address range: 101 to 448
7th St
Length: 0.62 miles
Directions: E-W, SE-NW
Address range: 100 to 448
Directions: E-W, SE-NW
Address range: 100 to 448
10th St
Length: 0.54 miles
Directions: E-W, N-S, SE-NW
Address range: 100 to 448
Directions: E-W, N-S, SE-NW
Address range: 100 to 448
11th St
Length: 0.53 miles
Directions: E-W, SE-NW
Address range: 149 to 399
Directions: E-W, SE-NW
Address range: 149 to 399
Broadway
Length: 0.48 miles
Direction: SW-NE
Address range: 700 to 1099
Direction: SW-NE
Address range: 700 to 1099
Madison St
Length: 0.28 miles
Direction: SW-NE
Address range: 600 to 1099
Direction: SW-NE
Address range: 600 to 1099
Oak St
Length: 0.23 miles
Direction: SW-NE
Address range: 600 to 999
Direction: SW-NE
Address range: 600 to 999
Franklin St
Length: 0.22 miles
Direction: SW-NE
Address range: 700 to 1610
Direction: SW-NE
Address range: 700 to 1610
Webster St
Length: 0.22 miles
Direction: SW-NE
Address range: 700 to 1099
Direction: SW-NE
Address range: 700 to 1099
Harrison St
Length: 0.22 miles
Direction: SW-NE
Address range: 700 to 1099
Direction: SW-NE
Address range: 700 to 1099
Jackson St
Length: 0.22 miles
Direction: SW-NE
Address range: 700 to 1099
Direction: SW-NE
Address range: 700 to 1099
Alice St
Length: 0.17 miles
Direction: SW-NE
Address range: 700 to 999
Direction: SW-NE
Address range: 700 to 999
10th
Length: 0.09 miles
Directions: E-W, SE-NW
Directions: E-W, SE-NW
6th St
Length: 0.09 miles
Directions: E-W, SE-NW
Address range: 100 to 150
Directions: E-W, SE-NW
Address range: 100 to 150