Columbia Point neighborhood in Richland, Washington (WA), 99352 detailed profile
Settings
X


Business Search - 14 Million verified businesses
Area: 0.948 square miles
Population: 3,645
Population density:
| Columbia Point: | 3,845 people per square mile |
| Richland: | 1,748 people per square mile |

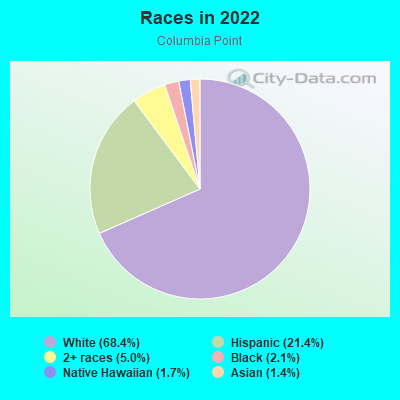
- 2,52868.4%White
- 79121.4%Hispanic or Latino
- 1865.0%Two or more races
- 772.1%Black
- 641.7%Native Hawaiian and Other
Pacific Islander - 511.4%Asian
- 10.03%Some other race
Median household income in 2022:
| Columbia Point: | $98,080 |
| Richland: | $89,283 |
Distribution of median household income
![Distribution of median household income]()
- 29Less than $10,000
- 158$10,000 to $19,999
- 88$20,000 to $29,999
- 43$30,000 to $39,999
- 15$40,000 to $49,999
- 95$50,000 to $59,999
- 140$60,000 to $74,999
- 397$75,000 to $99,999
- 88$100,000 to $124,999
- 94$125,000 to $149,999
- 75$150,000 to $199,999
- 65$200,000 or more

Distribution of owner-occupied house/condo value
![Distribution of owner-occupied house/condo value]()
- 29Less than $50,000
- 336$150,000 to $199,999
- 126$200,000 to $249,999
- 126$250,000 to $299,999
- 239$300,000 to $399,999
- 43$400,000 to $499,999
- 65$500,000 to $749,999
- 16$750,000 to $999,999
- 58$1,000,000 or more

Distribution of rent paid by renters
![Distribution of rent paid by renters]()
- 1$200 to $299
- 102$300 to $399
- 1$400 to $499
- 65$500 to $599
- 1$700 to $799
- 57$800 to $899
- 50$900 to $999
- 148$1,000 to $1,249
- 101$1,250 to $1,499
- 9$1,500 to $1,999

Median rent in 2022:
| Columbia Point: | $907 |
| Richland: | $1,145 |
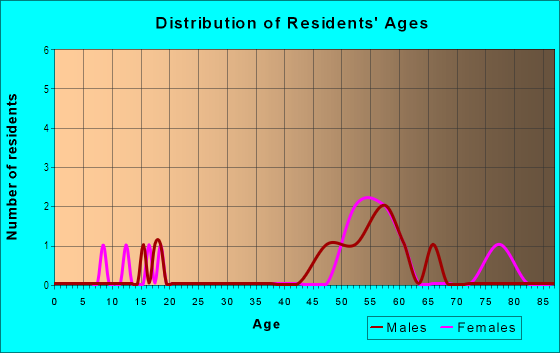
| Males: | 2,069 |
| Females: | 1,575 |
Males:
| This neighborhood: | 33.2 years |
| Whole city: | 35.0 years |
| This neighborhood: | 29.7 years |
| Whole city: | 39.1 years |
Average household size:
| Columbia Point: | 2.9 people |
| Richland: | 2.5 people |
Percentage of family households:
| Columbia Point: | 51.7% |
| Richland: | 46.0% |
| Here: | 35.0% |
| Richland: | 46.9% |
Percentage of married-couple families with children (among all households):
| Columbia Point: | 9.2% |
| Richland: | 26.4% |
Percentage of single-mother households (among all households):
| Columbia Point: | 2.3% |
| Richland: | 9.1% |
Percentage of never married males 15 years old and over:
Percentage of never married females 15 years old and over:
| Columbia Point: | 22.5% |
| Richland: | 18.2% |
Percentage of never married females 15 years old and over:
| Columbia Point: | 18.1% |
| city: | 14.0% |
Percentage of people that speak English not well or not at all:
| Columbia Point: | 0.0% |
| Richland: | 1.4% |
Percentage of people born in this state:
Percentage of people born in another U.S. state:
Percentage of native residents but born outside the U.S.:
Percentage of foreign born residents:
| Here: | 56.4% |
| Richland: | 49.4% |
Percentage of people born in another U.S. state:
| Columbia Point: | 35.3% |
| Richland: | 40.4% |
Percentage of native residents but born outside the U.S.:
| Here: | 1.8% |
| city: | 1.4% |
Percentage of foreign born residents:
| Here: | 6.4% |
| Richland: | 8.9% |
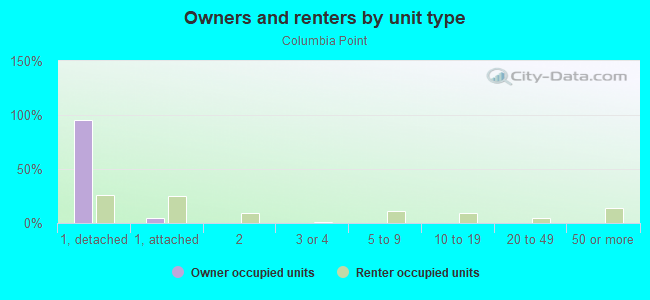
Owner-occupied
Renter-occupied

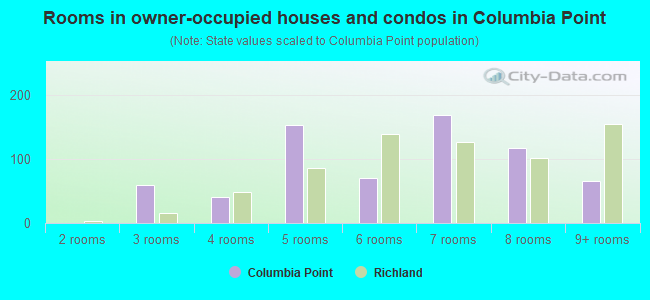
- Rooms in owner-occupied houses and condos in Columbia Point
- 01 room
- 02 rooms
- 603 rooms
- 404 rooms
- 1545 rooms
- 716 rooms
- 1697 rooms
- 1178 rooms
- 659+ rooms
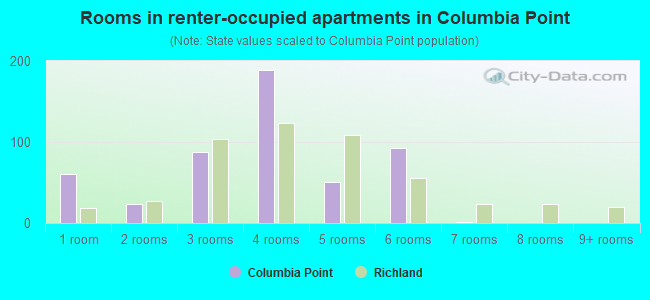
- Rooms in renter-occupied apartments in Columbia Point
- 601 room
- 242 rooms
- 883 rooms
- 1894 rooms
- 515 rooms
- 936 rooms
- 17 rooms
- 08 rooms
- 09+ rooms
Owner-occupied
Renter-occupied
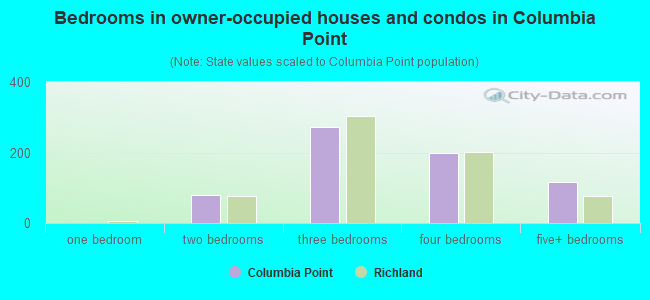
- Bedrooms in owner-occupied houses and condos in Columbia Point
- 0no bedroom
- 01 bedroom
- 802 bedrooms
- 2713 bedrooms
- 1994 bedrooms
- 1175+ bedrooms
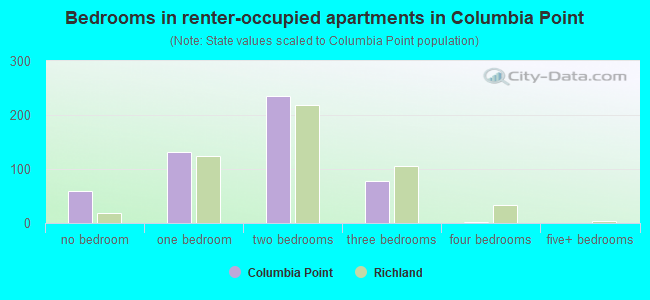
- Bedrooms in renter-occupied apartments in Columbia Point
- 60no bedroom
- 1311 bedroom
- 2362 bedrooms
- 773 bedrooms
- 14 bedrooms
- 05+ bedrooms
Average number of cars or other vehicles available in houses/condos:
Average number of cars or other vehicles available in apartments:
| This neighborhood: | 2.4 |
| Richland: | 2.2 |
Average number of cars or other vehicles available in apartments:
| Here: | 1.9 |
| city: | 1.5 |
Percentage of units with a mortgage:
| Columbia Point: | 70.9% |
| Richland: | 62.9% |
Average estimated value of detached houses in 2022 (63.1% of all units):
| Columbia Point: | $481,353 |
| Washington: | $734,307 |
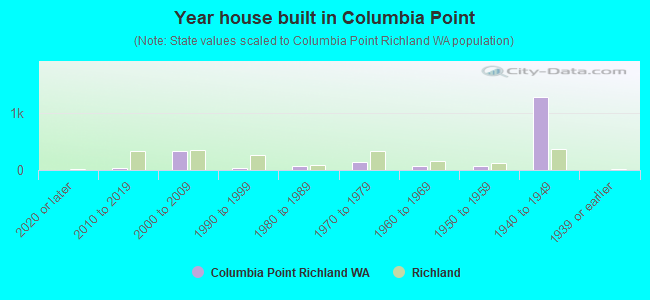
- Year house built in Columbia Point
- 02020 or later
- 412010 to 2019
- 3242000 to 2009
- 411990 to 1999
- 721980 to 1989
- 1471970 to 1979
- 751960 to 1969
- 761950 to 1959
- 1,2661940 to 1949
- 11939 or earlier
City-data.com crime index for city in 2020 (higher means more crime):
| City: | 223.6 |
| U.S. average: | 219.5 |
Travel time to work (commute)
![Travel time to work (commute)]()
- 2Less than 5 minutes
- 55 to 9 minutes
- 1510 to 14 minutes
- 1515 to 19 minutes
- 920 to 24 minutes
- 130 to 34 minutes
- 445 to 59 minutes

Means of transportation to work
![Means of transportation to work]()
- 89.5%1,177Drove a car alone
- 4.8%63Carpooled
- 6.4%84Walked
- 1.7%23Worked at home

Time leaving home to go to work
![Time leaving home to go to work]()
- 312:00 a.m. to 4:59 a.m.
- 25:00 a.m. to 5:29 a.m.
- 35:30 a.m. to 5:59 a.m.
- 26:00 a.m. to 6:29 a.m.
- 86:30 a.m. to 6:59 a.m.
- 67:00 a.m. to 7:29 a.m.
- 77:30 a.m. to 7:59 a.m.
- 68:00 a.m. to 8:29 a.m.
- 59:00 a.m. to 9:59 a.m.
- 110:00 a.m. to 10:59 a.m.
- 211:00 a.m. to 11:59 a.m.
- 212:00 p.m. to 3:59 p.m.
- 14:00 p.m. to 11:59 p.m.

Occupations of males:
- Percentage of males in management occupations (except farmers):
Here: 19.5% city: 12.7%
- Percentage of males in life, physical, and social science occupations:
Here: 280.1% city: 8.1%
- Percentage of males in education, training, and library occupations:
Here: 252.1% city: 3.6%
- Percentage of males in arts, design, entertainment, sports, and media occupations:
Here: 322.1% city: 1.3%
- Percentage of males in healthcare practitioners and technical occupations:
Here: 1.3% city: 5.0%
- Percentage of males in service occupations:
Here: 7.8% city: 8.5%
- Percentage of males in sales and office occupations:
Here: 10.8% city: 9.2%
- Percentage of males in farming, fishing, and forestry occupations:
Here: 7.2% city: 0.2%
- Percentage of males in construction, extraction, and maintenance occupations:
Here: 23.2% city: 7.1%
- Percentage of males in transportation occupations:
Here: 26.9% city: 5.3%
Occupations of females:
- Percentage of females in management occupations (except farmers):
Here: 1.3% city: 11.4%
- Percentage of females in business and financial operations occupations:
Here: 295.9% city: 7.6%
- Percentage of females in life, physical, and social science occupations:
Here: 55.1% city: 3.9%
- Percentage of females in community and social services occupations:
Here: 8.8% city: 2.6%
- Percentage of females in legal occupations:
Here: 151.4% city: 1.8%
- Percentage of females in education, training, and library occupations:
Here: 4.5% city: 12.0%
- Percentage of females in arts, design, entertainment, sports, and media occupations:
Here: 5.4% city: 1.8%
- Percentage of females in healthcare practitioners and technical occupations:
Here: 1.4% city: 9.5%
- Percentage of females in service occupations:
Here: 42.9% city: 17.4%
- Percentage of females in sales and office occupations:
Here: 19.2% city: 23.3%
- Percentage of females in farming, fishing, and forestry occupations:
Here: 6.6% city: 0.2%
- Percentage of females in production occupations:
Here: 55.1% city: 1.0%
- Percentage of females in transportation occupations:
Here: 55.1% city: 1.0%
- Percentage of females in material moving occupations:
Here: 9.2% city: 1.7%
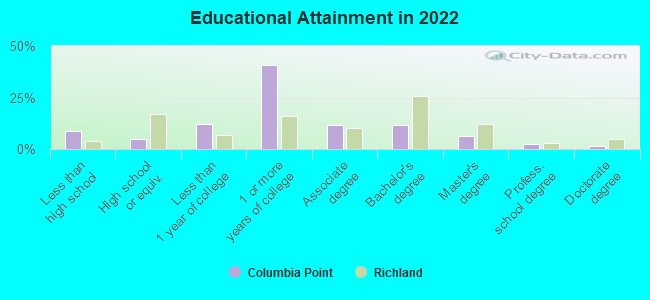
Education in this neighborhood (subdivision or community):
- Percentage of people 3 years and older in K-12 schools:
Columbia Point: 20.8% Richland: 18.9%
- Percentage of people 3 years and older in undergraduate colleges:
Columbia Point: 3.3% Richland: 3.9%
- Percentage of people 3 years and older in grad. or professional schools:
Columbia Point: 2.4% Richland: 1.5%
- Percentage of students K-12 enrolled in private schools:
Columbia Point: 9.4% Richland: 7.9%
Percentage of population below poverty level:
| Columbia Point: | 11.9% |
| Richland: | 7.5% |
Median year owner moved in (as recorded in 2022):
Median year renter moved in (as recorded in 2022):
| Columbia Point: | 2007 |
| Richland: | 2011 |
Median year renter moved in (as recorded in 2022):
| Columbia Point: | 2019 |
| Richland: | 2018 |
Percentage of married-couple families with both working:
| Columbia Point: | 92.5% |
| Richland: | 69.6% |
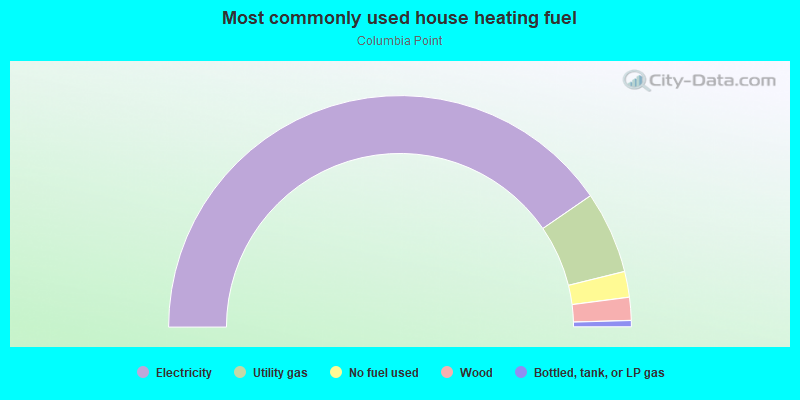
- 80.8%Electricity
- 11.5%Utility gas
- 3.6%No fuel used
- 3.2%Wood
- 0.9%Bottled, tank, or LP gas
Limited-access highways (interstate or state) in this neighborhood:
US Hwy 12 (I- 182, US Rte 12)
Length: 1.65 miles
Directions: E-W, SW-NE
Directions: E-W, SW-NE
Highways in this neighborhood:
State Hwy 240 (George Washington Way)
Length: 0.29 miles
Direction: SE-NW
Direction: SE-NW
Roads and streets:
I 182
Length: 1.22 miles
Directions: E-W, SW-NE
Directions: E-W, SW-NE
Bradley Blvd
Length: 1.07 miles
Directions: E-W, N-S, SE-NW
Directions: E-W, N-S, SE-NW
Columbia Point Dr
Length: 0.85 miles
Directions: E-W, SW-NE
Address range: 381 to 499
Directions: E-W, SW-NE
Address range: 381 to 499