Convention neighborhood in Tucson, Arizona (AZ), 85701 detailed profile
Settings
X


Business Search - 14 Million verified businesses
Area: 0.171 square miles
Population: 362
Population density:
| Convention: | 2,118 people per square mile |
| Tucson: | 2,808 people per square mile |

- 20354.7%White
- 11932.1%Hispanic or Latino
- 205.4%Two or more races
- 154.0%Asian
- 102.7%American Indian
- 41.1%Black

Median household income in 2022:
| Convention: | $38,093 |
| Tucson: | $51,281 |
Distribution of median household income
![Distribution of median household income]()
- 67Less than $10,000
- 27$10,000 to $19,999
- 39$20,000 to $29,999
- 41$30,000 to $39,999
- 25$40,000 to $49,999
- 20$50,000 to $59,999
- 38$60,000 to $74,999
- 14$75,000 to $99,999
- 16$100,000 to $124,999
- 10$125,000 to $149,999
- 10$150,000 to $199,999
- 3$200,000 or more

Distribution of owner-occupied house/condo value
![Distribution of owner-occupied house/condo value]()
- 57$50,000 to $99,999
- 17$100,000 to $149,999
- 37$150,000 to $199,999
- 10$200,000 to $249,999
- 4$250,000 to $299,999
- 20$300,000 to $399,999
- 5$400,000 to $499,999
- 2$500,000 to $749,999

Distribution of rent paid by renters
![Distribution of rent paid by renters]()
- 6Less than $100
- 6$100 to $199
- 24$200 to $299
- 9$300 to $399
- 55$400 to $499
- 60$500 to $599
- 32$600 to $699
- 33$700 to $799
- 6$800 to $899
- 23$900 to $999
- 92$1,000 to $1,249
- 7$1,250 to $1,499
- 32$1,500 to $1,999
- 22$2,000 or more

Median rent in 2022:
| Convention: | $1,029 |
| Tucson: | $912 |
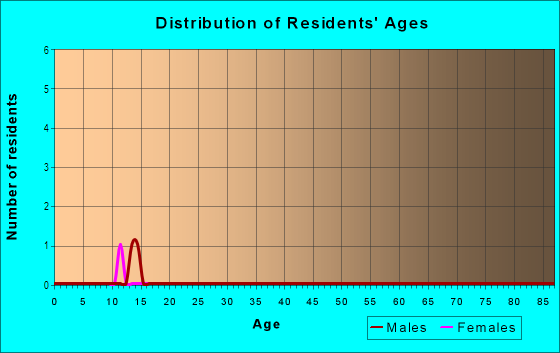
| Males: | 205 |
| Females: | 157 |
Males:
| This neighborhood: | 37.7 years |
| Whole city: | 33.1 years |
| This neighborhood: | 31.6 years |
| Whole city: | 34.8 years |
Average household size:
| Convention: | 1.6 people |
| Tucson: | 2.3 people |
Percentage of family households:
| Convention: | 5.6% |
| Tucson: | 37.6% |
| Here: | 6.4% |
| Tucson: | 31.5% |
Percentage of married-couple families with children (among all households):
| Convention: | 25.8% |
| Tucson: | 24.4% |
Percentage of single-mother households (among all households):
| Convention: | 512.1% |
| Tucson: | 12.1% |
Percentage of never married males 15 years old and over:
Percentage of never married females 15 years old and over:
| Convention: | 42.3% |
| Tucson: | 24.8% |
Percentage of never married females 15 years old and over:
| Convention: | 26.0% |
| city: | 20.6% |
Percentage of people that speak English not well or not at all:
| Convention: | 2.2% |
| Tucson: | 4.5% |
Percentage of people born in this state:
Percentage of people born in another U.S. state:
Percentage of native residents but born outside the U.S.:
Percentage of foreign born residents:
| Here: | 32.9% |
| Tucson: | 46.2% |
Percentage of people born in another U.S. state:
| Convention: | 56.8% |
| Tucson: | 38.2% |
Percentage of native residents but born outside the U.S.:
| Here: | 2.0% |
| city: | 1.8% |
Percentage of foreign born residents:
| Here: | 8.3% |
| Tucson: | 13.7% |

Owner-occupied
Renter-occupied


- Rooms in owner-occupied houses and condos in Convention
- 01 room
- 02 rooms
- 373 rooms
- 384 rooms
- 225 rooms
- 46 rooms
- 137 rooms
- 18 rooms
- 69+ rooms

- Rooms in renter-occupied apartments in Convention
- 1071 room
- 462 rooms
- 783 rooms
- 314 rooms
- 85 rooms
- 26 rooms
- 117 rooms
- 08 rooms
- 09+ rooms
Owner-occupied
Renter-occupied

- Bedrooms in owner-occupied houses and condos in Convention
- 0no bedroom
- 481 bedroom
- 452 bedrooms
- 63 bedrooms
- 184 bedrooms
- 05+ bedrooms

- Bedrooms in renter-occupied apartments in Convention
- 107no bedroom
- 1131 bedroom
- 482 bedrooms
- 43 bedrooms
- 64 bedrooms
- 05+ bedrooms
Average number of cars or other vehicles available in houses/condos:
Average number of cars or other vehicles available in apartments:
| This neighborhood: | 14.2 |
| Tucson: | 1.9 |
Average number of cars or other vehicles available in apartments:
| Here: | 0.5 |
| city: | 1.3 |
Percentage of units with a mortgage:
| Convention: | 29.0% |
| Tucson: | 59.8% |

- Year house built in Convention
- 32020 or later
- 822010 to 2019
- 72000 to 2009
- 441990 to 1999
- 11980 to 1989
- 631970 to 1979
- 1091960 to 1969
- 201950 to 1959
- 51940 to 1949
- 811939 or earlier

City-data.com crime index for city in 2020 (higher means more crime):
| City: | 397.7 |
| U.S. average: | 219.5 |
Travel time to work (commute)
![Travel time to work (commute)]()
- 2Less than 5 minutes
- 325 to 9 minutes
- 2910 to 14 minutes
- 1715 to 19 minutes
- 8020 to 24 minutes
- 1425 to 29 minutes
- 730 to 34 minutes
- 1035 to 39 minutes
- 440 to 44 minutes
- 445 to 59 minutes
- 1760 to 89 minutes
- 690 or more minutes

Means of transportation to work
![Means of transportation to work]()
- 62.0%139Drove a car alone
- 1.3%3Carpooled
- 1.8%4Bus
- 17.8%40Light rail, streetcar or trolley
- 2.2%5Bicycle
- 5.4%12Walked
- 10.3%23Worked at home

Time leaving home to go to work
![Time leaving home to go to work]()
- 812:00 a.m. to 4:59 a.m.
- 55:00 a.m. to 5:29 a.m.
- 205:30 a.m. to 5:59 a.m.
- 36:00 a.m. to 6:29 a.m.
- 216:30 a.m. to 6:59 a.m.
- 307:00 a.m. to 7:29 a.m.
- 217:30 a.m. to 7:59 a.m.
- 108:00 a.m. to 8:29 a.m.
- 518:30 a.m. to 8:59 a.m.
- 99:00 a.m. to 9:59 a.m.
- 210:00 a.m. to 10:59 a.m.
- 1512:00 p.m. to 3:59 p.m.
- 44:00 p.m. to 11:59 p.m.

Occupations of males:
- Percentage of males in management occupations (except farmers):
Here: 6.5% city: 7.7%
- Percentage of males in computer and mathematical occupations:
Here: 3.8% city: 4.5%
- Percentage of males in architecture and engineering occupations:
Here: 4.4% city: 4.0%
- Percentage of males in life, physical, and social science occupations:
Here: 6.5% city: 1.1%
- Percentage of males in community and social services occupations:
Here: 9.7% city: 1.0%
- Percentage of males in legal occupations:
Here: 1.6% city: 0.6%
- Percentage of males in education, training, and library occupations:
Here: 16.1% city: 4.7%
- Percentage of males in arts, design, entertainment, sports, and media occupations:
Here: 1.1% city: 1.6%
- Percentage of males in service occupations:
Here: 2.7% city: 20.4%
- Percentage of males in sales and office occupations:
Here: 7.2% city: 16.2%
- Percentage of males in material moving occupations:
Here: 29.1% city: 5.3%
Occupations of females:
- Percentage of females in management occupations (except farmers):
Here: 13.4% city: 8.2%
- Percentage of females in computer and mathematical occupations:
Here: 4.0% city: 1.6%
- Percentage of females in architecture and engineering occupations:
Here: 4.6% city: 0.6%
- Percentage of females in life, physical, and social science occupations:
Here: 4.6% city: 1.1%
- Percentage of females in community and social services occupations:
Here: 7.3% city: 2.9%
- Percentage of females in legal occupations:
Here: 4.9% city: 1.0%
- Percentage of females in education, training, and library occupations:
Here: 7.4% city: 8.8%
- Percentage of females in healthcare practitioners and technical occupations:
Here: 2.7% city: 8.3%
- Percentage of females in service occupations:
Here: 34.7% city: 24.9%
- Percentage of females in sales and office occupations:
Here: 7.9% city: 29.9%
- Percentage of females in material moving occupations:
Here: 13.3% city: 2.1%
Percentage of people 16-64 in Armed Forces:
| Convention: | 1.0% |
| Tucson: | 1.8% |
Education in this neighborhood (subdivision or community):
- Percentage of people 3 years and older in K-12 schools:
Convention: 20.4% Tucson: 15.1%
- Percentage of people 3 years and older in undergraduate colleges:
Convention: 20.7% Tucson: 9.7%
- Percentage of people 3 years and older in grad. or professional schools:
Convention: 5.5% Tucson: 2.1%
- Percentage of students K-12 enrolled in private schools:
Convention: 0.0% Tucson: 9.2%
Percentage of population below poverty level:
| Convention: | 40.3% |
| Tucson: | 19.2% |
Median year renter moved in (as recorded in 2022):
| Convention: | 2016 |
| Tucson: | 2020 |
Percentage of married-couple families with both working:
| Convention: | 100.0% |
| Tucson: | 63.0% |

- 47.3%Electricity
- 43.6%Utility gas
- 3.7%No fuel used
- 2.7%Bottled, tank, or LP gas
- 2.7%Wood
Roads and streets:
W Cushing St
Length: 0.41 miles
Directions: E-W, SE-NW
Address range: 1 to 499
Directions: E-W, SE-NW
Address range: 1 to 499
S Freeway Rd (S Fwy)
Length: 0.32 miles
Direction: N-S
Address range: 101 to 449
Direction: N-S
Address range: 101 to 449
S Church Ave
Length: 0.28 miles
Direction: N-S
Address range: 100 to 299
Direction: N-S
Address range: 100 to 299
I- 10 Bus (S Stone Ave)
Length: 0.27 miles
Direction: N-S
Address range: 50 to 339
Direction: N-S
Address range: 50 to 339
S Granada Ave
Length: 0.25 miles
Directions: N-S, SW-NE
Address range: 100 to 599
Directions: N-S, SW-NE
Address range: 100 to 599
W 14th St
Length: 0.12 miles
Direction: E-W
Address range: 1 to 99
Direction: E-W
Address range: 1 to 99
W Mc Cormick St
Length: 0.11 miles
Direction: E-W
Address range: 1 to 99
Direction: E-W
Address range: 1 to 99
W Corral St
Length: 0.11 miles
Direction: E-W
Address range: 1 to 99
Direction: E-W
Address range: 1 to 99
S Sentinel Ave
Length: 0.11 miles
Direction: N-S
Address range: 200 to 399
Direction: N-S
Address range: 200 to 399
W Ochoa St
Length: 0.11 miles
Direction: E-W
Address range: 1 to 99
Direction: E-W
Address range: 1 to 99
W Jackson St
Length: 0.10 miles
Direction: E-W
Address range: 1 to 99
Direction: E-W
Address range: 1 to 99
W Cll Carlos Arruza
Length: 0.10 miles
Direction: E-W
Address range: 200 to 399
Direction: E-W
Address range: 200 to 399
W Gramada Ave
Length: 0.09 miles
Directions: E-W, SW-NE
Address range: 600 to 699
Directions: E-W, SW-NE
Address range: 600 to 699
W Broadway Blvd
Length: 0.09 miles
Direction: E-W
Address range: 1 to 71
Direction: E-W
Address range: 1 to 71
W Congress St
Length: 0.06 miles
Direction: E-W
Address range: 450 to 499
Direction: E-W
Address range: 450 to 499
S Central Ave
Length: 0.06 miles
Direction: N-S
Address range: 1 to 99
Direction: N-S
Address range: 1 to 99
W Arcade St
Length: 0.06 miles
Direction: E-W
Address range: 400 to 499
Direction: E-W
Address range: 400 to 499
W Alamogordo St
Length: 0.05 miles
Direction: E-W
Address range: 400 to 499
Direction: E-W
Address range: 400 to 499
S Circle Dr
Length: 0.05 miles
Directions: N-S, SW-NE
Address range: 2 to 99
Directions: N-S, SW-NE
Address range: 2 to 99
W Mesa St
Length: 0.03 miles
Direction: E-W
Address range: 600 to 699
Direction: E-W
Address range: 600 to 699
W Circle Dr
Length: 0.02 miles
Direction: E-W
Address range: 400 to 499
Direction: E-W
Address range: 400 to 499
Railroad features:
Union Pacific RR
Length: 0.31 miles
Directions: N-S, SE-NW
Directions: N-S, SE-NW