Copper Ridge neighborhood in Lakeland, Florida (FL), 33810 detailed profile
Settings
X


Business Search - 14 Million verified businesses
Area: 0.159 square miles
Population: 1,494
Population density:
| Copper Ridge: | 9,393 people per square mile |
| Lakeland: | 2,619 people per square mile |

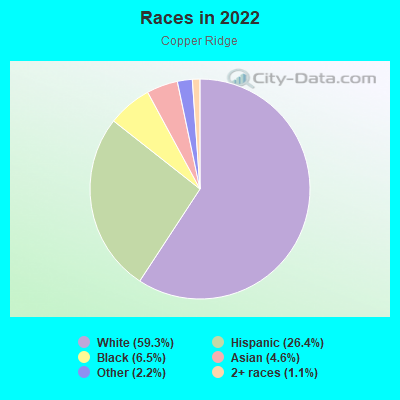
- 94559.3%White
- 42126.4%Hispanic or Latino
- 1036.5%Black
- 734.6%Asian
- 352.2%Some other race
- 171.1%Two or more races
Median household income in 2022:
| Copper Ridge: | $121,431 |
| Lakeland: | $58,524 |
Distribution of median household income
![Distribution of median household income]()
- 18Less than $10,000
- 43$10,000 to $19,999
- 89$20,000 to $29,999
- 68$30,000 to $39,999
- 53$40,000 to $49,999
- 46$50,000 to $59,999
- 66$60,000 to $74,999
- 80$75,000 to $99,999
- 182$100,000 to $124,999
- 41$125,000 to $149,999
- 22$150,000 to $199,999
- 30$200,000 or more

Distribution of owner-occupied house/condo value
![Distribution of owner-occupied house/condo value]()
- 252Less than $50,000
- 210$50,000 to $99,999
- 45$100,000 to $149,999
- 58$150,000 to $199,999
- 181$200,000 to $249,999
- 41$250,000 to $299,999
- 35$300,000 to $399,999
- 15$400,000 to $499,999
- 16$500,000 to $749,999
- 4$750,000 to $999,999
- 8$1,000,000 or more

Distribution of rent paid by renters
![Distribution of rent paid by renters]()
- 18$400 to $499
- 16$500 to $599
- 11$600 to $699
- 46$700 to $799
- 25$1,000 to $1,249
- 14$1,250 to $1,499
- 64$1,500 to $1,999
- 24$2,000 or more

Median rent in 2022:
| Copper Ridge: | $2,112 |
| Lakeland: | $1,113 |
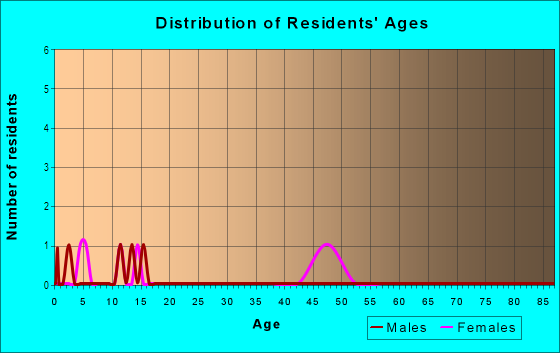
| Males: | 644 |
| Females: | 850 |
Males:
| This neighborhood: | 41.2 years |
| Whole city: | 36.6 years |
| This neighborhood: | 56.3 years |
| Whole city: | 43.9 years |
Average household size:
| Copper Ridge: | 3.3 people |
| Lakeland: | 2.2 people |
Percentage of family households:
| Copper Ridge: | 34.9% |
| Lakeland: | 37.2% |
| Here: | 45.3% |
| Lakeland: | 39.0% |
Percentage of married-couple families with children (among all households):
| Copper Ridge: | 34.1% |
| Lakeland: | 28.4% |
Percentage of single-mother households (among all households):
| Copper Ridge: | 11.6% |
| Lakeland: | 9.0% |
Percentage of never married males 15 years old and over:
Percentage of never married females 15 years old and over:
| Copper Ridge: | 19.5% |
| Lakeland: | 17.7% |
Percentage of never married females 15 years old and over:
| Copper Ridge: | 20.4% |
| city: | 17.5% |
Percentage of people that speak English not well or not at all:
| Copper Ridge: | 2.9% |
| Lakeland: | 3.4% |
Percentage of people born in this state:
Percentage of people born in another U.S. state:
Percentage of native residents but born outside the U.S.:
Percentage of foreign born residents:
| Here: | 35.1% |
| Lakeland: | 44.9% |
Percentage of people born in another U.S. state:
| Copper Ridge: | 44.1% |
| Lakeland: | 39.1% |
Percentage of native residents but born outside the U.S.:
| Here: | 4.2% |
| city: | 6.1% |
Percentage of foreign born residents:
| Here: | 16.6% |
| Lakeland: | 10.0% |
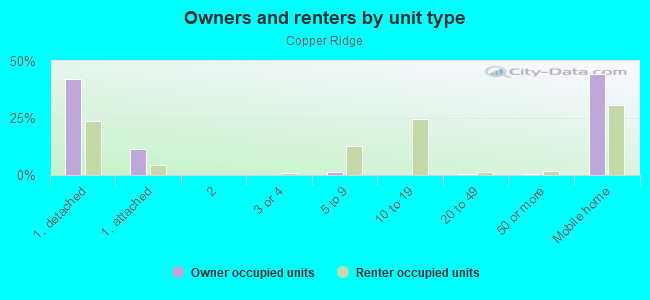
Owner-occupied
Renter-occupied

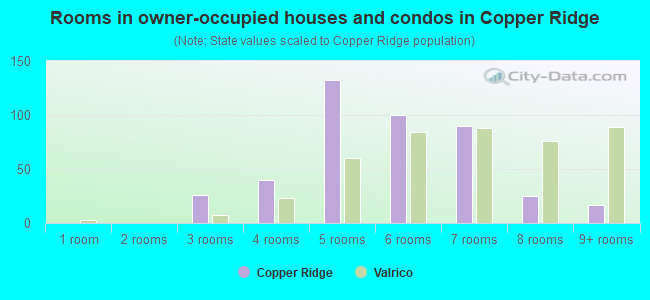
- Rooms in owner-occupied houses and condos in Copper Ridge
- 01 room
- 02 rooms
- 263 rooms
- 404 rooms
- 1325 rooms
- 1006 rooms
- 907 rooms
- 258 rooms
- 179+ rooms
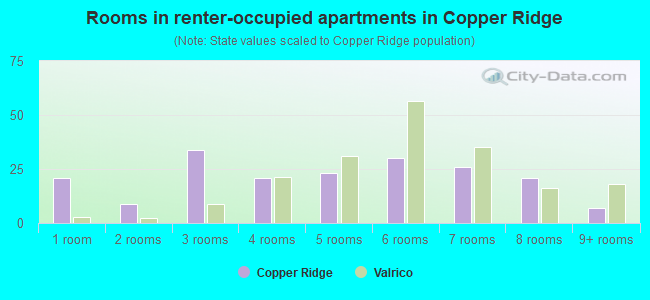
- Rooms in renter-occupied apartments in Copper Ridge
- 211 room
- 92 rooms
- 343 rooms
- 214 rooms
- 235 rooms
- 306 rooms
- 267 rooms
- 218 rooms
- 79+ rooms
Owner-occupied
Renter-occupied
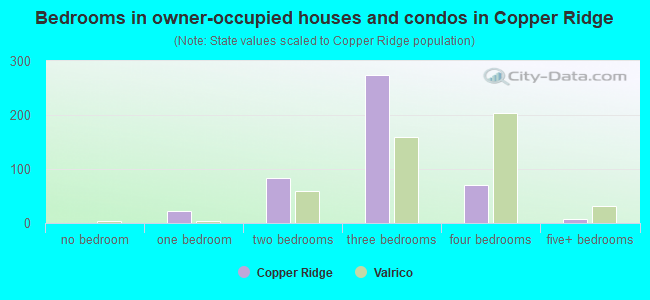
- Bedrooms in owner-occupied houses and condos in Copper Ridge
- 0no bedroom
- 231 bedroom
- 832 bedrooms
- 2753 bedrooms
- 714 bedrooms
- 75+ bedrooms
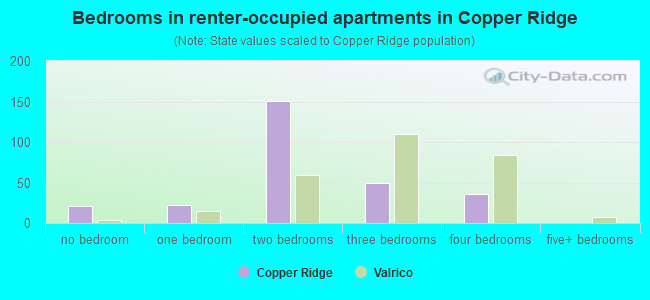
- Bedrooms in renter-occupied apartments in Copper Ridge
- 21no bedroom
- 221 bedroom
- 1512 bedrooms
- 493 bedrooms
- 364 bedrooms
- 05+ bedrooms
Average number of cars or other vehicles available in houses/condos:
Average number of cars or other vehicles available in apartments:
| This neighborhood: | 1.8 |
| Lakeland: | 1.8 |
Average number of cars or other vehicles available in apartments:
| Here: | 2.1 |
| city: | 1.1 |
Percentage of units with a mortgage:
| Copper Ridge: | 64.0% |
| Lakeland: | 50.4% |
Average estimated value of detached houses in 2022 (77.1% of all units):
| Copper Ridge: | $233,167 |
| Lakeland: | $231,452 |
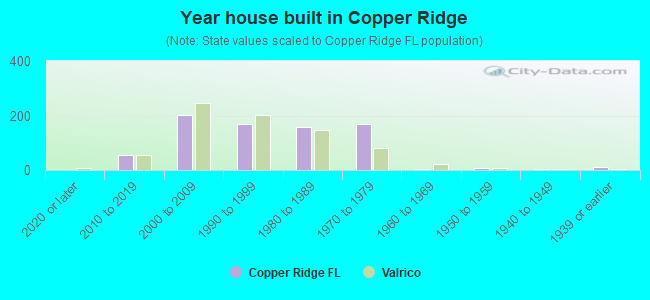
- Year house built in Copper Ridge
- 02020 or later
- 552010 to 2019
- 2022000 to 2009
- 1681990 to 1999
- 1561980 to 1989
- 1681970 to 1979
- 21960 to 1969
- 61950 to 1959
- 41940 to 1949
- 121939 or earlier
City-data.com crime index for city in 2020 (higher means more crime):
| City: | 242.4 |
| U.S. average: | 219.5 |
Travel time to work (commute)
![Travel time to work (commute)]()
- 13Less than 5 minutes
- 45 to 9 minutes
- 9210 to 14 minutes
- 4115 to 19 minutes
- 17020 to 24 minutes
- 3225 to 29 minutes
- 24530 to 34 minutes
- 3035 to 39 minutes
- 14240 to 44 minutes
- 6045 to 59 minutes
- 10260 to 89 minutes
- 1890 or more minutes

Means of transportation to work
![Means of transportation to work]()
- 59.9%536Drove a car alone
- 27.5%246Carpooled
- 0.3%3Bus
- 0.6%5Taxi
- 0.8%7Other means
- 12.4%111Worked at home

Time leaving home to go to work
![Time leaving home to go to work]()
- 9712:00 a.m. to 4:59 a.m.
- 575:00 a.m. to 5:29 a.m.
- 205:30 a.m. to 5:59 a.m.
- 486:00 a.m. to 6:29 a.m.
- 1206:30 a.m. to 6:59 a.m.
- 2187:00 a.m. to 7:29 a.m.
- 897:30 a.m. to 7:59 a.m.
- 978:00 a.m. to 8:29 a.m.
- 158:30 a.m. to 8:59 a.m.
- 1159:00 a.m. to 9:59 a.m.
- 710:00 a.m. to 10:59 a.m.
- 611:00 a.m. to 11:59 a.m.
- 4312:00 p.m. to 3:59 p.m.
- 1154:00 p.m. to 11:59 p.m.

Occupations of males:
- Percentage of males in management occupations (except farmers):
Here: 6.7% city: 8.9%
- Percentage of males in business and financial operations occupations:
Here: 5.0% city: 5.6%
- Percentage of males in computer and mathematical occupations:
Here: 1.9% city: 4.1%
- Percentage of males in life, physical, and social science occupations:
Here: 2.4% city: 0.9%
- Percentage of males in legal occupations:
Here: 5.2% city: 0.7%
- Percentage of males in healthcare practitioners and technical occupations:
Here: 2.2% city: 3.6%
- Percentage of males in service occupations:
Here: 39.1% city: 15.7%
- Percentage of males in sales and office occupations:
Here: 31.2% city: 14.7%
- Percentage of males in farming, fishing, and forestry occupations:
Here: 1.6% city: 0.4%
- Percentage of males in construction, extraction, and maintenance occupations:
Here: 4.3% city: 7.2%
- Percentage of males in production occupations:
Here: 1.0% city: 6.6%
Occupations of females:
- Percentage of females in management occupations (except farmers):
Here: 1.7% city: 6.9%
- Percentage of females in business and financial operations occupations:
Here: 21.9% city: 5.1%
- Percentage of females in community and social services occupations:
Here: 5.3% city: 3.9%
- Percentage of females in legal occupations:
Here: 7.0% city: 0.7%
- Percentage of females in education, training, and library occupations:
Here: 1.7% city: 7.7%
- Percentage of females in arts, design, entertainment, sports, and media occupations:
Here: 1.4% city: 1.3%
- Percentage of females in healthcare practitioners and technical occupations:
Here: 24.0% city: 9.8%
- Percentage of females in service occupations:
Here: 2.9% city: 21.0%
- Percentage of females in sales and office occupations:
Here: 28.6% city: 31.9%
- Percentage of females in production occupations:
Here: 8.2% city: 2.2%
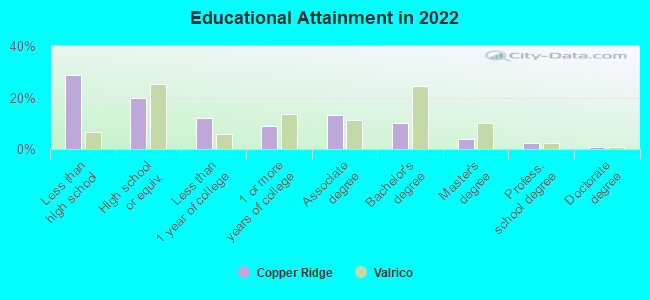
Education in this neighborhood (subdivision or community):
- Percentage of people 3 years and older in K-12 schools:
Copper Ridge: 12.5% Lakeland: 13.1%
- Percentage of people 3 years and older in undergraduate colleges:
Copper Ridge: 4.4% Lakeland: 10.0%
- Percentage of people 3 years and older in grad. or professional schools:
Copper Ridge: 2.9% Lakeland: 0.5%
- Percentage of students K-12 enrolled in private schools:
Copper Ridge: 17.5% Lakeland: 15.3%
Percentage of population below poverty level:
| Copper Ridge: | 9.3% |
| Lakeland: | 12.3% |
Median year owner moved in (as recorded in 2022):
Median year renter moved in (as recorded in 2022):
| Copper Ridge: | 2430 |
| Lakeland: | 2015 |
Median year renter moved in (as recorded in 2022):
| Copper Ridge: | 2435 |
| Lakeland: | 2020 |
Percentage of married-couple families with both working:
| Copper Ridge: | 92.3% |
| Lakeland: | 71.2% |
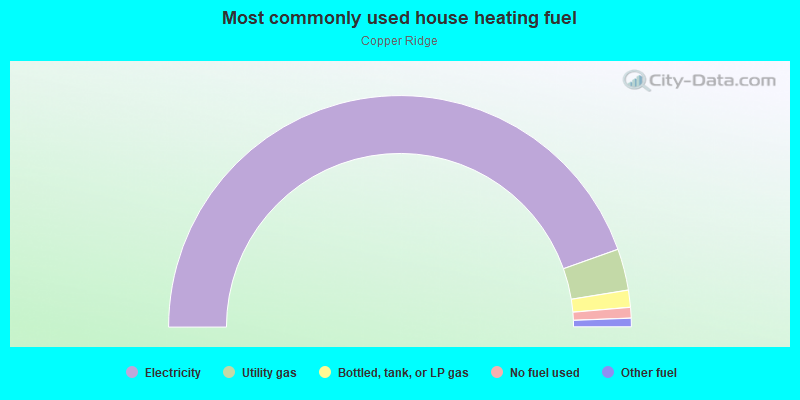
- 89.1%Electricity
- 5.8%Utility gas
- 2.4%Bottled, tank, or LP gas
- 1.5%No fuel used
- 1.2%Other fuel